CSEIT1831480 | Received : 16 Feb 2018 | Accepted : 27 Feb 2018 | January-February-2018 [(3) 1 : 1901-1907]
International Journal of Scientific Research in Computer Science, Engineering and Information Technology © 2018 IJSRCSEIT | Volume 3 | Issue 1 | ISSN : 2456-3307
1901
Automatic Detection of Retinal Hemorrhages by Exploiting
Retinal Images Processing by Using Moment Invariants-Based
Features
Godlin Atlas L*1, Kumar Parasuraman2
1Computer Science and information Technology, Maria College of Engineering and Technology, Chennai,
Tamil Nadu, India
2Center of Information Technology and Engineering, Manonmaniam Sundaranar University, Chennai, Tamil
Nadu, India
ABSTRACT
The technique demonstrates particularly exact for vessel location in STARE images. Its application to this database (notwithstanding when the NN was prepared on the DRIVE database) beats all examined division approaches. Diabetes occurs when the pancreas fails to secrete enough insulin, slowly affecting the retina of the human eye. As it progresses, the vision of a patient starts deteriorating, leading to diabetic retinopathy. In this regard, retinal images acquired through fundal camera aid in analyzing the consequences, nature, and status of the effect of diabetes on the eye. This paper displays another managed strategy for vein recognition in computerized retinal pictures. This strategy utilizes a neural system (NN) conspire for pixel arrangement and figures a 7-D vector made out of dim level and minute invariants-based highlights for pixel portrayal. The strategy was assessed on the openly accessible DRIVE and STARE databases, broadly utilized for this reason, since they contain retinal pictures where the vascular structure has been exactly set apart by specialists.Finally, classification of the different stages of eye disease was done using Random Forests technique based on the area and perimeter of the blood vessels and hemorrhages. Accuracy assessment of the classified output revealed that normal cases were classified with 90% accuracy while moderate and severe NPDR cases were 87.5% accurate. Keywords: Retina, Blood Vessel, Hemorrhages, Classification, Diabetic Retinopathy, Exudates, Image Processing, Mathematical Morphology.
I.
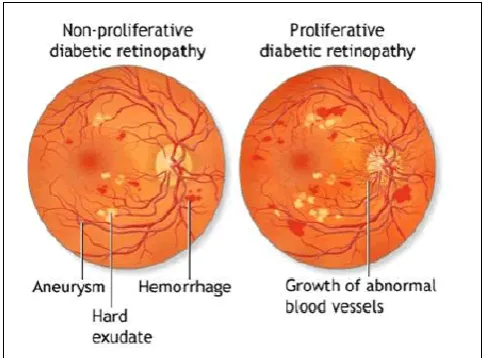
INTRODUCTIONDiabetes is one of the major diseases being faced by the worldtoday. World Health Organization (WHO) surveyestimated that 2.8% people suffered from diabetes in 2000, and thispercentagewouldincreaseto 4.4%in2030[1]. Diabetes is becoming common nowadays in people due to physical inactivity, obesity, and aging population. Diabetic retinopathy (DR) is a secondary microvascular complication of both type 1 and type 2 diabetes, the prevalence of which strongly correlates to both the duration of diabetes and the level of glycemic control as
evidenced by diabetes control and complication trial (DCCT) and UK prospective diabetes study [2, 3]. DR is the most frequent cause of new cases of blindness among the adults aged 20–64 years in the developed countries [4]. It is classified into non-proliferative DR (NPDR) andproliferative DR(PDR) stages.
the retina such as the inner nuclear and the outer plexiform layer. This is followed by the flame-shaped hemorrhages which occur in more superficial layers of the retina. Later as the disease progresses, the cotton-wool spots, venous beading, and the intrareg ionalmicrovascular abnormalities develop, which are the hallmarks of the progressive capillary perfusion [5].
Figure 1: Diabetic Retinopathy Various Fields
Neovascularization on the surface of the retina and the optic disc in conjunction with further retinal ischemia signifies the presence of the PDR [4, 6]. A review of most recent work on hemorrhage detection can be found in [7]. They primarily fall into three categories: pixel-based approaches, lesion-based approaches, and image-based approaches. Pixel-based approaches focus on the location of hemorrhages on
the retina. Lesion-based approaches use
morphological operations to define candidate lesions and count them. Image-based approaches are aimed at detecting images or eyes with hemorrhages. However, the size of the lesion is yet another important factor to consider in decision making processes of DR detection systems, which is closely related to the severity of disease that need timely treatment.
Large hemorrhages occur infrequently, and
theirappearance is highly variable, making their shape modeling and automated detection a
challenge.The employment of digital images for eye
diseases diagnosis could be exploited for
computerized early detection of DR. A system that could be used by nonexperts to filtrate cases of patients not affected by the disease, would reduce the specialists’ workload, and increase the effectiveness of preventive protocol sandearly the rapeutict reatments. Furthermore, itwouldalso result in economic benefits for public Health Systems, since cost-effective treatments associated to early illness detection lead to remarkable cost savings [8]. Since vascular anomalies are one of DR manifestations, automatic assessment of eye-fundus blood vessels is necessary for automated detection of DR.
As a previous step, vessel assessment demands vascular tree segmentation from the background for further processing. Knowledge on blood vessel location can be used to reduce the number of false positives in microaneurysm and hemorrhage detection [9]–[12]. Besides these applications motivated by automated early detection of DR, vascular tree segmentation proves useful for other clinical purposes: evaluation of the retinopathy of prematurity [15], arteriolar narrowing [16], [17], vessel tortuosity to characterize hypertensive retinopathy [18], vessel diameter measurement to diagnose hypertension and cardiovascular diseases [19]–[21], and computer-assisted laser surgery [22], [23], among others. On the other hand, the vascular tree can also be useful as valuable information to locate other fundus features such as the optic disc [24]–[26] and the fovea [27].
Monitoring: In order to assess the evolution of the disease, physicians have to compare images taken at different medical examinations. This allows one to
• evaluate for each patient the efficiency of the ophthalmologic and diabetic treatments;
• evaluate the efficiency of new therapeutics in a population of patients;
However, the comparison of images taken at different moments is a very time-consuming task and open to human error due to the distortions between images that make superposition very difficult, and due to the large number of lesions that have to be compared.
In this paper, a new methodology for blood vessel detection is presented. vector extracted from preprocessed retinal images and given as input to a neural network. Classification results (real values between 0 and 1) are thresholded to classify each pixel intotwo classes: vesselandnon-vessel. Finally,
apostprocessing fillspixelgapsin detecte
dbloodvesselsand removes falsely-detected isolated vessel pixels.
Related work
The supervised learning methods require some prior labeling of information in order to classify pixel as a vessel pixel or non-vesselpixel. The rule forv esselsegmentation is learned on the basis of train in gdatasetby the algorithm. In the trainingset, vesselsareprecisely segmen tedand mark edmanually by expert ophthalmologist in order to provide ground truth for learning process of the algorithm.
The supervised methods are based on pre-classified data; hence, their performances are better than those of the unsupervised approach. The blood vessels in retinal images appear darker than their surroundings. This characteristic of the blood vessel wasexploite dby Marinetal. [11].Theyproposed fivegray level and seven moment invariant (known as Hu moment invariant based) feature descriptors in combination with multilayered feed forward neural networks as a classifier that has 7 neurons in the input layer and 15
neurons in three hiddenlayers while out
putlayerconsistsofoneneur on only. The proposed algorithm proved to be robust and effective on multiple-image database and with different image variations.
The AUC, accuracy, specificity, and sensitivity of the proposed methods on STARE database are 0.9769, 0.9526, 98.19%, and 69.44%, respectively, and 0.9588, 0.9452, 98.01%, and 70.67%, respectively, on DRIVE. Similarly, Shanmugam and Banu [12] proposed five gray-level-based and two moment invariant-based features in combination with extreme learning machine (ELM) classifier for vessel segmentation in the retinal image.
The proposed technique has 0.9862 accuracy, 96.79% specificity, and 82.74% sensitivity on STARE database while the same algorithm has 0.9725 accuracy, 96.79% specificity, and 81.94% sensitivity on DRIVE database. Preethi and Vanithamani [13], proposed the use of moment invariant features with neural network and morphological processing in combination with support vector machine (SVM) as classifier and scored the accuracy of 0.9365 and 0.955,
respectively. AkitaandKuga [14] and
NekoveiandSun[15] exploited the artificial neural network and back propagation neural network respectively for blood vessel segmentation.
However, the results of both methods were produced by visual inspection. Sinthanayothin et al. [16] proposed a segmentation technique in which principle component analysis (PCA) was use
dincombination with neuralnet work for
vesselsegmentation and achieved the specificity of 83.3% and sensitivity of 91%. Niemeijer et al. [17] utilized gaussian matched filter, and first- and second-order gaussian derivatives on different scales with k-nearest neighbor (k-NN) classifier for vessel segmentation, and got the accuracy of 0.9416. Staal et al. [18] exploited the intrinsic property of retinal bloodvessels, found that thevesse lsareelongated structure, proposedimageridge-basedbloodvesselse
gmentation, and used k-NN classifier for
classification purposes. The proposed image
Existing Method
3) monitoring of the disease.
ImageEnhancement: Imagestake atstandard
examinations are often noisy and poorly contrasted. Over and above that, illumination is not uniform. Techniques improving contrast and sharpness and reducing noise are therefore required
as an aid for human interpretation of the fundus images;
as a first step toward automatic analysis of the fundus images.
Standard contrast stretching techniques have been applied by [1], [2], and [3]; methods that allow enhancement of certain features (e.g., only microaneurysms) have been proposed in [4]; image restoration techniques for images of very poor quality (e.g., due to cataracts) have been applied in [5] and [6].
Mass Screening: Computer-assisted mass screening for diagnosis of diabetic retinopathy is certainly the most important task to which image processing can contribute. Although the mechanisms for diabetic retinopathy are not fullyunderstood, itsprogress canbe in habited byearly diagnosis and treatment.
Hence, mass screening of all diabetic patients (even without vision impairment) would help to diagnose this disease early enough for an optimal treatment. An automated or semiautomated computer-assisted diagnosis could bring the following advantages:
diminution of the necessary resources in terms of specialists;
diminution of the examination time. The tasks for image processing may be divided into the following.
Automatic detection of pathologies:
microaneurysms ([7]–[11]), hard exudates and cotton wool spots [2], [11]–[13], hemorrhages, and edema.
Automatic detection of features of the retina: The vascular tree [1], [7], [14]–[19], and the optic disc ([14], [17], [1], [20], [19]). Feature detection is necessary for the identification of false positives in the pathology detection and for the classification of the pathologies in accordance with their severity.
Measurements on the detected pathologies that are difficult or too time consuming to be done manually. Monitoring: In order to assess the evolution of the disease, physicians have to compare images taken at different medical examinations. This allows one to
evaluate for each patient the efficiency of the ophthalmologic and diabetic treatments;
evaluate the efficiency of new therapeutics in a population of patients;
observe the development of single lesions (for example in order to study the turn-over effect of microaneurysms). patients (even without vision impairment) would help to diagnose this disease early enough for an optimal treatment. An automated or semiautomated
computer-assisted diagnosis could bring the
following advantages:
diminution of the examination time. The tasks for image processing may be divided into the following.
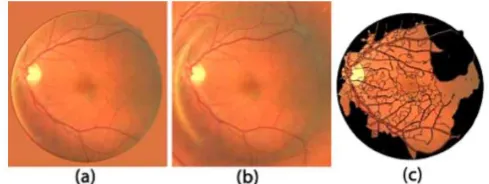
Figure 2. Splats located on field of view boundaries are excluded to eliminate edgeartifacts: (a) meancolor background; (b) mirrorcircularreflection; (c) valid splat coverage.
In Fig. 2. It is conventionally performed in two ways [20]. One is to fill the region outside FOV with the mean color of the region within FOV. The other possibility is to mirror the FOV outside the FOV. In Fig. 2(a), clear edges still exist as the mean color is not necessary to blend seamlessly with the color on boundaries of FOV [20]. In Fig. 2(b) bright strips are visible on the left and dark strips on the right due to imperfections of illumination or reflection during imaging process. If these artifacts were not completely eliminated, they would interfere with features to be identified. This problem can
beeasilyhandled with splat-based
imagerepresentation asisshownin Fig.2(c). While features are extracted from allofsplats, those contain
in gpixelsonthecircularboundariesof FOV are
excluded from further processing. Thisavoids abrupt intensity changes across platbound ariesanden ables
the retentionofonlysplatsformedby the real
contentofthe image.
Automatic detection of pathologies: microaneurysms ([7]–[11]), hard exudates and cotton wool spots [2], [11]–[13], hemorrhages, and edema.
Automatic detection of features of the retina: The vascular tree [1], [7], [14]–[19], and the optic disc ([14], [17], [1], [20], [19]). Feature detection is necessary for the identification of false positives in
the pathology detection and for the classification of the pathologies in accordance with their severity.
Measurements on the detected pathologies that are difficult or too time consuming to be done manually. Monitoring: In order to assess the evolution of the disease, physicians have to compare images taken at different medical examinations. This allows one to
evaluate for each patient the efficiency of the ophthalmologic and diabetic treatments;
evaluate the efficiency of new therapeutics in a population of patients;
observe the development of single lesions (for example in order to study the turn-over effect of microaneurysms).
II.
RESULTS AND DISCUSSIONFeature selection reduces the dimensionality of feature space by identifying relevant features and ignoring those irrelevant or redundant ones [30], which is particularly important to a higher separability between classes. There are two major approaches for feature selection: the filter approach and the wrapper approach [30]. The filter approach is fast, enabling their practical use on high dimensional feature spaces. It assesses individual feature separately without considering their interactions.
The wrapper approach assesses different
combinations of feature subsets tailored to a particular classification algorithm at the cost of longer computation time. To take advantage of both approaches, we use a two-step feature selection process—a filter approach followed by a wrapper approach.
Preliminary Feature Selection with a Filter Approach: The goal of preliminary feature selection is to exclude those individual features that are not effective or irrelevant in separating
TABLE I. LIST OF SPLAT FEATURES
Similar to the way splats are created so that hemorrhage boundaries are preserved precisely, splat features are more meaningful when response images exhibit high intra-splat similarity and low inter-splat similarity between target classes. To find the optimal strategy to aggregate pixel responses within each splat and associate it with a single feature value, two approaches are used, resulting in four sets of features.Firstly, the mean and standard deviation (SD) of filtering response within splat are computed. Tking the above DoG responses for example
Secondly, the mean and SD of filtering responses along boundaries of splat are calculated as additional features of that splat
III.
CONCLUSION
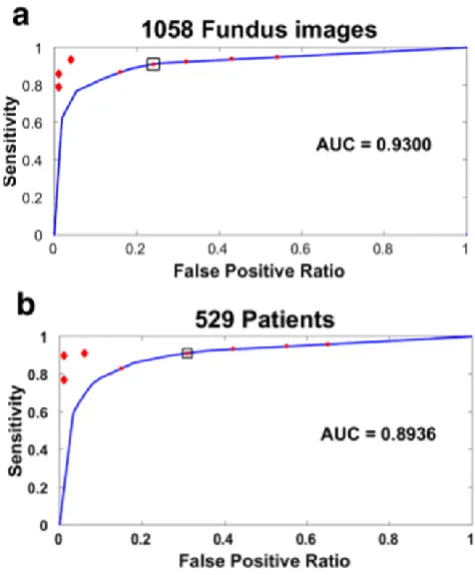
Image processing of color fundus images has the potential to play a major role in diagnosis of diabetic retinopathy. There are three different ways in which it can contribute: image enhancement, mass screening (including detection of pathologies and retinal features), and monitoring (including feature detection and registration of retinal images).The performance assessment on a sample of 1058 fundus images (229 with DME risk) and 529 people (150 with signs of the disease) indicate that the system can operate with a high sensitivity (≈90%), without faults in clinical cases requiring immediate treatment, and enough specificity (≈70%) from a patient-screening point of view. These values are promising in view of assessing the potential integration of the system into a diabetic retinopathy pre-screening tool.however, they are generally way more computationally expensive. This work can be further extended by fine tuning the results using adaptive thresholding techniques at the final stage and utilizing supervised learning methods.
IV.
REFERENCES
[1]. M. D. Abràmoff, J. M. Reinhardt, S. R. Russell, J. C. Folk, V. B. Ma-hajan, M. Niemeijer, and G. Quellec, "Automated early detection of diabetic retinopathy, " Ophthalmology, no. 6, pp. 1147-1154, Apr. .
[2]. O. Faust, R. Acharya U., E. Y. K. Ng, K.-H. Ng, and J. S. Suri, "Algo-rithms for the automated detection of diabetic retinopathy using digital fundus images: A review, " J. Med. Syst., Apr. . [3]. M. Niemeijer, M. D. Abramoff, and B. van
Ginneken, "Information fu-sion for diabetic retinopathy CAD in digital color fundus
"Optimal filter framework for automated, instantaneous detection of lesions in retinal images, " IEEE Trans. Med. Imag., vol. 30, no. 2, pp. 523-533, Feb. 2011.
[6]. Y. Hatanaka, T. Nakagawa, Y. Hayashi, M. Kakogawa, A. Sawada, K. Kawase, T. Hara, and H. Fujita, "Improvement of automatic hem-orrhages detection methods using brightness correction on fundus im-ages, " in Proc. SPIE, 2008, vol. 6915, pp. 69 153E-1-69 153E-10.
[7]. P. Jitpakdee, P. Aimmanee, and B.
Uyyanonvara, "A survey on hem-orrhage detection in diabetic retinopathy retinal images, " in Proc. 9thInt. Conf. Elect. Eng./Electron., Comput., Telecommun. Inf. Technol. (ECTI-CON), Bangkok, Thailand, 2012, pp. 1-4, vol..
[8]. M. Abràmoff, M. Garvin, and M. Sonka, "Retinal imaging and image analysis, " IEEE Rev. Biomed. Eng., vol. 3, pp. 169-208, 2010. [9]. S. C. H. Hoi, R. Jin, J. Zhu, and M. R. Lyu,
"Batch mode active learning and its application to medical image classification, " in Proc. ICML, 2006, pp. 417-424.
[10]. J. Fairfield, "Toboggan contrast enhancement for contrast segmenta-tion, " in Proc. Int. Conf. Pattern Recognit., 1990, vol. 1, pp. 712-716. [11]. N. V. Chawla, N. Japkowicz, and A. Kotcz,
"Editorial: Special issue on learning from imbalanced data sets, " SIGKDD Explorations, no. 1, 1-6, 2004.
[12]. C. L. Zitnick and S. B. Kang, "Stereo for
image-based rendering using image