Detecting Emotions in Mandarin Speech
Tsang-Long Pao, Yu-Te Chen, Jun-Heng Yeh and Jhih-Jheng Lu
Department of Computer Science and Engineering, Tatung University, Taipei
[email protected], [email protected], [email protected]
Abstract. In this paper, a Mandarin speech based emotion classification method is presented. Five primary human emotions including anger, boredom, happiness, neutral and sadness are investigated. For speech emotion recognition, we select 16 LPC coefficients, 12 LPCC components, 16 LFPC components, 16 PLP coefficients, 20 MFCC components and jitter as the basic features to form the feature vector. Two text-dependent and speaker-independent corpora are employed. The recognizer presented in this paper is based on three recognition techniques: LDA, K-NN, and HMMs. Results show that the selected features are robust and effective in the emotion recognition at the valence degree in both corpora. For the LDA emotion recognition, the highest accuracy of 79.9% is obtained. For the K-NN emotion recognition, the highest accuracy of 84.2% is obtained. And for the HMMs emotion recognition, the highest accuracy of 88.7% is achieved.
1 Introduction
Various opinions of emotions proposed by more than 100 scholars are summarized in a classical article [1]. Research on the cognitive component focuses on understanding the environmental and attended situations that gives rise to emotions; research on the physical components emphasizes the physiological response that co-occurs with an emotion or rapidly follows it. In short, emotions can be considered as communications to oneself and others [1]. Emotions consist of behaviors, physiologic changes and subjective experience as evoked by individual’s thoughts, socio-cultures and so on.
Emotions are traditionally classified into two main categories: primary (basic) and secondary (derived) emotions [2]. Primary or basic emotions generally could be experienced by all social mammals (e.g. humans, monkeys, dogs, whales) and have particular manifestations associated with them (e.g. vocal/facial expressions, behavioral tendencies, and physiological patterns). Secondary or derived emotions are the combination or derivation from primary emotions.
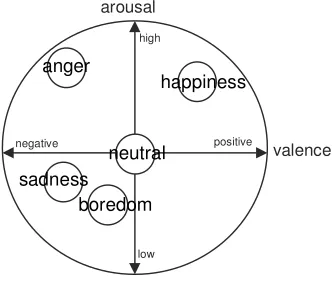
Emotional dimensionality is a simplified description of basic properties of emotional states. According to Osgood, Suci and Tannenbaum’s theory [3] and subsequent psychological research [4], the computing of emotions is conceptualized as three major dimensions of connotative meaning, arousal, valence and power. In general, the arousal and valence dimensions can be used to distinguish most basic emotions. The emotions location in arousal-valence space is shown in Fig. 1 [3], which results in a representation that is both simple and capable of conforming to wide emotional applications.
Fig. 1. Graphic representation of the arousal-valence theory of emotions
positive
negative valence
low high
anger
happiness
sadness boredom
neutral
overlapped with the adjacent frames by 128 samples. The next step is to apply Hamming window to each individual frame to minimize the signal discontinuities at the beginning and end of each frame. Each windowed speech frame is then converted into several types of parametric representation for further analysis and recognition.
Most effective features in speech processing are found in the frequency domain. The speech signal is more consistently and easily analyzed spectrally in the frequency domain than in the time domain. And the common model of speech production corresponds well to separate spectral models for the excitation and the vocal tract. The hearing mechanism appears to pay much more attention to spectral magnitude than to phase or timing aspects. For these reasons, the spectral analysis is used primarily to extract relevant features of the speech signal in this paper.
In base feature extraction procedure, we select 6 features, which are 16 Linear predictive coding (LPC) coefficients, 12 linear prediction cepstral coefficients (LPCC), 16 log frequency power coefficients (LFPC), 16 perceptual linear prediction (PLP) coefficients, 20 Mel-frequency cepstral coefficients (MFCC) and jitter extracted form a frame. LPC provides an accurate and economical representation of the envelope of the short-time power spectrum of speech [18]. For speech emotion recognition, LPCC and MFCC are the popular choices as features representing the phonetic content of speech [19-20]. LFPC is calculated from a log frequency filter bank which can be regarded as a model that follows the varying auditory resolving power of the human ear for various frequencies [13]. The combination of the discrete Fourier transform (DFT) and LPC technique is PLP [21]. PLP analysis is computationally efficient and permits a compact representation. Perturbations in the pitch period are called jitter, such perturbations occur naturally during continuous speech.
3.2 Feature Vector Quantization
To further compress the data for presentation to the final stage of the system, vector quantization is performed. The division into 16 clusters is carried out according to the Linde-Buzo-Gray (LBG) algorithm. The vector
f
nis assigned the codeword
c
n* according to the best match codebook clusterz
c using( , )
*
arg min
d f zn c
n l c C
c
=
≤ ≤ (1)For a speech utterance with N frames, the feature vector
Y
1 with 16 parameters is then obtained as* * * 1 [ 1 2... ]N
Y = c c c (2)
In another simple vector quantization method, we treat the mean feature parameters corresponding to each frames as a feature vector
Y
2. Therefore, another feature vectorY
2 with 81 parameters is then obtained.3.3 Classifiers
Three different classifiers, linear discriminate analysis (LDA), k-nearest neighbor (K-NN) decision rule, and Hidden Markov models (HMMs), are selected to train and test these two testing emotion corpora with the extracted features from Corpus I. In K-NN decision rule, there are three nearest samples closest to the testing sample. In HMMs, our experimental studies show that a 4-state discrete ergodic HMM gives the best performance compared with the left-right structure. The state transition probabilities and the output symbol probabilities are uniformly initialized.
4 Experimental Results
The selected features in Section 3.1 will be quantified as the LBG feature vector
Y
1 and the mean feature vectorY
2. Then the feature vectors will be trained and tested with three different classifiers, which are LDA, K-NN and HMMs. All these experimental results are validated by the leave-one-out (LOO) cross-validation method.4.1 The Experimental Results Using the Conventional Prosodic Features
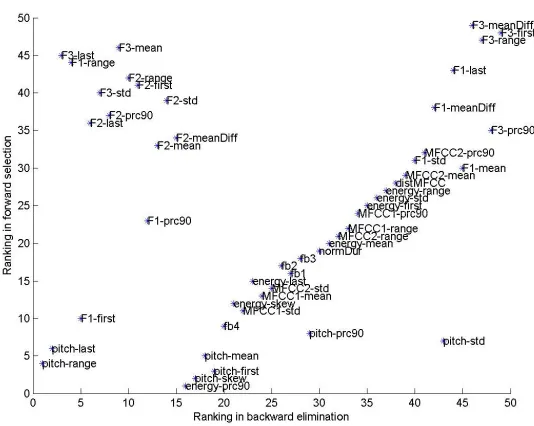
In [9], Kwon et al. drawled a two-dimensional plot of 59 features ranked by forward selection and backward elimination. Features near origin are considered to be more important. By imitating the ranking features method as [9], the speech features extracted from Corpus I are ranked by forward selection and backward elimination in Fig. 3. The experimental results of this Mandarin experiment and Kwon’s show that the pitch and energy related features are the most important components for the emotion speech recognition in both Mandarin and English. We select the first 15 features proposed by [9] from Corpus I to examine the efficiency and stability of the conventional emotion speech features. The first 15 features are pitch, log energy, F1, F2, F3, 5 filter bank energies, 2 MFCCs, delta pitch, acceleration of pitch, and 2 acceleration MFCCs. Then the feature vector
Y
2 and K-NN are used.Fig. 3. Conventional emotional speech features ranking
Table 4. The experimental result of conventional prosodic features Accuracy (%) Anger Boredom Happiness Neutral Sadness
Anger 59.5 1.1 34.4 4.4 2.6
Boredom 0 46.8 1.1 20.4 31.7
Happiness 32.4 2.5 58.7 4.2 2.2
Neutral 9.4 7.7 8.7 52.1 22.1
Sadness 1.7 29.4 2.4 17.6 48.9
Table 5. The experimental result of anger and happiness recognition
LDA K-NN HMMs
Accuracy (%) 1
Y
Y
2Y
1Y
2Y
1Y
2Anger 93.1 93.4 93.7 91.6 93.9 92.6 Happiness 87.7 91.2 90.4 92.8 91.2 93.5 Average 90.4 92.3 92.0 92.2 92.5 93.0
Table 6. The experimental result of boredom and sadness recognition
LDA K-NN HMMs
Accuracy (%) 1
Y
Y
2Y
1Y
2Y
1Y
2Boredom 89.5 90.5 89.7 92.1 90.5 94.3 Sadness 92.2 87.6 93.5 90.4 93.2 90.9 Average 90.8 89.0 91.6 91.0 91.8 92.6
4.2 Experimental Results of Valence Emotions Recognition
[16] R.S. Tato, R. Kompe, J.M. Pardo., “Emotional Space Improves Emotion Recognition,” ICSLP, pp. 2029-2032, 2002.
[17] , “ ,” master thesis of Engineering Science department, National Cheng Kung University, 2002.
[18] J.F. Kaiser, Discrete-Time Speech Signal Processing, pp.11-99, Prentic Hall PTR, 2002.
[19] B.S. Ata, “Effectiveness of Linear Prediction Characteristics of the Speech Wave for Automatic Speaker Identification and Verification,” Journal of the Acoustical Society of America, pp.1304-1312, 1974.
[20] S.B. Davis and P. Mermelstein, “Comparison of Parametric Representations of Monosyllabic Word Recognition in Continuously Spoken Sentences,” IEEE Transactions on Acoustics, Speech, and Signal Processing, pp. 357-366, 1980.