Evaluating Summaries for Multiple Documents in an Interactive Environment
Gees C. Stein, Tomek Strzalkowski, G. Bowden Wise and Amit Bagga
General Electric, Corporate R&D, 1 Research Circle, Niskayuna, NY 12309, USA {steing, strzalkowski, wisegb, bagga} @crd.ge.com
Abstract
While most people have a clear idea of what a single document summary should look like, this is not immediately obvious for a multi-document summary. There are many new questions to answer concerning the amount of multi-documents to be summarized, the type of documents, the kind of summary that should be generated, the way the summary gets presented to the user, etc. The many approaches possible to document summarization makes evaluation especially difficult. In this paper we will describe an approach to multi-document summarization and report work on an evaluation method for this particular system.
1.
Introduction
While most people have a clear idea of what a single document summary should look like, this is not immediately obvious for a multi-document summary. There are many new questions to answer concerning the amount of documents to be summarized, the type of documents, the kind of summary that should be generated, the way the summary gets presented to the user, etc. The many approaches possible to multi-document summarization makes evaluation especially difficult. In this paper we will describe an approach to multi-document summarization and report work on an evaluation method for this particular system. First, we describe our system including the different approaches used for producing the multi-document summaries. Next, we describe an evaluation metric to measure various facets of system performance. We conclude by reporting results from the experiments.
2.
Multi-Document Summarization
Our users are analysts that read news-like texts either to generate reports or to find specific information. The document sets used by these analysts vary from collections formed using profiles defining certain specific interests to collections covering a wide variety of topics. The number of documents handled at a time can vary from small (about 30 documents) to quite large (about 300 documents).
The development of our multi-document summarizer is based on a few simple initial assumptions. The documents to be summarized are text-only, news documents that are well formatted. The goal is to create indicative summaries which give the users the gist of the original documents; if of interest, the user can decide to read particular full-text documents for more details.
Our basic approach attempts to generate a text summary while avoiding the repetition of identical or similar information and presenting the information in such a way that makes sense to the reader. With this in mind we decided on the following basic algorithm:
1. Summarize each document
2. Group the summaries (documents) in clusters 3. For each cluster select representative passage(s) that will contribute to the final summary
4. Organize these passages in a logical way.
2.1.
Create individual summaries
The first step of the process of generating a multi-document summary is to create individual single-document summaries for all single-documents in the set.
This is done by creating a topical summary of 15% length using the user-specified topic and our SD (single-document) summarizer. Documents that seem to be irrelevant to the topic nevertheless result in a short default summary. In other words, no documents are filtered out using the SD summarizer. More details on the SD summarizer can be found in Strzalkowski et al. (1999), Strzalkowski, Stein and Wise (1998), Strzalkowski, Wang and Wise (1998).
2.2.
Group Summaries
The second step of the multi-document (MD) summarization process is the grouping of the individual summaries into clusters. At this point, the system must decide which SD summaries will be used for the final summary. The final summary should contain only the main topics covered by the documents since repetition or very similar topics do not add much extra value to the summary. Therefore, documents are ‘clustered’ on the basis of the contents of their summaries where a cluster consists of summaries that describe a similar topic. For those documents that seem to discuss a similar topic representative segments are chosen for the MD summary while the other ones are ‘hidden’, i.e., not shown but still accessible to the user.
Since the final multi-document summary is highly dependent on the clusters, we experimented with a variety of approaches for producing the clusters. Initially we used a single-pass algorithm (see, for instance, Rasmussen 1992). In this approach every new SD summary is compared to the longest summary in a cluster. We use a basic similarity metric to compare two summaries S1 and
S2: Dice’s coefficient (Van Rijsbergen, 1979). If sim(S1,S2) is larger than a certain threshold the two
duplicate and near-duplicate texts and one text being a subpart of the other.
The main advantage of using the single-pass algorithm if the fact that it is fast. However, the approach has several disadvantages; the clusters produced are rather incoherent, they are non-overlapping, and the final clusters depend on the order in which the summaries are processed. After positive feedback from our customer about the basic approach we decided to experiment with several clustering approaches. We replaced the single-pass approach with one that uses a graph-theoretic approach and computes a similarity matrix. In this approach, the nodes in a graph correspond to the individual summaries while an edge between two nodes corresponds to the similarity of the two corresponding summaries being above a certain user-defined threshold. It should be noted that the resulting graph may consist of several disjoint sub-graphs. In order to find coherent clusters, we find all maximal complete subgraphs (cliques) in this graph (Van Rijsbergen 1979, Everitt 1993).
We experimented with two different ways of postprocessing to merge those clusters that are very similar. This allows for overlapping clusters, one of the requirements of the customer. The first approach merges clusters that seem to address the same concept based on the words all members of a cluster have in common. If one cluster’s common-word set is a subset of another cluster’s common-word set, they are merged. We will refer to this approach as CLIQUE-1. The second approach looks at the number of members one cluster has in common with the other. If this number is higher than a certain percentage (variable), they are merged. We refer to this approach as CLIQUE-2. For the experiments described in the paper, we chose 50% as the cut-off for merging clusters in this approach.
Finally, we also implemented a basic hierarchical complete-link algorithm (Salton 1989) which is more time-efficient. We refer to this approach as CL. The algorithm starts with single member clusters and merges clusters with the highest similarity until no clusters can be merged. In our case this happens when no two clusters have a similarity value above the user-defined threshold. Cluster similarity is equal to the lowest value of similarity between any pair of elements e1 and e2 from respective clusters. The resulting clusters are complete subgraphs that are non-overlapping.
It should be noted that all approaches are order-independent, i.e., it does not matter in what order the documents are processed.
2.3.
Select representative passages
The third step of the multi-document summarization process involves selecting a member of a cluster as a representative summary for the cluster. When the user wants a topical summary, the topic description is used to pick the document that has most similarity to the topic. In the case of a generic summary, the representative summary chosen is one that best represents the cluster. In this case, the document that has most occurrences of the common terms across documents in a cluster is chosen. Since clusters can be overlapping it is possible that the same segment(s) is chosen to represent several clusters.
Our future plans include selecting one or more passages as opposed to selecting an entire document as the representative summary.
2.4.
Organize selected passages
Finally, the last step of the multi-document summarization process involves organizing the selected passages in an order that makes sense to the reader. Such an order might depend on the topic (in case of topical summaries), the user and the task at hand, among others. Currently, we organize the selected passages based upon topic similarity. For generic summaries, the organization involves placing “similar” documents together so that all information about a particular topic is placed contiguously. This is done using the same similarity metric mentioned above to compare two documents: similar passages are placed close to each other. Single-document clusters are shown separate.
For topical summaries we use similarity to the query description to order the representative passages, the most relevant passages are placed on top.
3.
The System
FIGURE 1: Screen of the Summarizer
The second screen (Figure 1) shows the results of the summarization. The large window in the middle of the screen, the text window, provides the user with one of several possible views of the multi-document summary. The possible views include the highest level final MD summary, “cluster” reports which simply are the representative summaries corresponding to each of the clusters (together with information such as common terms, query terms and headers of all documents in the cluster), the single document summaries for each document in a cluster, and the original document for each document in a cluster. The left window shows a tree structure describing how documents were clustered. Clicking on different ‘nodes’ in this tree gives the user access to all relevant data, ranging from the final high-level summary to the individual documents. The document numbers corresponding to each document make it easier for the user to keep track especially in cases when documents are placed in several different clusters.
An important feature of this screen is the slider that represents the threshold mentioned in ‘Group Summaries’ (2.2) used for clustering the documents. If this threshold is high documents need to have a high degree of similarity to be put in the same cluster. In general, increasing the threshold will result in more clusters, while lowering the threshold will result in fewer clusters. The desired threshold depends on the similarity or dissimilarity of the document collection, the user’s preference for high-level topic clusters or sub-topic clusters and the task at hand. The user can change this threshold easily using the slider. Currently, a default threshold is computed based on the
‘connectivity’ of the collection as implied by the similarity matrix.
4.
Evaluation
Ideally an evaluation metric for multi-document summaries would enable us to compare different approaches by analyzing the summaries. However, since there are many possible approaches to MD summarization, and many different variables regarding the quality of the final summaries (readability, cohesiveness, length, redundancy, breadth and depth of information reported, to name a few), such an algorithm does not currently exist. Additionally, evaluation is potentially very expensive if based on test sets with relevancy judgments and results that have to be judged. This was already a formidable task for single-document evaluation (Firmin and Chrzanowski 1999, Mani et al. 1998) and would be too expensive to carry out in our case. Taking these main problems into account we developed an evaluation metric specific to our multi-document summarization approach that is highly automated.
When looking at our system we can see three main factors that contribute to the final MD summary. First, the single document (SD) summarizer, second, the clustering mechanism, and last, the selection of representative segments that form the final summary.
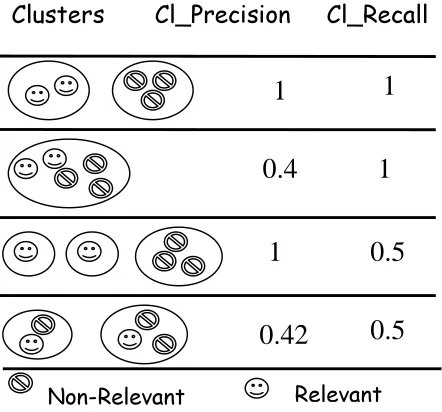
the TDT-TREC collection, CLIQUE-2 always did significantly better than the other two while CLIQUE-1 always came last. Merging clusters (to improve recall) based on similar concepts might still be a good idea but using common word sets is apparently too simple, and might require more sophisticated NLP techniques. Using simple common membership as the base for merging did turn out to improve results. The results also show that cluster precision is always very high, but cluster recall is relatively low, since the relevant documents are spread across several clusters.
The second test collection (TREC) was developed entirely from the TREC collection. This collection consists of 10 sets, each containing the first 50 documents retrieved for a TREC topic by Cornell’s SMART information retrieval system (version 11). Due to imperfect retrieval, these test sets contain non-relevant documents that are quite similar to the relevant documents. Therefore, this is a ‘harder’ test set than the TDT-TREC collection. On average a test set in TREC contained 14 relevant documents.
For the second set of experiments, our goal was to run tests across the TDT-TREC collection and the TREC test collection to compare the complexity of the test sets, using a wider range of thresholds (0.02 to 0.3). We used CL, since this algorithm is fast enough to handle low thresholds and produces relatively good clusters. Again, the lower thresholds gave the best results for both test collections (see Table 3). As expected, the TREC test sets are more difficult to process than the TDT-TREC test sets. For the TREC collection it was harder to separate the non-relevant documents from the non-relevant ones. In addition, relevant documents were spread, on average, across 4 clusters while for the TDT-TREC collection relevant documents were spread across 2 clusters, on average.
For TDT-TREC 15 of the test sets had a F-score of 1 for threshold 0.02, meaning that all relevant documents ended up in one cluster with no non-relevant documents in
the same cluster. For some test sets in the TREC collection an optimal F-score was found above 0.02. Decreasing or increasing the threshold did not improve clustering results for these test sets. Our next step to improve clustering results will be to experiment with different similarity metrics in order to make better comparisons between documents.
Low cluster precision is definitely a concern since a reader investigating a cluster will read many irrelevant documents. Low clustering recall can partially be addressed by forming the final summary. If the final MD summary selects the appropriate passages from the clusters the reader will still be guided towards the relevant documents and skip those clusters which are of no interest. For our next set of experiments we calculated overall recall and precision for the TREC collection using CL.
Experiments (Table 4) showed that often for those clusters containing a relevant document our system was capable of selecting a relevant representative document. In general, this task is easier for higher thresholds since higher thresholds result in more and smaller clusters. Obviously, it is easier to find a relevant document in a small set of documents than in a large set. Interestingly, for the lowest thresholds the selection of representative summaries improves a bit. Overall precision and recall both go down for lower threshold, but remain quite high. Please note that overall precision and recall are always 1 for single-size clusters. In order to judge the system these numbers should be used together with the clustering metric. It is up to the user to decide what is best for a certain task. If a user does not want to take the risk of overlooking anything, a high threshold (resulting in a higher overall f-score) should be used. If overlooking a few relevant documents is acceptable while there is no time to read most of the documents, a lower threshold resulting in a better clustering score should be used.
Algorithm Test set Threshold # of clusters # of relev.
clusters
Cl_Prec Cl_Recall F-score
CLIQUE-1 TDT-TREC 0.2 47.6 22.6 0.999 0.116 0.182
CLIQUE-2 TDT-TREC 0.2 33.1 10.1 0.995 0.454 0.565
CL TDT-TREC 0.2 29.3 10.1 0.999 0.196 0.311
CLIQUE-1 TDT-TREC 0.25 51 24.6 0.999 0.081 0.137
CLIQUE-2 TDT-TREC 0.25 43.3 17.6 0.999 0.211 0.280
CL TDT-TREC 0.25 35.8 13.5 1 0.141 0.237
CLIQUE-1 TDT-TREC 0.3 51.08 25.3 1 0.055 0.103
CLIQUE-2 TDT-TREC 0.3 43.8 18.6 1 0.156 0.244
CL TDT-TREC 0.3 41.3 17 1 0.102 0.179
Algorithm Test set Threshold # of clusters # of relev. clusters
Cl_Prec Cl_Recall F-score
CL TDT-TREC 0.02 7.3 1.8 0.988 0.808 0.868
CL TREC 0.02 16.6 3.9 0.478 0.535 0.465
CL TDT-TREC 0.025 7.6 2.0 0.993 0.795 0.862
CL TREC 0.025 17.1 4.1 0.497 0.497 0.461
TABLE 3: Best average results for Complete Link for both test collections
Threshold # of
lusters
# of rel. clusters
Cl Prec Cl _Recall Cl F-score Repres.
Summ %
Precision Recall
0.02 16.3 3.9 0.472 0.511 0.453 0.722 0.377 0.636
0.025 16.8 4.2 0.482 0.463 0.438 0.688 0.379 0.636
0.05 19.2 4.9 0.597 0.380 0.435 0.643 0.491 0.601
0.1 25.5 6.1 0.673 0.264 0.345 0.651 0.649 0.581
TABLE 4: Best average results for Complete Link on TREC test sets
5.
Related Work
Uramoto and Takeda (1998) have developed a system that visualizes certain characteristics of a set of documents by organizing them in a directed graph. Although no readable summary is generated, keywords indicated how documents are similar or different. Mani and Bloedorn (1997) also relate pairs of documents to each other showing similarities and differences. In addition, work by McKeown and Radev (McKeown and Radev 1995; Radev and McKeown 1998) relies on an ‘assumed’ system filling and selecting predefined templates used for the final summary. Later work by McKeown et al. (1999) breaks documents into paragraph-based units. These units are compared to each other to identify similar and dissimilar passages. A graph-based one-pass clustering algorithm is applied, using the similarity metric, to identify common topics/themes. Instead of picking a representative sentence from the paragraphs in a cluster, common phrases are identified which are used to generate a new representative sentence. The Carnegie Group’s work on multi-document summarization2 relies on the maximal marginal relevance measure to organize the final summary and detect redundancy. Similarly to our approach, clusters are formed and a representative segment is presented to the user.
In addition to natural language processing, clustering is used in many fields to analyze data. Therefore, many different clustering methods have been developed. Since the right clustering approach largely depends on the task at hand and the data set to be clustered there is no such thing as the best clustering method. For the purposes of our system we needed a fast (large amount of documents) algorithm that allows for overlap and creates coherent clusters. Ideally the clusters generated do not depend on the order the documents are processed in.
In spite of the many clustering approaches existing, relatively little work has been done in terms of their evaluation. Since each technique focuses on different aspects but it is hard to make general statements about
2 From TIPSTER notes and presentation, Fall 1998.
clustering techniques. We describe a few evaluation methodologies that we are aware of. Lorr (1983) describes evaluation done by applying different clustering techniques to the same artificial data sets or by comparing results to pre-defined classifications. In addition, task-specific evaluation has been done, for instance, when used for retrieval the effect of clustering was expressed in terms of improved retrieval results (El-Hamdouchi and Willett 1987, Voorhees 1986). However, in the case of our system we do not have pre-specified ‘perfect’ output, nor can we easily measure improved task performance since this is not directly linked to the clustering technique. We are currently not aware of any formal evaluation of multi-document summarization other than work described in McKeown et al. (1999). This evaluation is system specific and focuses in particular on three system components: the similarity metric (evaluated using TDT data), the theme phrase detection approach and the sentence generation capability.
6.
Discussion, Future Work
Our future work will be extending our current system since we feel the basic principles of clustering and organizing the summaries is a good one. Our current clique-based clustering methods produce coherent clusters but are too processing-intense for large number of clusters. Also, the number of clusters (cliques) found is non-linear with the user-defined threshold which is not always intuitive to the user. The next step will involve looking at an approach that is graph based but uses additional heuristic for large collections of documents. Complete-link has given good results and is relatively fast, but has as disadvantage not allowing for overlap. For a collection containing closely related topics a user might prefer a clique based algorithm, while for large sets and/or sets containing distinct topics the CL is preferable.
representative summaries is also an important aspect and will probably require a user-involved study.
Our current metric was for topical summaries and made use of known relevancy judgements. For generic summaries we will do a similar evaluation, using test sets containing documents from two or more topics. The cluster precision and recall can easily be expanded to measure clustering of multiple topics. Choosing a representative summary for a cluster will be slightly different; now one has to be chosen that best represents the whole cluster, probably the topic that is addressed by most members in the cluster. The final precision and recall could be averaged across topic.
Next we are planning to carry out a user evaluation, giving users specific tasks. We will look at the quality of the task completed, qualitative feedback and logged information such as documents accessed, time spent reading on (non)relevant documents etc. We will compare the results to baseline results for the same task only using the single-document summarizer. Additionally, we are collecting statistical information, logged by our system based on customer usage of the tool. We hope that analyzing this data will give us more insight in the user’s task, the system’s strengths and weaknesses and help us focus on what to do next.
Our initial evaluation method has been useful to us, especially since it can be ran automatically every time significant changes to the system are made. It identified some initial problems with the way the representative summary was picked and enabled us to evaluate the changes made. However, we still feel it is a challenge to develop a quantitative evaluation method that generalizes across MD summarizers. We hope that our task-oriented evaluation will give us more insight.
Acknowledgments
This paper is based upon work supported in part by the Defense Advanced Research Projects Agency under Tipster Phase-3 Contract 97-F157200-000.
7.
References
Allan, James, Jaime Carbonell, George Doddington, Jon Yamron and Y. Yang. 1998. Topic Detection and Tracking Pilot Study: Final Report. In Proceedings of the Broadcast News Understanding and Transcription Workshop, 194 – 218. Bagga, Amit and Breck Baldwin. 1998. Algorithms for Scoring
Coreference Chains. Linguistic Coreference Workshop at the 1st LREC, May 1998.
El-Hamdouchi, A., and P. Willett. 1987. Techniques for the Measurement of Clustering Tendency in Document Retrieval Systems. in Information Science, 13, 361- 65.
Everitt, Brian S. 1993. Cluster Analysis. 3rd Edition. Edward
Arnold: London.
Firmin, Thérèse and Michael J.Chrzanowski. 1999. An Evaluation of Automatic Text Summarization Systems. In Advances in automatic text summarization, Inderjeet Mani and Mark T. Maybury (eds). The MIT Press: Cambridge, Massachusetts.
Lorr, M. 1983. Cluster Analysis for Social Scientists: Techniques for Analyzing and Simplifying Complex Blocks of Data. Jossey-Bass: San Francisco.
Mani, I., D. House, G. Klein, L. Hirschman, L. Obrst, T. Firmin, M. Chrzanowski, B. Sundheim. 1998. The TIPSTER SUMMAC Text Summarization Evaluation, Final Report. Mitre Technical Report MTR 98W0000138.
Mani, Inderjeet and Eric Bloedorn. 1997. Multi-document Summarization by Graph Search and Matching. AAAI ’97, 622-628.
McKeown, Kathleen and Dragomir R. Radev. 1995. Generating Summaries of Multiple News Articles, SIGIR ’95, 74-82. McKeown, Kathleen R., Judith L. Klavans, Regina Barzilay and
Eleazar Eskin. 1999. Towards Multidocument Summarization by Reformulation: Progress and Prospects. AAAI ’99, 453 – 460.
Radev, Dragomir R., and Kathleen R. McKeown. 1998. Generating Natural Language Summaries from Multiple On-Line Sources. Computational Linguistics, Volume 24, Number 3.
Rasmussen, Edie. 1992. Clustering Algorithms. In Information Retrieval, Data Structures & Algorithms, William B. Frakes, Ricardo Baeza-Yates (editors), Prentice Hall: Englewood Cliffs, New Jersey.
Rijsbergen, C. J. van. 1979. Information Retrieval. Butterworths: London.
Salton, Gerard. 1989. Automatic Text Processing. Addison-Wesley Publishing Company: Reading, Massachusetts. Stein, Gees C., Tomek Strzalkowski and G. Bowden Wise. 1999.
Summarizing Multiple Documents using Text Extraction and Interactive Clustering. PACLING ’99, August 25-28, University of Waterloo, Ontario.
Strzalkowski, Tomek, Gees Stein, Jin Wang and Bowden Wise. 1999. A Robust Practical Text Summarizer. In Advances in Automated Text Summarization, Inderjeet Mani and Mark T. Maybury (eds.). The MIT Press.
Strzalkowski, Tomek, Gees Stein and G. Bowden Wise. 1998. A Text-Extraction Based Summarizer. TIPSTER Workshop, October 1998.
Strzalkowski, Tomek, Jin Wang and Bowden Wise. 1998. Summarization-based Query Expansion in Information Retrieval. COLING-ACL ’98, 1258-1264.
TIPSTER 1998a. Tipster text phase III 18-month workshop notes, May, Fairfax, VA.
TIPSTER 1998b. Tipster text phase III 24-month workshop notes, October, Baltimore, MD.
Uramoto, Naohiko and Koichi Takeda. 1998. A Method for Relating Multiple Newspaper Articles by Using Graphs, and Its Application to Webcasting. COLING-ACL ’98, 1307-1313.