Learning the Impact of Machine Translation Evaluation Metrics for
Semantic Textual Similarity
Simone Magnolini
University of Brescia, Fondazione Bruno Kessler
Trento, Italy [email protected]
Ngoc Phuoc An Vo
University of Trento, Fondazione Bruno Kessler
Trento, Italy [email protected]
Octavian Popescu
IBM Research, T.J. Watson Yorktown, US
Abstract
We present a work to evaluate the hy-pothesis that automatic evaluation metrics developed for Machine Translation (MT) systems have significant impact on pre-dicting semantic similarity scores in Se-mantic Textual Similarity (STS) task for English, in light of their usage for para-phrase identification. We show that differ-ent metrics may have differdiffer-ent behaviors and significance along the semantic scale [0-5] of the STS task. In addition, we com-pare several classification algorithms us-ing a combination of different MT metrics to build an STS system; consequently, we show that although this approach obtains state of the art result in paraphrase iden-tification task, it is insufficient to achieve the same result in STS.
1 Introduction
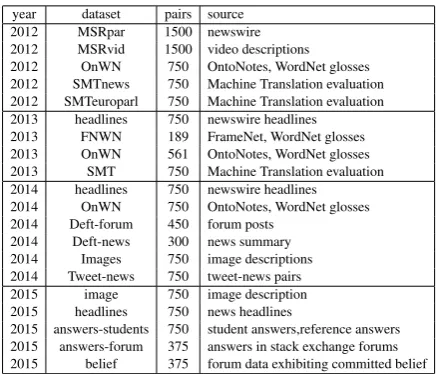
Semantic related tasks have become a noticed trend in Natural Language Processing (NLP) com-munity. Particularly, the Semantic Textual Simi-larity (STS) task has captured a huge attention in the NLP community despite being recently intro-duced since SemEval 2012 and continuing in Se-mEval 2013, 2014 and 2015 (Agirre et al., 2012; Agirre et al., 2013; Agirre et al., 2014; Agirre et al., 2015). Basically, the task requires to build sys-tems which can compute the similarity degree be-tween two given sentences. The similarity degree is scaled as a real score from 0 (no relevance) to 5 (semantic equivalence). The evaluation is done by computing the correlation between human judg-ment scores and systems’ predictions by the mean of Pearson correlation method.
In contrast, Machine Translation evaluation metrics are designed to assess if the output of a
MT system is semantically equivalent to a set of reference translations. In SemEval 2012, the sys-tem made by (de Souza et al., 2012) and then the system (Barrón Cedeño et al., 2013) in SemEval 2013 introduced the approach of using a set of MT evaluation metrics together with other lexi-cal and syntactic features to predict the semantic similarity scores in STS. Although this approach shows promising results, there was no in-depth analysis on the impact of the evaluation metrics to the overall performance and how each metric be-haves on STS data. Moreover, as being inspired by the literature (Madnani et al., 2012) for para-phrase recognition, which obtains the state of art result on the Microsoft Research paraphrase cor-pus (MSRP) (Dolan et al., 2004), we decide to an-alyze the impact of MT evaluation metrics in STS.
Our aim consists of two folds, (1) to obtain a clear idea of how each individual metric behaves and correlates with the human-judgement seman-tic similarity, and (2) to examine the approach of combining a set of chosen metrics to build regres-sion models for predicting the semantic similarity scores and analyze the incorporation of these met-rics in regarding to the overall performance of the system. To achieve our goal, we divide our re-search in two main aspects: first, we evaluate the correlation between each single MT metric and the human-annotation scores; and second, we evaluate how different classification algorithms perform us-ing these metrics as features.
The remainder of this paper is organized as fol-lows: Section 2 presents the description of differ-ent MT evaluation metrics, Section 3 reports the experimental settings, Section 4 is the evaluation and discussion, and finally, Section 5 is conclu-sions and future work.
the output results to the scale [0-1].
Next, we combine the outputs of these four met-rics to build eight different regression models us-ing different classification algorithms in WEKA (e.g. IsotonicRegression, LeastMedSq, Mul-tilayerPerceptron, SimpleLinearRegression, Lin-earRegression, M5Rules, M5 Model Trees, and DecisionTable). We only use the default settings of each algorithm without tuning any parameter because our goal is to compare the results of dif-ferent approaches, not to obtain high performance. We evaluate each model twice, (i) by a 10-fold cross validation on training data, and (ii) we eval-uate the model on the test data (STS 2015 dataset). For the comparison, we use the official baseline of STS task which uses the bag-of-words approach to represent each sentence as a vector in the multi-dimensional token space (each dimension has 1 if the token is present in the sentence, 0 otherwise) and computes the cosine similarity between vec-tors.
4 Evaluations and Discussions
4.1 Evaluation of Individual Metric
The Pearson correlation and RELIEF analysis of each single metric compared to the human-annotation scores are presented in Table 2. Ac-cording to both methods, the METEOR tends to be the superior metric, while in contrast TERp has low values in both. We split the BLEU metric into four values for 1-gram, 2-gram, 3-gram and 4-gram. The Pearson correlation shows that the smaller size of n-gram overlap, the more correla-tion with the human judgment obtained. In over-all, except TER that has inverse correlation which is the more negative result, the better correlation with human annotation scores, other metrics have reasonable correlation. Nevertheless, another er-ror metric, TERp does not perform well and re-turns a positive correlation, opposite to the TER metric.
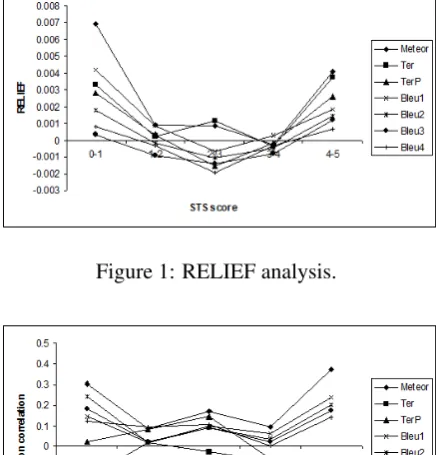
We also investigate the behaviour of each met-ric deeper inside each score bracket in the STS se-mantic scale. We plot the output of each metric in corresponding to each score bracket [0-1], [1-2], [2-3], [3-4] and [4-5] to see how each MT metric behaves on each score bracket. The results of RE-LIEF analysis and Pearson correlation in Figure 1 and 2 show that most of the metrics perform well in two particular score brackets [0-1] and [4-5]. This means that by deploying MT evaluation
met-Figure 1: RELIEF analysis.
Figure 2: Pearson correlation.
rics for STS task, the system will be able to obtain a high precision of predicting the semantic simi-larity for two cases "not/almost not relevant" and "equivalent/almost equivalent". This investigation can help to significantly improve the overall per-formance of a STS system by increasing the accu-racy of predicting the scores in brackets [0-1] and [4-5]. In contrast, both figures have a central re-gion where the correlation scores decrease signif-icantly, and even worst for TERp where Pearson correlation changes signs, that means that in some regions this metric switches from direct to inverse correlation.
RELIEF Pearson METEOR 0.00503 0.56065 TER -0.00157 -0.25673 TERp -0.00098 0.21047 BLEU-1 -0.00145 0.36800 BLEU-2 -0.00201 0.31801 BLEU-3 -0.00203 0.27074 BLEU-4 -0.00249 0.27233
IR LMS MLP SLR LR M5R M5P DT Baseline BestSys Cross-validation 0.610 0.629 0.606 0.560 0.653 0.737 0.739 0.698 0.382 -Test set 0.702 0.643 0.694 0.688 0.612 0.609 0.611 0.588 0.587 0.801
Standard deviation 0.429 0.458 0.475 0.444 0.404 0.363 0.363 0.386 0.579
-Table 3: Evaluation of the different algorithms: Pearson coefficient (IR: IsotonicRegression, LMS: LeastMedSq, MLP: MultilayerPerceptron, SLR: SimpleLinearRegression, LR: LinearRegression, M5R: M5Rules, M5P: M5 Model Trees, DT: DecisionTable, Baseline: STS Baseline, BestSys: 1st ranked system in STS 2015).
This enlightens an important difference be-tween the impact of these metrics on STS task and on the paraphrase recognition task: while MT metrics show acceptable performance distinguish-ing the border regions, i.e. the most similar (al-most paraphrase) and the (al-most dissimilar, they have worse performance in the middle regions.
4.2 Evaluation of Metric Combination
We examine the impact of the combination of all metrics to the overall performance in STS by building several regression models using all the metric outputs as features. Since every metric and also the STS score is a numeric value we use nor-mal regression algorithms. The results of these analysis are reported in Table 3 which shows, (i) the average of the 10-Folds cross-validation on the training data, (ii) the overall performance on the test data, and (iii) to better describe the differ-ent algorithms, we also report the standard devia-tion (SD) of the ten standard deviadevia-tions from ten folds; we use this measure as an index to evaluate if the performances of the classifier during cross-validation are uniform or present some instability due to specific fold.
We group the models into two groups by a threshold of the standard deviation (SD = 0.41) in which the lower SD, the more reliable model is and vice versa. It is interesting to notice that more stable models (on the right hand side) perform well the cross-validation on the training dataset, but obtain low performance on the test dataset, in a margin of 10% (except the LR having mar-gin of 1%). Nevertheless, the less stable mod-els (on the left hand side) obtain better results on the test dataset and low performance on the cross-validation, in a margin of 2-10%. From our obser-vation, another important aspect is that not all the algorithms use all given features in the same way, but during the training phase Isotonic Regression (IR) and Simple Linear Regression (SLR) discard
other features and use only METEOR metric. Another interesting observation is the different learning approaches of different algorithms taking advantage from MT metrics. Some algorithms can learn more information from the combination of these metrics and perform well the cross valida-tion on training data, but when being evaluated on the test data, the model is strongly penalized by the domain-independence datasets in STS. In our case the STS 2012, 2013 and 2014 datasets are dif-ferent from the STS 2015, which leads to an over-fitting of the systems that builds the model using all these features. On the other hand, algorithms which are not so optimized can use MT metrics in a more flexible way to obtain good result on the test dataset.
In overall, all the regression models using com-bination of MT metrics outperform the task base-line in both cross validation on training dataset (by a large margin of 22-36%) and performance on test dataset (by a margin of 0.1-12%). However, none of these models can compare to the best sys-tem on the test dataset, the difference between the best model and the best system is a large margin of 10%. This proves that using only MT metric is not sufficient and efficient enough to solve the STS task. But combining MT metrics with other linguistic features may return promising result.
5 Conclusions and Future Work