Finger Print Detection Technique
Vijay Kumar Choudhary 1, Krishna Malik 21M. Tech Student, 2Asstt. Professor
1,2Department of Computer Science & Engineering Shanti Niketan College of Engineering. Hisar, Haryana, India
ABSTRACT
Fingerprint recognition refers to the automatic method of verifying a match between two human finger prints. Whether two sets of fingerprint ridge descriptions come from a single finger or not is determined by a process of fingerprint matching. This system used minutiae and fuzzy logic as recognition technique. And for the analyzing purpose PSNR and MSE. The matching of fingerprint and features of a fingerprint image are the major feature of Minutiae. Depending on the fingerprint scanner resolution and placement of finger on the sensor, a good quality fingerprint image can be between 25 to 80 minutes. Fuzzy C-mean (FCM) is a data clustering technique in which each data point is related to the cluster which is up to a certain degree specified by the membership grade. The main advantage of fuzzy C- Clustering means that it allows groups to sequentially subscribe to data points, which gives flexibility to express data points, may be related to more than one cluster. The main purpose of this paper is to develop a precise, fast and very efficient system of fingerprint verification techniques. The test included the various process such as fingerprint verification is done by using fuzzy c on the image, clustering of image by finding two center point, enhancement, making mask, finding minutiae, filtering false minutiae, matching of input image with the database, generating PSNR and MSE of the image. A quality measurement between the original and a compressed image is commonly known as Peak Signal to Noise Ratio where as MSE represents the cumulative squared error between the compressed and the original image. The greater the PSNR, the enhanced the quality of the compressed, or reconstructed image whereas lower the value of MSE, the lower the error.
Keywords : Minutiae, Image segmentation, PSNR and MSE.
I.
INTRODUCTIONIn a slight sense a fingerprint is the inscription left from the friction mount of a human finger. [1] In forensic science the recovery of fingerprints from a crime scene is an important method. Fingerprints are easily deposited on suitable surfaces (such as glass or metal or polished stone) by the natural secretions of sweat from the eccrine glands that are present in epidermal ridges. These are sometimes referred to as "Attempted Impressions". One print from the sole of the foot can leave an effect of friction roof. [2]
Fingerprint intentional impressions can be
transferred through the peak of friction on the skin
by ink or other substances, relatively smooth surface such as fingerprint card.
II.
TECHNIQUE USEDIn this system we have used two recognition technique Minutiae and Fuzzy logic.
Minutiae technique:
Algorithm Based Design
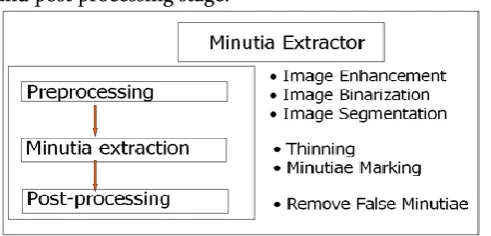
To implement a minutia extractor, three stages are there. They are pre-processing, minutia extraction and post processing stage.
Fig 1 Minutia extraction and post processing stage
Fuzzy logic:
The display of the clustering algorithm for image splitting is highly sensitive to the types of features and objects used in the image and therefore it is difficult to generalize this technique new shape-based image splitting algorithm is called fuzzy clustering for image splitting using generic shape information that integrates the clustering framework.
III.
PARAMETER ANALYSISIn this test we have consider a finger print detection technique system. This system included a database of ten test image of finger print which is matched with an input image selected by the user.
The analysis of the system involved with two parameters that are as followed:
PSNR (Peak Signal to Noise Ratio):
The PSNR block computes the peak signal-to-noise ratio, in decibels, between two images. This ratio is often used as the original and compressed image of qualitative measurement.
MSE (Mean Square Error):
Image compression quality is compared by two error metric The Mean Square Error (MSE) and the Peak Signal to Noise Ratio (PSNR). The MSE represents the cumulative squared error between the compressed and the original image, whereas PSNR represents a measure of the peak error. The lower the value of MSE, the lower the error.
IV.
RESULTIn this detection of biometric system include two modules.
The first module matches all the ten images of finger print with the input image without fuzzy and generators the PSNR and MSE of the image.
The second module matches all the ten images of finger print with the input image fuzzy and generators the PSNR and MSE of the image.
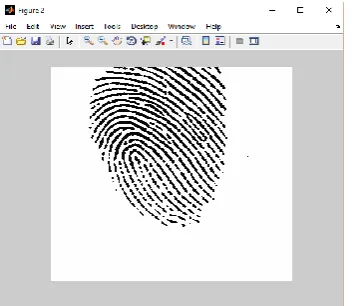
Fig 2 shows the database of fingerprint recognition system
Test 1 Process Steps Involve
Enhancement
Making Mask
Finding Minutiae
Filtering False Minutiae
Matching of Input Image with The Database
Generating PSNR and MSE of The Image
Fig 3 Show the Minutiae finding of Test image 1 without Fuzzy.
>>> filtering false minutiae done.
Computing similarity between 1.tif and 1 from FVC2002: 1
Computing similarity between 1.tif and 2 from FVC2002: 0.77067
Computing similarity between 1.tif and 3 from FVC2002: 0.68476
Computing similarity between 1.tif and 4 from FVC2002: 0.19978
Computing similarity between 1.tif and 5 from FVC2002: 0.28721
Computing similarity between 1.tif and 6 from FVC2002: 0.71263
Computing similarity between 1.tif and 7 from FVC2002: 0.5766
Computing similarity between 1.tif and 8 from FVC2002: 0.2176
Computing similarity between 1.tif and 9 from FVC2002: 0.19739
Computing similarity between 1.tif and 10 from FVC2002: 0.24535
Matched_FingerPrints = 1
The Peak-SNR value is 23.0834 The MSE value is 66.96021
Table 1 Analysis of test image 1 without fuzzy Input image without
fuzzy
PSNR MSE
1.tif 23.0834 66.96021
Table 1 and Graph 1 show the PSNR and MSE of image 1 without fuzzy.
Graph 1 PSNR and MSE graph for test image 1 without fuzzy
After calculation the PSNR is 23.0834 and MSE is 66.96021.
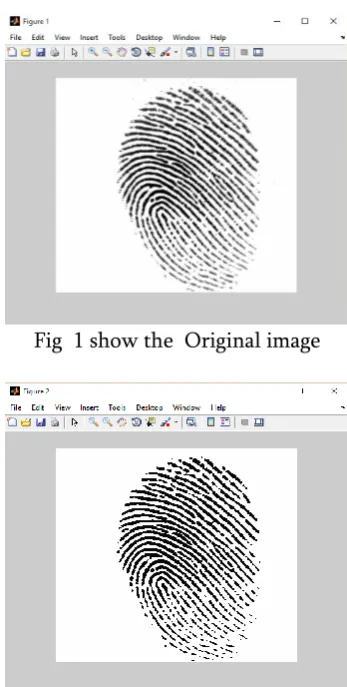
Fig 1 show the Original image
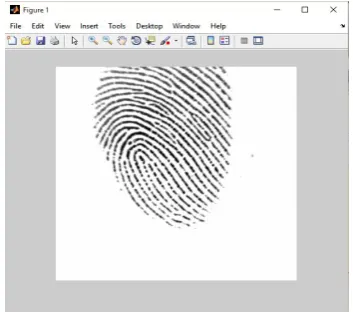
Fig 2 Show the enhancement image of the original image
Fig 3 Show the Minutiae finding of Test image 1 without fuzzy.
Process Steps Involve
Applying Fuzzy C on the image.
23.083 4
66.960 21
0 20 40 60 80
PSNR MSE
Clustering of image by finding two center point
Enhancement
Making Mask
Finding Minutiae
Filtering False Minutiae
Matching of Input Image with The Database
Generating PSNR and MSE of The Image
ttFcm =
The final cluster centers are ccc1 =
73.1212 ccc2 = 248.9800
Extracting features from fuzzysegmented.jpg ... >>> enhancement done.
>>> making mask done. >>> finding minutiae done. >>> filtering false minutiae done.
Computing similarity between fuzzysegmented.jpg and 1 from FVC2002: 0.95455
Computing similarity between fuzzysegmented.jpg and 2 from FVC2002: 0.2103
Computing similarity between fuzzysegmented.jpg and 3 from FVC2002: 0.77067
Computing similarity between fuzzysegmented.jpg and 4 from FVC2002: 0.63585
Computing similarity between fuzzysegmented.jpg and 5 from FVC2002: 0.79091
Computing similarity between fuzzysegmented.jpg and 6 from FVC2002: 0.60678
Computing similarity between fuzzysegmented.jpg and 7 from FVC2002: 0.75222
Computing similarity between fuzzysegmented.jpg and 8 from FVC2002: 0.50452
Computing similarity between fuzzysegmented.jpg and 9 from FVC2002: 0.29848
Computing similarity between fuzzysegmented.jpg and 10 from FVC2002: 0.23028
Matched_FingerPrints = 1
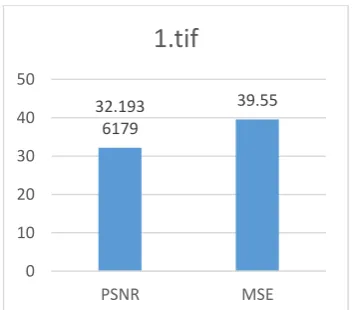
MSE: 39.55 PSNR:32.1936179
Table 2 Analysis of Test Image 1 With Fuzzy Input image with
fuzzy
PSNR MSE
1.tif 32.1936179 39.55
Table 2 and Graph 2 show the PSNR and MSE of image 1 with fuzzy.
Graph 2 PSNR and MSE graph for test image 1 with fuzzy
After calculation the PSNR is 32.19361 and MSE is 39.55.
Test 2 Process
Steps Involve
Enhancement
Making Mask
Finding Minutiae
Filtering False Minutiae
Matching of Input Image with The Database
Generating PSNR and MSE of The Image
Fig 4 Show the Minutiae finding of Test image 2
Extracting features from 2.tif ... >>> enhancement done. >>> making mask done. >>> finding minutiae done. >>> filtering false minutiae done.
Computing similarity between 2.tif and 1 from FVC2002: 0.82572
Computing similarity between 2.tif and 2 from FVC2002: 1
Computing similarity between 2.tif and 3 from FVC2002: 0.77005
Computing similarity between 2.tif and 4 from FVC2002: 0.20162
Computing similarity between 2.tif and 5 from FVC2002: 0.29814
Computing similarity between 2.tif and 6 from FVC2002: 0.6233
Computing similarity between 2.tif and 7 from FVC2002: 0.56737
Computing similarity between 2.tif and 8 from FVC2002: 0.26352
Computing similarity between 2.tif and 9 from FVC2002: 0.1992
Computing similarity between 2.tif and 10 from FVC2002: 0.21224
Matched_FingerPrints =
2
The Peak-SNR value is 24.1202 The MSE value is 52.2941
Table 3 Analysis of Test Image 2 Without Fuzzy Input image
without fuzzy
PSNR MSE
2.tif 24.1202 52.2941
Table 3 and Graph 3 show the PSNR and MSE of image 2 without fuzzy.
Graph 3 PSNR and MSE graph for test image 2 without fuzzy
After the Evaluation the value PSNR is 24.1202 and MSE is 52.2941.
Fig 11 Show the Original image
24.120 2
52.294 1
0 10 20 30 40 50 60
PSNR MSE
Fig 12 Show the enhancement image of the original image
Fig 13 Show the Minutiae finding of Test image 2 with Fuzzy.
Process Steps Involve
Applying Fuzzy C on the image.
Clustering of image by finding two center point
Enhancement
Making Mask
Finding Minutiae
Filtering False Minutiae
Matching of Input Image with The Database
Generating PSNR and MSE of The Image
ttFcm = 1 ttFcm = 2 ttFcm = 3 ttFcm = 4
ttFcm = 5 ttFcm = 6 ttFcm = 7 ttFcm = 8 ttFcm = 9 ttFcm = 10
The final cluster centers are ccc1 =
99.4623 ccc2 = 250.9419
Extracting features from fuzzysegmented.jpg ... >>> enhancement done.
>>> making mask done. >>> finding minutiae done. >>> filtering false minutiae done.
Computing similarity between fuzzysegmented.jpg and 1 from FVC2002: 0.7995
Computing similarity between fuzzysegmented.jpg and 2 from FVC2002: 0.96825
Computing similarity between fuzzysegmented.jpg and 3 from FVC2002: 0.80296
Computing similarity between fuzzysegmented.jpg and 4 from FVC2002: 0.23426
Computing similarity between fuzzysegmented.jpg and 5 from FVC2002: 0.28868
Computing similarity between fuzzysegmented.jpg and 6 from FVC2002: 0.60351
Computing similarity between fuzzysegmented.jpg and 7 from FVC2002: 0.59161
Computing similarity between fuzzysegmented.jpg and 8 from FVC2002: 0.25516
Computing similarity between fuzzysegmented.jpg and 9 from FVC2002: 0.19288
Computing similarity between fuzzysegmented.jpg and 10 from FVC2002: 0.2055
Matched_FingerPrints = 2
Table 4 Analysis of Test Image 2 With Fuzzy
Table 4 and Graph 4 show the PSNR and MSE of image 2 with fuzzy.
Graph 4 PSNR and MSE graph for test image 2 with fuzzy After the Evaluation the value PSNR is 32.6462426 and MSE is35.63.
V.
COMPARISIONComparative analysis of PSNR and MSE
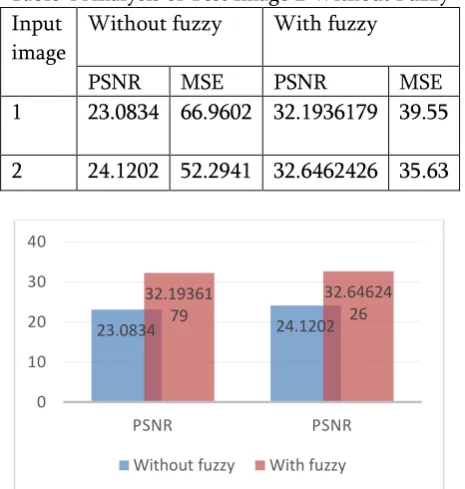
Table 4 Analysis of Test Image 2 Without Fuzzy Input
image
Without fuzzy With fuzzy
PSNR MSE PSNR MSE
1 23.0834 66.9602 32.1936179 39.55
2 24.1202 52.2941 32.6462426 35.63
Graph 5 Comparative anaylsis PSNR without and with fuzzy
This graph show the value of PSNR without fuzzy and with fuzzy. The evaluation with fuzzy show the value of PSNR is 39.50% more then PSNR without fuzzy .In the second test also the value of PSNR with fuzzy is 35.30% more then PSNR without fuzzy.
Graph 6 Comparative analysis MSE without and with fuzzy
This graph show the value of MSE without fuzzy and with fuzzy. The evaluation with fuzzy show the value of MSE is 40.90% less then MSE without fuzzy .In the second test also the value of MSE with fuzzy is 31.90% less then MSE without fuzzy.
VI.
CONCLUSIONSBiometrics are automatically identified on the basis of their behavior and biological characteristics It depends on the assumption that individuals are physically and professionally specific in many ways. This research paper include the different steps involved in the development of a Minutiae and fuzzy logic based Fingerprint identification and verification.
After analysis all the result and test conclude that the of value PSNR is 37% high with respect to fuzzy than without fuzzy which should be high. And the value
23.0834 24.1202
32.19361
Without fuzzy With fuzzy
66.9602
Without fuzzy With fuzzy
Input image with fuzzy
PSNR MSE
VII.
REFERENCES[1] Umesh Singh Tomar, Abhinav Vidwans, “A Review of Fingerprint Recognition by Minutiae’s Analysis” in IJEAIS (International Journal of Engineering and Information Systems) Issues, Vol. 1 Issue 8, ISSN: 2000-000X, October – 2017.