R E S E A R C H
Open Access
A connectivity-aware intersection-based routing
in VANETs
Chen Chen
1,2*, Yanan Jin
1, Qingqi Pei
1and Ning Zhang
1Abstract
Vehicularad hocnetworks (VANETs) are going to be an important communication infrastructure in our moving life. The design of routing protocols in VANETs is a significant and necessary issue for supporting VANET-based applications. However, due to high mobility, frequent link disconnection, and uneven distribution of vehicles, it becomes quite challenging to establish a robust route for delivering packets. This paper presents a connectivity-aware intersection-based routing (CAIR) protocol to address these problems by selecting an optimal route with higher probability of connectivity and lower experienced delay; then, geographical forwarding based on position prediction is used to transfer packets between any two intersections along the route. Simulation results show that the proposed protocol outperforms existing routing protocols in terms of data delivery ratio and average transmission delay in typical urban scenarios.
Keywords:VANETs; Geographic routing; Connectivity; Delay estimation; Position-based prediction
1 Introduction
Vehicular ad hoc networks (VANETs) represent a par-ticular subclass of mobile ad hoc networks (MANETs), used for communication and cooperation driving between cars on the road. VANETs are one of the influencing areas for the improvement of intelligent transportation system (ITS) in order to provide safety and comfort to the road users. VANETs assist vehicle drivers to communicate and coordinate among themselves in order to avoid any critical situation through vehicle to vehicle information ex-changes, e.g., road accidents, traffic jams, speed violation, and unseen obstacles, etc. Besides safety applications, VANETs also provide entertainment-related applications among drivers. For example, weather information, mobile e-commerce, Internet access, and other multimedia ser-vices. Although being a subclass of MANETs, VANETs have many unique characters different from traditional MANETs. The most significant differences are the special mobility pattern and rapid changing topology, so it might not be effective to apply the existing routing protocols from MANETs to VANETs.
In urban VANETs, more issues should be considered in the design of routing protocols such as the large num-ber of vehicles, various traffic signals, the restricted movement area, uneven vehicle distributions, no trans-mitting power constraints, obstacles such as skyscrapers and big trees, etc. Among these factors, the impact of obstacles on the communication quality is a more repre-sentative characteristic in urban scenario. As an ex-ample, when considering two vehicles that are driving on parallel roads separated by irregularly spaced build-ings, the channel conditions for transmissions between both nodes might quickly alternate between a near-perfect, lossless channel and strong (but predictable) shadowing [1].
Consequently, in order to address the influences from the above issues, a well-designed routing protocol often consists of two steps: (1) select an optimal route, con-sisting of a sequence of passed road intersections; (2) se-lect the next hop, usually through greedy forwarding. The reason behind will be given later in Section 2.
Although the existing routing protocols can ensure the inter-vehicle communication in most cases, these proto-cols are generally designed with the assumption that ve-hicles are uniformly or randomly distributed on the roads [2]. Under such an assumption, the vehicle density in hand is actually averaged over the discussed area,
* Correspondence:[email protected]
1State Key Laboratory of Integrated Service Networks, Xidian University,
Xi'an 710071, China
2Department of Electrical Engineering and Computer Science, University of
Tennessee, Knoxville, TN 37996, USA
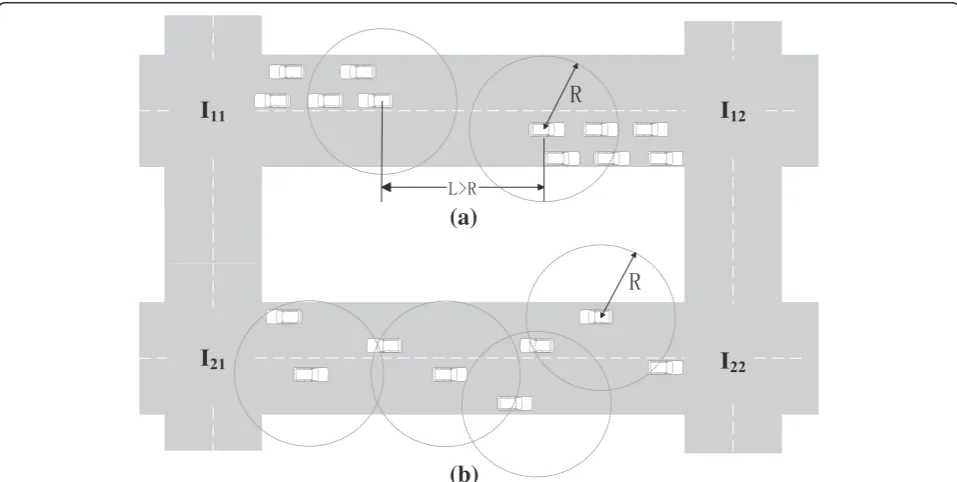
which is sometimes not consistent with the actual case. An urban VANET snapshot is depicted in Figure 1 as an example where average vehicle density in Figure 1a is higher than that in Figure 1b, whereas the road segment in Figure 1a has the temporal network disconnection problem. The reason is that vehicles are frequently inter-rupted due to the traffic signals and often slow down or stop in front of the intersections. In addition, traffic sta-tistics indicate that more than 70% of the vehicles travel-ling in a platoon form in urban areas [3], which may further increase the disconnection probability consider-ing the possible gap between clusters. Hence, routconsider-ing protocols that simply consider the average vehicle dens-ity or probabildens-ity of connectivdens-ity may choose the im-proper road segmentI11I12instead ofI21I22and result in
local optimums as shown in Figure 1.
In order to avoid the aforementioned problems, it is necessary to take both the path connectivity and experi-enced packet delay into consideration for routing strat-egy design in VANETs. Therefore, in this paper, we propose a connectivity-aware intersection-based routing (CAIR) protocol for urban VANETs.
The remainder of the paper is organized as follows: In Section 2, current typical routing protocols in VANETs are discussed. Section 3 describes our assumptions and protocol framework of the proposed CAIR. Numerical results are presented in Section 4 with elaborate expla-nations and performance comparisons. Our paper is concluded in Section 5 followed by the acknowledge-ments and cited references.
2 Related works
As we discussed in Section 1, the dynamic and high-mobility characters of VANETs make routing decision a big problem. Some other factors such as road layouts, traffic lights, and obstacles make this work more chal-lenging in urban areas. In view of the above issues, topology-based routing protocols may result in bad per-formance because of the nodal movement and link state change. In position-based routing protocols, routing de-cision is made based on the geographical coordinates of nodes. Therefore, it does not encounter these problems. Additionally, vehicles can easily get the geographical information with present well-developed navigation and localization technologies. So, in this paper, we used position-based routing protocols as our design funda-mental which are more suitable for VANETs. Next, we discuss some typical and popular position-based routing schemes in VANETs.
Greedy perimeter stateless routing (GPSR) [4] proposed a typical position-based routing. It uses greedy forward-ing to forward packets initially. When a packet reaches a local optimum, it switches to the perimeter mode. How-ever, greedy forwarding is unsuitable especially for high-speed scenarios and may not be able to maintain the next hop neighbors' information due to frequent disconnec-tions. Additionally, since no directional forwarding is considered, the perimeter model often results in longer routes thus extending the transmission delay.
Connectivity-aware routing (CAR) [5] addressed the above problem by selecting an optional route with the
(a)
(b)
least probability of network disconnection and avoiding carry-and-forward delay. The route probability of con-nectivity is calculated through the probabilistic model of network disconnection with the information of statistical traffic data. At the same time, CAR mentioned the im-pact of traffic light on connectivity, but it did not apply this result to the routing protocols' design. In addition, the inaccuracy of road density calculation might affect the path selection and overall network performance. ACAR [6] proposed an on-the-fly density collection scheme to improve the accuracy of CAR. Landmark overlays for urban vehicular routing environments (LOUVRE) [7] solved the network disconnection prob-lem by using an approach to efficiently build a landmark overlay network on top of the urban topology. The over-lay links are created if and only if the vehicle density is higher than a predefined threshold. LOUVRE performed higher in packet delivery ratio and achieved lower hop counts than GPSR. However, the predefined threshold is calculated under the assumption that vehicles are uni-formly distributed along the road. In the case where vehi-cles are not uniformly distributed in Figure 1, LOUVRE may also encounter the problem of disconnections.
The intersection-based geographical routing protocol (IGRP) [8] is also an intersection-based geographical routing protocol which has some similar mechanisms with our work. It chooses the path that maximizes con-nectivity probability while satisfying the QoS constraints regarding hop count, BER, and end-to-end delay. Be-tween any two intersections on the selected path, geo-graphical forwarding is used to transfer packets, thus reducing the path's sensitivity to individual node move-ment. However, to reach this goal, a central control unit, i.e., the gateway, is needed to collect the detailed infor-mation about the vehicles in its vicinity using a location-aware service and the genetic algorithm to choose the optimal routes. Therefore, IGRP could not be considered as a fully distributed routing protocol. Besides, the com-putation complexity and convergence speed of the gen-etic algorithm should also be taken into account which may fail some delay-sensitive services. Additionally, the connectivity of IGRP is calculated under the assumption that all vehicles on the road follow a Poisson distribution which seems unrealistic in urban VANETs especially when traffic lights, obstacles, and roundabouts are exist-ing [9]. Junction-based geographic routexist-ing (JBR) [10] is another latest published junction-based routing which makes use of selective greedy forwarding up to the node that is located at a junction and is closer to the destin-ation. Nodes are divided into two classes: coordinators located at a junction and simple nodes placed in the middle of a road. If there is any available coordinator, it will be checked in priority, and the closest one to the destination is chosen as the next hop instead of a
random selection. The key novelty of JBR is the mini-mum angle method for determining the appropriate next hop which is farther from the local optimum and closer to another coordinator. However, since broadcasting to multiple coordinators to generate multiple paths is pro-hibited to reduce the experienced delay, the probability of local optimum and packet drop increases. To alleviate this issue, a junction-based multipath source routing algorithm [11] was proposed. Its performance evalua-tions show that multipath is beneficial for VANETs, in case the source-destination distances are medium or long (six hops away or more) or traffic loads are medium to high, conditions that real-world VANETs will prob-ably face. Nevertheless, how to handle local optimum is not considered in this paper. The impact of traffic light on routing protocol design was investigated in [12] based on an intersection-based routing protocol designed for ve-hicular communications in urban areas. Although this shortest-path-based traffic light-aware routing (STAR) protocol shows better performance on delay, delivery ra-tio, and throughput than related routing protocols consid-ering traffic light, its assumptions of high density always connected green light segment, and an onboard video camera to identify the colors of traffic light may limit its applications in practical cases.
Compared to the existing routing protocols in urban area, the constructed routes based on fixed intersections are more stable than those only from greedy forwarding strategy. In our work, we propose CAIR which chooses the intersection-connected routes with the higher con-nectivity and lower transmission delay. By introducing a searching area limitation strategy, the routing overhead and experienced delay could be greatly reduced. Add-itionally, through an on-the-fly real-time traffic density collection scheme, the route could be determined more adaptively based on the real-time connectivity probabil-ity and delay estimation. Although we did not introduce traffic light impact into our analysis, the delay estimation algorithm actually implies this consideration. Numerical results show that our CAIR is very suitable for real-time applications and outperforms some other relevant proto-cols on average transmission delay and packet delivery ratio.
3 Assumption and protocol framework
information instead of static information can be used as the routing metric to improve the routing performance.
3.1 Assumptions
To make our work feasible, the following assumptions are made:
1. All nodes in our work are supposed to be equipped with transceivers, i.e., a 100% market penetration ratio is assumed.
2. All nodes are equipped with GPS and navigation systems so that each of them can obtain its location and speed. We also suppose vehicles are installed with a pre-loaded digital map, by which the detailed road topology could be obtained.
3. Each node maintains a neighboring list based on the latest information received from periodically beacon messages. Beacon messages are sent to each one-hop neighbor. If a node does not receive beacon messages from one neighbor during a certain time period, then the link is considered down.
4. The street map is abstracted as a graphG(V,E) consisting of road intersections (i.e., junctions)v∈ Vand road segmentse∈Ewhere all the segments are connected with intersections.
5. For simplicity, the channel fading or signal attenuation phenomenon is not taken into account during the procedure of routing protocol
description. The propagation performance
attenuation could be equivalently handled by setting a bigger transmitting power or using a more sensitive receiver.
3.2 CAIR description
CAIR is an intersection-based geographical routing protocol that is capable of finding the robust route to the destination in urban environments. Figures 2 and 3 show the pseudo-code of the routing process; the CAIR scheme is mainly separated into three steps: (i) dynamic selection of the intersections through which a packet could reach its destination, (ii) a prediction-based greedy forwarding strategy between two intersections, and (iii) a recovery strategy when routing failure occurs.
3.2.1 Intersection selection mechanism
In this subsection, a rectangle restricted area searching method [13] is used to efficiently find the optimal route in large-scale VANETs. Taking positions of source and destination nodes as the foci and the line connecting them as the axis, an ellipse could be formed. Corres-pondingly, the rectangle, i.e., the restricted searching area, can be plotted by bounding the ellipse. In this way, each intersection involved in the routed path could be determined whether it is in or out of the rectangle area.
Through searching area restriction, the routing overhead will be greatly reduced which is essential to the delay control and packet collision release. The rectangle re-striction algorithm is described as follows.
Assume thatS(xS,yS) andD(xD,yD) are the coordinates
of the source and destination node, respectively. LetSand
Dbe the foci of the ellipse which can be expressed as
cosφðx−aÞ þsinφðy−bÞ
τis the scale factor determined by the statistical infor-mation of the city road network and can actually infect the size of the searching area [13]. Usually, this scale
factor is a constant and ranges from 1 to 2. Since it is a crucial factor, we give an example here to illustrate its determination method. First, we can extract a certain number of nodes from the road network to construct two setsAandB. Then, the Cartesian product ofAand
Bcould be given as follows:C=A×B= {(a,b)(a∈A)∧ (b∈B)}. Each element of Ccan be regarded as the start
and end points of the shortest path between nodes a
and b. Suppose that the Euclidean distance and the length corresponding to the path with the least needed propagation duration are Eab and Pab, respectively. By
settingRab=Pab /Eab, we can get a coefficient ratio set R for the extracted samples. Finally, the scale factor τ could be obtained through statistical analysis to the ele-ments ofRwhich makes the totals ofRsatisfy a certain confidential level, say 95%, and not greater thanτ. Next, the scale factor could be used to determine the size of the searching area. Finally, the rectangle searching area can be bounded as illustrated in Figure 4.
Next, calculate the partial derivative of x and y based on Equation 1. Then, the extreme value of x andy can be written as
xmax¼aþ
ffiffiffiffiffiffiffiffiffiffiffiffiffiffiffiffiffiffiffiffiffiffiffiffiffiffiffiffiffiffiffiffiffiffiffiffiffiffiffi
A2cos2φþB2sin2φ q
; ð2Þ
xmin¼a−
ffiffiffiffiffiffiffiffiffiffiffiffiffiffiffiffiffiffiffiffiffiffiffiffiffiffiffiffiffiffiffiffiffiffiffiffiffiffiffi
A2cos2φþB2sin2φ q
; ð3Þ
ymax¼bþ
ffiffiffiffiffiffiffiffiffiffiffiffiffiffiffiffiffiffiffiffiffiffiffiffiffiffiffiffiffiffiffiffiffiffiffiffiffiffiffi
A2sin2φþB2cos2φ q
; ð4Þ
ymin¼
ffiffiffiffiffiffiffiffiffiffiffiffiffiffiffiffiffiffiffiffiffiffiffiffiffiffiffiffiffiffiffiffiffiffiffiffiffiffiffi
A2sin2φþB2cos2φ q
; ð5Þ
xmax, xmin, ymax, and ymin are the rectangle's four
vertexes.
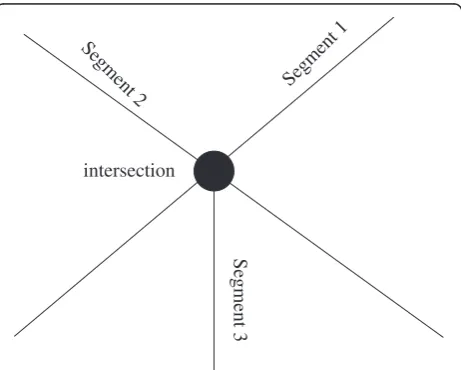
The street map is abstracted as a graph consisting of road intersections and road segments where all the in-tersections are connected with road segments. For a given road segment, it has at least two intersections, say the start and end intersections. However, to reflect the
Figure 3Pseudo-code of next hop selection mechanism.
practical situation, the case that an intersection connect-ing more than two road segments is also taken into ac-count as shown in Figure 5. The determination of a road segment within or beyond the rectangle area could be judged through connected intersections. To do so, we turn to the discrimination rule used in [14] which is described as follows: First, if any of the start or end intersection of a segment is within the searching area, this segment is considered as a part of the searching area. Otherwise, we need to calculate the center coord-inator and the diagonal length of the searching area. If the distance between the intermediate point of this road segment and the center coordinator is considerably lar-ger than half of the diagonal length, this segment is supposed to not belong to the searching area and vice versa.
When a source node has packets to send to a destin-ation and there are not available paths, the source node will broadcast a route request (RREQ) packet within the searching area to initialize the route discovery process. Each node that received the RREQ will rebroadcast it, unless it is the destination or it has a route to the destin-ation in its route cache. The RREQ packet contains the information of road traffic density, number of lanes, road length, packet delay, and intersections which data packets have to pass. When the destination node re-ceived the first RREQ, it sets up a timer and stores this route in its cache. When the timer expired, the destin-ation node stops receiving the RREQ and calculates all the route probability of connectivity and the correspond-ing packet delay on them by timestamps. Then, it sends a route reply (RREP) packet back to the source node via the selected route. Upon the arrival of the RREP packet at the source node, the source node begins to send data along the route.
As stated above, the calculation of the probability of connectivity for a given road segment is based on the method proposed in CAR which can be formulated as
P¼1− X number of empty cells, road traffic density, road length, and the number of lanes, respectively. n0=l/ d, where
dis the average length of all vehicles.
c i½ tþ1¼ X minfk;t⋅n0g
j¼max 0f ;i−n0g
c i½ tandc i½ 1¼1ði¼0;1;…;n0Þ:
Since a route consists of a sequence of road segments, the route probability of connectivity is the product of it for all segments along the route. For example, the prob-ability of connectivity for a route with road segmentsA,
B, andCisPA×PB×PC.
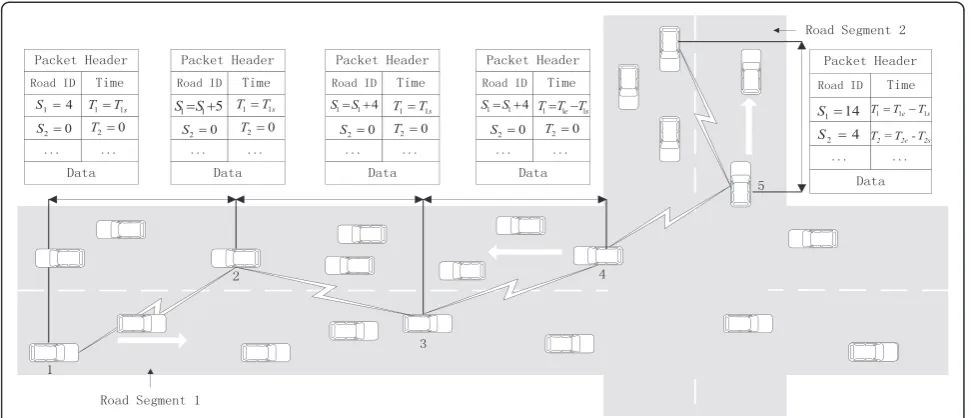
The traffic density could be estimated while broadcast-ing the RREQ usbroadcast-ing the on-the-fly density collection mechanism proposed in [6]. As shown in Figure 6, node 1 is the current packet forwarder and enters a new road segment 1. Since the local time of each node is synchro-nized with GPS, node 1 can readily get the current time
T1s through the received timestamp when it enters into
road segment 1. Then, it adds the starting time T1s to
the data packets. When node 1 leaves road segment 1 and enters into another road segment, it records the ending time T1e and injects it into the data packets.
Thus, the packet delay of road segment 1 could be cal-culated according to (7) as follows:
D1¼T1e−T1s; ð7Þ
In the same way, when packets reach to the destin-ation, packet delay of every road segment on the route is collected, and the route packet delay is the sum of all road segments in the route. Compared to the variation of traffic density [6] and packet delay, the needed time for RREQ and RREP is much smaller [15], so it has little impact on the actual packet for-warding delay. This way, the traffic density and packet forwarding delay can accurately describe the real-time traffic conditions.
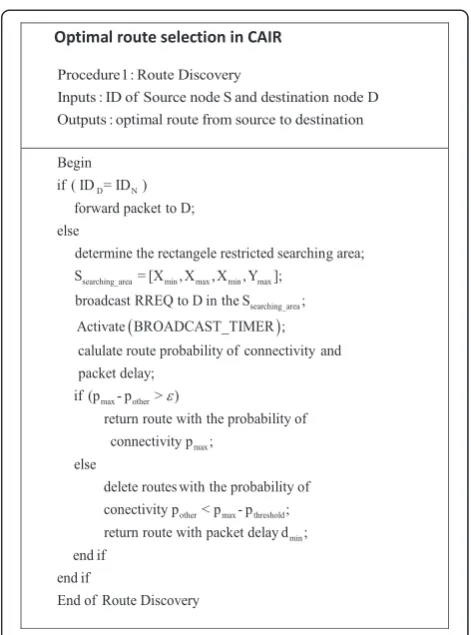
Next, the pseudo-codes of the algorithm for calculat-ing the restricted RREQ area, route probability of connectivity and route packet delay in our work are de-scribed in Figures 2 and 3. The related parameters are listed in Table 1.
In the scenario where a source node has a packet to send and there are no available routes, it first checks whether there is a destination node in its neighboring list or not. If yes, it forwards the packet to the destination node directly; otherwise, it calculates the rectangle re-stricted searching area according to [13], i.e.,Ssearching_area
which is determined by Equations 2 to 5. Then, the source node broadcasts a RREQ packet within Ssearching_area to
find an available route to the destination.
The process flow of the intersection selection mechan-ism is described in the pseudo-code as shown in Figure 2. When the destination received the first RREQ, it will
activate a timer, i.e., BROADCAST_TIMER. After the timer expired, the destination node will calculate all the route probability of connectivity and the route packet delay through the received RREQ packets. Then, the route with maximum probability of connectivity will be denoted as pmax. If the value of pmax − pother is bigger
than the preset threshold ε, we will choose the route with the highest probability of connectivity pmax as the
best route to the destination. Otherwise, the destination node will consider the experienced delay of the received packets into routing selection. The destination node will choose the route with the minimum delay dmin whose
probability of connectivity is withinpmax−ε<pother<pmax
as the best route. Each route in the cache has limited lifetime. When the packet dropped during the sending progress, the corresponding stored optimal route will be deleted, and the source node will initiate another RREQ subsequently.
3.2.2 Next hop selection mechanism
Due to the frequent topology change and different mo-bility patterns in VANETs, traditional greedy forward al-gorithms may lead to inaccurate neighboring list and miss some suitable relay nodes. Thus, a position-based prediction algorithm is necessary especially in urban area where turning or merging is common.
In our work, a node can know the location of itself and its neighbors by periodically exchanging beacon messages and the support from GPS. With the beacon messages broadcasted by all vehicles, every vehicle can establish its own neighboring list and know whether it is the intersection node or not. When a node knows it is located at an intersection, it will broadcast a beacon
Figure 6Traffic density and packet delay estimation mechanism.
Table 1 List of parameters
Parameter Description
IDD ID of destination node
IDN ID of source node's neighbors
Ssearching area The restricted flooding area of RREQ
pmax The maximum route probability of connectivity
pother All the other route probability of connectivity
ε The preset threshold
dmin The minimum packet delay
Nintersection_node Node located at the intersections
Nneighboring_node Current forwarder's neighbors
Dforwarding_road_segment Next forwarding road segment of the packets
message to inform its neighboring nodes. Thus, accord-ing to the velocity and location information obtained from the beacon message, the relay node first predicts the future position of each neighbor when forwarding data packets and then selects neighbor node nearest to the next intersection as the best next hop according to the forecasted position. The mechanism for position pre-diction is as follows [16]:
xc;yc
ð Þ ¼ðxi;yiÞ þðs⋅cosθ;s⋅sinθÞ; ð8Þ
where (xc,yc) is the neighbors' current position; (xi,yi) is the previous position;s= (tc−Tb)⋅speed, wheretc is the current time and Tb is the previous beacon time; and speed and θ are the moving velocity and direction, re-spectively. Through position prediction, forwarding nodes can select the neighbor on the selected route as the next hop whose new predicted position is closest to the destination or the next intersection.
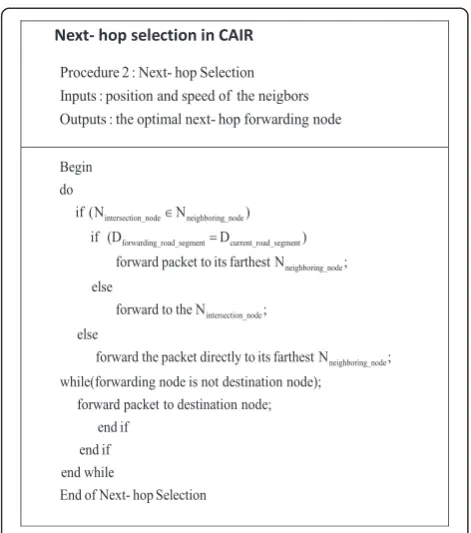
The pseudo-code of the next hop selection mechanism is presented in Figure 3. If there exist Nintersection_node in
the neighboring list of the forwarding node, forwarding node needs to judge the direction ofDforwarding_road_segment
and Dcurrent_road_segment according to the selected best
route. If they have the same direction, forwarding node then sends the packet directly to its neighboring node in a greedy manner, namely the node farthest to itself within the radio range. Otherwise, the packet will be randomly sent to the intersection neighbors. The packet forwarding process will not end until it reaches the destination.
3.2.3 Routing recovery
In VANETs, the mobility of vehicular nodes is con-strained by the street layout, and they have to deal with problems like radio obstacles due to high-rise buildings, which greatly limit the connectivity between nodes. Thus, a packet may not be forwarded if the sender does not have a connection to its neighbor that is geograph-ically closer to the destination than itself; the problem is also known as a local optimum or local maximum issue. Although the selected route is with the best link quality, local optimum also occurs frequently [14]. As a result, the performance of geographical routing proto-cols in VANETs will be greatly degraded. Hence, a re-covery strategy is necessary. The rere-covery strategy of CAIR is based on the idea of store-carry-forward. Un-like the original store-carry-forward algorithm, the current node will carry the data packets along the current selected road segment and forward packets when it moves into another node's communication range. The process will not stop until the packets reach the destination.
4 Numerical results
This section consists of two parts. The first part intro-duces the simulation scenario, related parameters, and the performance evaluation indexes. The second part gives the simulation results and evaluations.
4.1 Simulation scenario
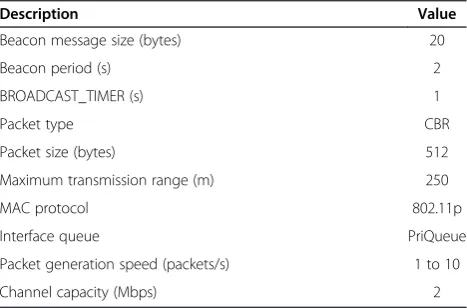
Our proposed CAIR protocol is implemented on a ve-hicular communication testbed combining Matlab and NS2 on Linux platform. This testbed, which was named V-MAN (vehicular environment simulation with Matlab and NS2), has successfully finished three simulation works [17,18] in VANETs for our team. The perform-ance of our CAIR routing is compared with the GPSR, CAR, JBR, and STAR protocols. The street layouts used for simulation are loaded from TIGER database [19]. De-tails of the general simulation parameters for NS2 are listed in Table 2. The experiment is restricted in a 2,000 × 1,500 m rectangle street area. The movement profile was generated by VanetMobiSim [20] and using IDM_LC (in-telligent driver model with lane changing) mobility model with the parameters listed in Table 3. The performance of our routing protocol is evaluated on IEEE 802.11p MAC with parameters listed in Table 4. Figures 7 and 8 are snapshots of the simulation topology captured by a satel-lite camera and generated by VanetMobiSim for the se-lected area of Washington, D.C. and Los Angeles. The complexity of the map is indicated by a tuple (a, b, c), where a, b, c are the number of junctions, number of streets, and average length of streets in meters, respect-ively. Here, the complexity of the selected area of Wash-ington, D.C. and Los Angeles are (42, 80, 195) and (81, 159, 145), respectively. The usage of different maps is to reflect the scalability of our model and alleviate the speci-ficity of results from an individual map. The labels with numbers indicate different vehicles, and they are a little bit overlapped due to limited screen space especially when they are stopped by traffic lights. The lines represent avenues or streets. Since traffic lights are enabled in
Table 2 Network performance evaluation parameters
Description Value
Beacon message size (bytes) 20
Beacon period (s) 2
BROADCAST_TIMER (s) 1
Packet type CBR
Packet size (bytes) 512
Maximum transmission range (m) 250
MAC protocol 802.11p
Interface queue PriQueue
Packet generation speed (packets/s) 1 to 10
simulation, the colored line means there is a traffic light on the junction. The red color line indicates the traffics on this line are stopped by a red light and vice versa. Note that the configuration of the position and number of traffic lights are not the real case, but it can be adjusted during simulations to reflect the practical situation. In our cases, we set the number of traffic lights to 10 for Washington, D.C. and 20 for Los Angeles, and their posi-tions are randomly selected among all the intersecposi-tions.
In addition, although TIGER can describe land attri-butes such as roads, buildings, rivers, and lakes, it is still difficult to draw obstacles on output traces by Vanet-MobiSim until now. However, to reflect the influences from obstacles, we extracted the coordinates of obstacles from the investigated parts of real maps and input them into NS2. Besides, since there is no height information in TIGER database, a modification to NS2 is needed to reflect the impact of obstacles on channel fading and power attenuation. To support obstacle modeling, a two-dimensional obstacle object ‘ObstacleClass’is intro-duced which represents a wall of 1 m deep and has the length indicated by the distance between two coordi-nates extracted from the real maps, i.e.,P1(x1,y1) andP2
(x2, y2). By this way, a building could be expressed by
four connected walls. When the line of sight (LOS) of a communication pair intersects with the outline of the
building, the power attenuation could be calculated by the following equation, combining the generic free space path loss model with the obstacle model presented in [1], i.e., mit power, sender antenna gain, receiver antenna gain, wavelength, and the distance between the sender and re-ceiver, respectively. n is the number of times that the border of the obstacle is intersected by the line of sight. dmhere is the total length of the obstacle's intersection.
βand γare two constants.βis given in decibels per wall and represents the attenuation a transmission experi-ences due to the (e.g., brick) exterior wall of a building.
γ is given in decibels per meter and serves as a rough approximation of the internal structure of a building. The general values of β and γ in most cases are 9 and 0.4 dB/m, respectively. Finally, each scenario is repeated 50 times to achieve the arithmetic mean.
The protocol performance is evaluated by packet de-livery ratio, routing protocol overhead, and average transmission delay. The elaborate descriptions of these indexes are as follows:
Packet delivery ratio (PDR) is defined as the number of correctly received packets at the destination vehicle over the number of packets sent by the source vehicle.
Routing overheads (RO) is defined as the ratio between the total number of bytes of control packets and the cumulative size of data packets delivered to the destinations and control packets. Average transmission delay (ATD) is the average
difference between the time a data packet is
originated by an application and the time this packet is received at its destination.
The performance of the five protocols is evaluated by varying the packet generation speed (PGS) and vehicle density (VD). The listed number of vehicles in Table 3, i.e., 200, is just applied to the specific scenarios for packet generation speed changing, i.e., Figures 9, 10, 11, 12. The positions of the 200 vehicles are determined by the mobility model IDM_LC. However, for other scenar-ios, the traffic density is uniformly generated per seg-ment according to the coordinates of the x-axis in Figures 13, 14, 15, 16. In other words, since the unit of the density is vehicles/km, a longer segment will com-prise more vehicles and vice versa. Correspondingly, the packet generation speed remains at 5 packets/s when the vehicle density changes.
Table 3 Scenario generation parameters for IDM_LC
Description Value
Simulation area (m × m) 2,000 × 1,500
Traffic light interval (s) 15
Min speed (m/s) 6.66
Recalculating movement step (s) 1
General setting for the number of vehicles 200
Number of lanes 2
Max speed (m/s) 24.44
Min stay (s) to max stay (s) 5 to 30
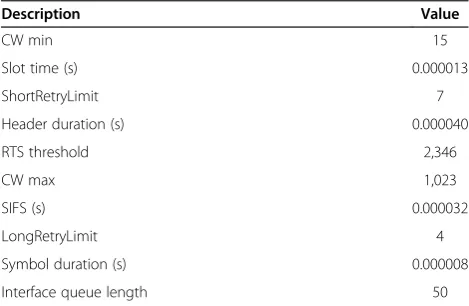
Table 4 Parameter setting for IEEE 802.11p MAC
4.2 Simulation results and analysis
The ATD performance for various PGS in the case of GPSR, CAR, our proposed CAIR, STAR, and JBR proto-cols are plotted in Figure 9 where the main area of Washington, D.C. is selected as the topology map. It can be deduced from this figure that ATD decreases as the PGS drops. This result is reasonable and demonstrates that high data rate may easily saturate the IEEE 802.11p service channel since no differentiated service, i.e., EDCA configuration, is considered in our cases. Among all the schemes, CAIR shows the best ATD owing to its routing selection consideration which combines path connectivity and experienced delay estimation together. In addition, the junction-based forwarding skill could really reduce the impact of obstacles blocking on signal attenuation which may result in packet drop thus expanding the average transmission delay. It could also
be noticed that our scheme is more effective compared with others especially when data rate is high because more goodput could be obtained within a given trans-mission period which in turn will reduce the channel load and packet collision probability thus leading to a shorter average transmission delay. JBR also shows a sat-isfied ATD due to its coordinator-based selective greedy forwarding and min angle-based recovery strategies. By exploring the NS2 trace file, it can be found that JBR will forward the sent packets directly to the coordinator in range which is placed at the junction and closer to the destination, instead of stopping at each intersection. In addition, the min angle-based recovery strategy could further shorten the needed duration for local optimum elimination and reduce the ATD through a directional forwarding toward the destination. Although the intro-duced mechanisms in JBR seem even better than our
(a) Satellite screenshot
(b) Generated topology by Vanetmobisim
CAIR, its long-distance selective greedy forwarding may suffer the performance degradation due to building blocking. Besides, the traffic lights will stop moving vehi-cles and make them form platoons which will impair the connectivity along two adjacent road segments. CAR shows a very comparable ATD with JBR and performs even better when PGS is high. This result demonstrates that the connectivity-based routing selection in CAR could benefit more sent packets and make a lower average transmission delay given a higher PGS. However, as PGS decreases, the superiority of the reliable connected path may be weaken by the effect of building blocking and traffic light stopping. GPSR exhibits a worse performance under
(a) Satellite screenshot
(b) Generated topology by Vanetmobisim
Figure 8Snapshot of selected area of Los Angeles. (a)Satellite screenshot.(b)Generated topology by VanetMobiSim.
this vehicle density, i.e., 200
2:01:5¼66:7 vehicles=km 2, and
the protocol adaptability to different topologies, we also evaluated the ATD performance in Los Angeles in Figure 10. It is worth stressing that the performance rank among all five protocols under this map configuration is much different from Figure 9. Actually, all the five proto-cols have shown an increased ATD in contrast with the performance under the lower complexity map of Washington, D.C. As listed before, the complexity indi-cated by the tuple (a, b, c) of the selected area of Los Angeles is almost twice of that of Washington, D.C. As for the average length of streets, it is reasonable that the more the number of junctions and streets, the shorter the average length of streets will be. It should also be noted that STAR now shows a significant ATD drop compared with CAR and JBR as shown in Figure 10. Indeed, this superior performance improvement is owing to the
introduction of more traffic lights and number of junctions which may bring more chances to the right-turn assisted forwarding mechanism. In addition, the intersection-based forwarding scheme can alleviate the signal attenuation from building blocking to some extent.
The impact of different PGS on PDR is depicted in Figure 11. Since both our proposed CAIR and CAR make connectivity the first consideration, their PDR are satisfying overall. In addition, due to the introduction of delay estimation to the routing selection in CAIR, the probability of disconnections between platoons even with traffic lights enabled is reduced. Therefore, our CAIR shows a bit improvement over CAR. STAR in this case shows a preferable PDR attributed to its intersection-based store-carry-forward mechanism at a price of trans-mission delay extension as shown in Figure 9. Actually,
Figure 9Impact of packet generation speed on average transmission delay for Washington, D.C.
Figure 10Impact of packet generation speed on average transmission delay for Los Angeles.
Figure 11Impact of packet generation speed on packet delivery ratio for Washington, D.C.
under this map configuration, STAR performs even better than CAR because CAR has no consideration of building blocking on wireless signal thus leading some sent packets dropped. Although JBR implemented recovery mechanism through selective greedy forwarding by coordinators, its PDR is unsatisfied in this case. In fact, when there are not any qualified neighbors to be selected as the next hop, the packet using JBR will be directly dropped without store or carry for future relay. In addition, the influence of traffic light on the path connectivity makes the selective greedy forwarding skill fail and degrade to the general greedy al-gorithm. The PDR of GPSR in this scenario is very poor and not over 0.05 with PGS changing. This result demon-strates that a vehicle density of 66.7 vehicles/km2 is not sufficient for GPSR to work well without frequent occur-rence of local optimums. Besides, the introduction of
buildings based on real map data brings too many obsta-cles to make GPSR forward successful.
Different from other protocols, the detailed implemen-tation description including frame structure, beacon fre-quency, and size was not given in STAR. Therefore, we use ‘God’class in NS2 to make the overall system vari-ables and connectivity state known to each node in STAR. Accordingly, we just compared the RO perform-ance of GPSR, CAR, CAIR, and JBR with PGS varying in Figure 12. The beacon interval of all the protocols is set to the same for comparisons as listed in Table 2. It can be noted that CAR has the lowest RO among all the pro-tocols. In fact, CAR uses an adaptive beaconing mechan-ism, and the beaconing interval depends on the node's neighborhood. Thus, in low traffic density scenarios, the node beacons more frequently than in high traffic
Figure 13Impact of vehicular density on average transmission delay for Washington, D.C.
Figure 14Impact of vehicular density on average transmission delay for Los Angeles.
Figure 15Impact of vehicular density on packet delivery ratio for Washington, D.C.
density ones. In other words, the routing overhead from beacon messages of CAR depends on the vehicular dens-ity only and is independent of traffic load. The other two parts contributing to the overhead in CAR, i.e., path dis-covery and guard maintenance, seem to show limited in-fluence to the RO as shown in Figure 12. Actually, since only one path discovery is needed for per source/destin-ation pair and guard overhead is piggybacked in beacon, the increase of PGS really has a little impact on the RO of CAR except some that occurred overhead for local optimum maintenance. Among the other three proto-cols, GPSR shows relatively lower RO, whereas JBR shows the highest. Our CAIR issues an RO in between GPSR and JBR. The reason behind this rank is the use of other management overhead other than the beacon mes-sage in CAIR, which is the only overhead in GPSR. For JBR, although the beacon size is nearly the same with others, its destination initiated flooding for position no-tification consumes a great many of bandwidth. Our CAIR uses the mechanism of on-the-fly density collec-tion and delay estimacollec-tion, both of which are piggybacked in data packets and add some limited overhead.
The impact of VD on ATD, PDR, and RO of different protocols are plotted in Figures 13, 14, 15, 16. As stated before, the PGS remains at 5 packets/s, and the number of vehicles per square kilometer is indicated by the coor-dinates of the x-axis. To make the comparisons clear among different protocols in different cities, the ATD performance of the selected area in Washington, D.C. and Los Angeles is plotted separately in Figures 13 and 14, respectively. It is worth noted in Figure 13 that ex-cept GPSR, which shows a fluctuant curve, all the other four protocols' ATD generally decreases with the in-crease of VD. As for GPSR, since the growth of VD will reduce the probability of local optimums, GPSR shows a dropping ATD before VD is greater than 70. However, along with the continuous increase of VD, GPSR's ATD correspondingly rises. Actually, by exploring the NS2 trace file, there are lots of ‘DROP_MAC_COLLISION,’ ‘DROP_MAC_BUSY’, and‘DROP_MAC_RETRY_COUNT_ EXCEEDED’ occurring, i.e., the packets dropped due to collisions, channel busy, and exceeding the retry limit, re-spectively. Therefore, we could say that the packets retry and backoff contributing to the delay growth of GPSR when VD is higher. STAR seems to work well at first and exhibit a performance a little bit worse than our CAIR. In fact, since other protocols did not take traffic lights into account in their design, we have not compared STAR's performance with different configurations of the number and duration of traffic lights in this simulation, which may seem unfair in such cases. Even so, STAR's ATD looks sat-isfied before VD approaching 50 vehicles/km2in Figure 13 because the increase of VD will correspondingly increase the connectivity probability of red light segments with the
help of more turning right vehicles. However, along with the continuous increase of VD, STAR's ATD begins to de-crease slowly and shows a larger value than JBR, CAR, and CAIR. In fact, as the VD further increases, CAR has more chances to forward the sent packets through a ro-bust connected path thus reducing the probability of local optimums. As for JBR, the number of failures for selective greedy forwarding will be decreased thus showing a quicker drop even than STAR. CAR in this scenario also exhibits a better performance. This result is a consequence of CAR's use of real connected paths between source and destination pairs. In addition, CAR could easily tolerate short-term disconnections due to gaps or a temporary high interference level (e.g., frequent MAC collisions). Our proposed CAIR always shows the best ATD among all the compared protocols. The reason behind is CAIR's routing selection with delay estimation which could read-ily eliminate the gap between different connected pla-toons. Additionally, the junction-based forwarding in CAIR could alleviate the impact of obstacles blocking on sent packets which in turn reduces the messages' drop ra-tio and results in a lower ATD. JBR's ATD exhibits a larger value at first but experiences a fast drop even lower than CAR finally. Indeed, the increase of VD will reduce the oc-currence of the case that there are not qualified neighbors to be selected as the next hop in JBR. Additionally, the coordinator-based selective greedy forwarding will have more chances to make the sent packets skipping some junctions to reach the destination quickly. As shown in Figure 14, the ATD performance of Los Angeles shows big differences with that of the Washington, D.C. In view of the increased number of traffic lights in Los Angeles, i.e., 20, STAR works more efficient due to more chances for forwarding packets by the right-turn vehicles to in-crease the connectivity. Besides, the growth in complexity of the map of Los Angeles also benefits STAR since more junctions also generate more opportunities for right-turn forwarding. Although JBR's ATD is always larger than STAR and CAIR as shown in Figure 14, it is lower than CAR this time when VD is greater than 52. Actually, since the average length of streets in the selected area of Los Angeles is shorter than that of Washington, D.C., even with obstacle blocking, JBR now has more opportunities to successfully execute the coordinator-based selective greedy forwarding and skip some junctions under the 250-m maximum transmission range setting.
between source and destination pairs in CAR and CAIR, they can easily tolerate MAC collisions thus still output-ting better PDR when VD is higher. Nevertheless, since CAR executes a distance-based connectivity determin-ation, the impact of obstacles on the packet reception ratio is not considered thus exhibiting some PDR drop-ping finally. As for CAIR and STAR, because they both forward the sent packets at junctions, the case of signal attenuation caused by obstacles seldom happens there-upon they show overall better PDR performance than CAR as shown in Figure 15. For STAR, its performance really depends on the current vehicle density thus show-ing a continuous risshow-ing at first with VD increasshow-ing. On the other hand, although more vehicles are available as the right-turn forwarding candidates, the frequently oc-curring collisions and retransmissions along with the in-crease of VD lead to a PDR drop for STAR. Additionally, the ten traffic lights' setting, which is configured for a fair comparison between different protocols, indeed limits STAR to perform better. For JBR and GPSR, both protocols maintain a lower PDR during the overall simu-lation. Actually, considering the average length of streets for the selected area in Washington, D.C., JBR per-formed worse than in Los Angeles by its selective greedy forwarding with obstacles enabled. Besides, the collisions on MAC increases with growth of VD and make more sent packets dropped due to not enough signal-to-interference-and-noise ratio (SINR) at receivers.
The RO comparisons among GPSR, CAR, CAIR, and JBR are depicted in Figure 16. It is worth noted that CAR shows a decreasing RO with VD increasing, whereas the other three protocols' RO grows with the rise of VD, which will bring more collisions on MAC. Due to the use of an adaptive beaconing mechanism, where low traffic density scenarios generate beacons more frequently than in high traffic density ones, the RO under higher VD is even smaller than that under lower VD in CAR. Among the other three protocols, JBR uses the most control overhead in view of its destin-ation flooding mechanism to provide query results for packet source. Our CAIR's RO is in between GPSR and JBR which is consistent with the result of Figure 12. Ac-tually, since more control overheads are needed to com-pute the connectivity and estimate the experienced delay when more routing paths are available, CAIR eventually shows a rising RO even though its connectivity-based route selection could tolerate some interference from physical layer thus correspondingly reducing the number of collisions and retransmissions. As for GPSR, which employs fixed beacon interval and sends beacons pro-actively (modulo data traffic with piggybacked position information), its RO also experienced a rise with the growth of VD. The reason behind is that more collisions and retransmissions on MAC cause routing layer to use
more beacons to remain up-to-date about the position information of neighborhoods.
5 Conclusion
The CAIR protocol, designed to optimally route the data packets in urban environments, efficiently utilizes the characteristics of road traffic, urban topology, localization, and geographic information acquisitive technologies to in-telligently serve for the applications in VANETs. The main contributions of our work can be concluded as follows:
1. Take both connectivity and path delay into consideration to eliminate the problem of disconnections between platoons even with large vehicular density on a specific road segment 2. Using directional forwarding to reduce average
transmission delay when there are several relays available
3. Introduce on-demand position forecasting for the next hop relay selection into our improved greed forward-ing mechanism to reduce the prediction error which may result in local optimum or delay expanding 4. Executing junction-based forwarding strategy to
alleviate the impact of obstacles on signal attenuation
Simulation results show that CAIR performs better in terms of average transmission delay and packet delivery ratio at the cost of a bit more routing overhead. The ro-bust intersection selection and the improved greedy for-warding scheme with store-carry-forward recovery strategy suggest that CAIR should be able to provide stable communication while maintaining higher delivery ratio and lower delays for vehicular routing in urban environments.
Competing interests
The authors declare that they have no competing interests.
Acknowledgements
This work was supported by the National Natural Science Foundation of China (61201133, 61172055, 61072067), Xian Municipal Technology Transfer Promotion Project (CX12178(6)), the Fundamental Research Funds for the Central Universities (K5051301011), the Postdoctoral Science Foundation of China (20100481323), the Program for New Century Excellent Talents (NCET-11-0691), the‘111 Project’of China (B08038), and the Foundation of Guangxi Key Lab of Wireless Wideband Communication & Signal Processing (11105).
Received: 30 August 2013 Accepted: 28 February 2014 Published: 20 March 2014
References
1. C Sommer, D Eckhoff, R German, F Dressler, A computationally inexpensive empirical model of IEEE 802.11p radio shadowing in urban environments, in
2011 Eighth International Conference on Wireless On-Demand Network Systems and Services (WONS)(IEEE, Piscataway, 2011), pp. 84–90
3. Y Jiang, S Li, DE Shamo, Development of vehicle platoon distribution models and simulation of platoon movements on Indian rural corridors. Joint. Transport. Res. Program72(2003). doi:10.5703/1288284313195 4. B Karp, HT Kung, GPSR: Greedy perimeter stateless routing for wireless
networks, inProceedings of the 6th Annual International Conference on Mobile Computing and Networking(ACM, New York, 2000), pp. 243–254 5. V Naumov, TR Gross, Connectivity-aware routing (CAR) in vehicular ad-hoc
networks, in26th IEEE International Conference on Computer Communications, INFOCOM 2007, Anchorage(IEEE, Piscataway, 2007), pp. 1919–1927 6. Q Yang, A Lim, S Li, J Fang, P Agrawal, ACAR: adaptive connectivity aware
routing for vehicular ad hoc networks in city scenarios. Mobile Netw Appl
15, 36–60 (2010). doi:10.1007/s11036-009-0169-2
7. KC Lee, M Le, J Harri, M Gerla, Louvre: landmark overlays for urban vehicular routing environments, inIEEE 68th Vehicular Technology Conference, 2008. VTC 2008-Fall(IEEE, Piscataway, 2008), pp. 1–5
8. H Saleet, R Langar, K Naik, R Boutaba, A Nayak, N Goel, Intersection-based geographical routing protocol for VANETs: a proposal and analysis. J Vehicular Technol IEEE Trans60(9), 4560–4574 (2011)
9. E Cinlar,Introduction to Stochastic Processes(Courier Dover Publications, Mineola, 2013)
10. S Tsiachris, G Koltsidas, FN Pavlidou, Junction-based geographic routing algorithm for vehicular ad hoc networks. Wirel. Pers. Commun.71, 955–973 (2012). doi:10.1007/s11277-012-0854-5
11. P Sermpezis, G Koltsidas, F-N Pavlidou, Investigating a junction-based multipath source routing algorithm for VANETs. Wireless Commun. IEEE
17, 600–603 (2013)
12. J-J Chang, L Y–H, W Liao, C I–C, Intersection-based routing for urban vehicular communications with traffic-light considerations. J Wireless Commun IEEE19, 82–88 (2012)
13. Z Han, C Wu, B Ma, J Li, K Xu, Restricted searching area route guidance based on neural network and EA, in2007 IEEE International Conference on Automation and Logistics, Jinan(IEEE, Piscataway, 2007), pp. 2477–2480 14. T-T Luong, B-C Seet, B-S Lee, Local maximum avoidance with correlated
street blocking for map-based geographic routing in VANETs, in2nd International Symposium on Wireless Pervasive Computing, 2007. ISWPC'07
(IEEE, Piscataway, 2007)
15. DA Maltz, J Broch, J Jetcheva, DB Johnson, The effects of on-demand behavior in routing protocols for multihop wireless ad hoc networks. Selected Areas in Commun. IEEE J17, 1439–1453 (1999)
16. Y-B Wang, T-Y Wu, W-T Lee, K C-H,A novel geographic routing strategy over VANET, in 2010 IEEE 24th International Conference on Advanced Information Networking and Applications Workshops (WAINA)(Piscataway, IEEE, 2010), pp. 873–879
17. C Chen, L Liu, X Du, X Wei, C Pei, Available connectivity analysis under free flow state in VANETs. EURASIP. J. Wireless Commun. Netw. 1–19 (2012). doi:10.1186/1687-1499-2012-270
18. C Chen, L Liu, X Du, Q Pei, X Zhao, Improving driving safety based on safe distance design in vehicular sensor networks. Int. J. Distributed Sensor Netw.2012, 1–13 (2012)
19. J Sperling,Development and maintenance of the TIGER database: experiences in spatial data sharing at the US Bureau of the Census, in Proceedings of the Sharing Geographic Information(Center for Urban Policy Research, New Brunswick, 1995), pp. 377–396
20. J Härri, F Filali, C Bonnet, M Fiore,VanetMobiSim: generating realistic mobility patterns for VANETs, in Proceedings of the 3rd International Workshop on Vehicular Ad Hoc Networks(ACM, New York, 2006), pp. 96–97
doi:10.1186/1687-1499-2014-42
Cite this article as:Chenet al.:A connectivity-aware intersection-based routing in VANETs.EURASIP Journal on Wireless Communications and Networking20142014:42.
Submit your manuscript to a
journal and benefi t from:
7Convenient online submission 7Rigorous peer review
7Immediate publication on acceptance 7Open access: articles freely available online 7High visibility within the fi eld
7Retaining the copyright to your article