Rapid quantification of neutral lipids and triglycerides
during zebrafish embryogenesis
PRUSOTHMAN YOGANANTHARJAH
1AVINESH R. BYREDDY
2, DANIEL FRAHER
1, MUNISH PURI
2and YANN GIBERT*
,11Metabolic Genetic Diseases Laboratory, Metabolic Research Unit, Deakin School of Medicine, and 2Bioprocessing Laboratory, Centre for Chemistry and Biotechnology, School of Life and Environmental Sciences,
Deakin University, Victoria, Australia
ABSTRACT The zebrafish is a useful vertebrate model to study lipid metabolism. Oil Red-O (ORO) staining of zebrafish embryos, though sufficient for visualizing the localization of triglycerides, was previously inadequate to quantify neutral lipid abundance. For metabolic studies, it is crucial to be able to quantify lipids during embryogenesis. Currently no cost effective, rapid and reliable method exists to quantify the deposition of neutral lipids and triglycerides. Thin layer chromatography (TLC), gas chromatography and mass spectrometry can be used to accurately measure lipid levels, but are time consuming and costly in their use. Hence, we developed a rapid and reliable method to quantify neutral lipids and triglycerides. Zebrafish embryos were exposed to Rimonabant (Rimo) or WIN 55,212-2 mesylate (WIN), compounds previously shown to modify lipid content during zebraf-ish embryogenesis. Following this, ORO stain was extracted out of both the zebrafzebraf-ish body and yolk sac and optical density was measured to give an indication of neutral lipid and triglyceride accumulation. Embryos treated with 0.3 µM WIN resulted in increased lipid accumulation, whereas 3 µM Rimo caused a decrease in lipid accumulation during embryogenesis. TLC was performed on zebrafish bodies to validate the developed method. In addition, BODIPY free fatty acids were injected into zebrafish embryos to confirm quantification of changes in lipid content in the embryo. Previously, ORO was limited to qualitative assessment; now ORO can be used as a quantitative tool to directly determine changes in the levels of neutral lipids and triglycerides.
KEY WORDS:
Oil-Red O, embryonic development, lipidogenesis, neutral lipid, triglyceride
Introduction
Attempts to rapidly and reliably quantify lipids during embryo-genesis are limited due to the lack of techniques available. The zebrafish is becoming a popular model to study lipid metabolism (Seth et al., 2013). One of its biggest advantages is the ability to inhibit pigmentation (melanogenesis) in embryos (Karlsson et al., 2001), which allows for the visualization of lipids. Numerous lipid staining methods exist to visualize the accumulation and deposi-tion of lipids in zebrafish embryo and larvae such as: Sudan Black, Nile Red and Oil Red-O (ORO) staining (d’Alencon et al., 2010; Mathias et al., 2009; Nishio et al., 2012; Tingaud-Sequeira et al., 2011). Sudan Black is utilized to stain for lipids that are present within neutrophils, whilst Nile Red stains for neutral lipids and tri-glycerides (d’Alencon et al., 2010; Mathias et al., 2009). Despite Nile Red being able to stain for neutral lipids and triglycerides, it cannot be used to stain for and visualize lipids that are deposited
www.intjdevbiol.com
*Address correspondence to: Yann Gibert: Metabolic Genetic Diseases Laboratory, Deakin School of Medicine, 75 Pigdons Road, Waurn Ponds VIC 3217, Australia. Tel: +61-3-5227-1197. Fax: +61-3-5527-2170. E-mail: [email protected] - http://orcid.org/0000-0001-8208-7223
Submitted: 24 June, 2016; Accepted: 31 October 2016. Associate Editor: Sally Dunwoodie.
ISSN: Online 1696-3547, Print 0214-6282
© 2017 UPV/EHU Press Printed in Spain
Abbreviations used in this paper: DIO, diet induced obesity; dpf, days post fertilization; ECS, endocannabinoid system; FFA, free fatty acid; hpf, hours post fertilization; OD, optical density; ORO, Oil Red-O; Rimo, Rimonabant; TLC, thin layer chromatography; WIN, WIN 55,212-2 mesylate; WT, wild-type.
vitro and on fixed histological samples. Hence, using ORO there
exists no method to quantify neutral lipids and triglycerides in vivo during zebrafish embryogenesis.
Here we propose a novel technique adapted for zebrafish embryogenesis that allows researchers to rapidly and reliably quantify the amount of ORO stain detected in the zebrafish embryo. Which can be directly correlated to the levels of triglycerides and neutral lipids present in the specimen. We developed this method using wild-type (WT) zebrafish during early embryogenesis. We tested this method using two known pharmacological compounds targeting the cannabinoid pathway that were previously shown to modify lipid content during zebrafish embryogenesis (Fraher et
al., 2015) Rimonabant (Rimo), a CB1 selective inverse agonist
and WIN 55,212-2 mesylate (WIN) a pan CB receptor agonist. The quantification method that was developed was approached having three aims in mind:
Apply the quantification method we developed to examine changes in neutral lipid and triglyceride deposition in wild-type zebrafish during embryogenesis to investigate the changes oc-curring in the zebrafish body and the yolk sac as two independent systems.
Examine and quantify the deposition of neutral lipids and triglyc-erides after the modulation of the endocannabinoid system (ECS). Validate the quantification of neutral lipids and triglycerides using two methods; firstly via a well-known method for the quantification of lipids; TLC and secondly via ORO after exogenous injection of BODIPY free fatty acids.
Experimental Procedures
Animal use
Zebrafish studies were approved by the Deakin University subcommittee on Animal Welfare and Ethics, under protocol G17-2015. Zebrafish embryos were collected from the spawn of WT zebrafish (strain AB) from an aquatic habitats fish facility at the Deakin University upper animal house. Zebrafish were maintained according to normal zebrafish husbandry procedures.
Compounds and treatments
Zebrafish embryos were treated between the time frames of 24-50hpf with the following compounds:
WIN 55,272-2: (WIN) (Cayman Chemicals- [2,3-Dihydro-5-meth- yl-3-(4-morpholinylmethyl)pyrrolo[1,2,3-de]-1,4-benzoxazin-6-yl]-1-napthalenylmethanone mesylate, cat# 10009023). Working solution was made up in 100% Dimethyl Sulfoxide (DMSO) (Sigma, cat# W387509) and stored at -20°C.
Rimonabant (Rimo): (Cayman Chemicals- 5-(4-chlorophenyl)- 1-(2,4-dichlorophenyl)-4-methyl-N-1-piperidinyl-1H-pyrazole-3-carboxamide, cat# 9000484). Working solution was made up in 100% Dimethyl Sulfoxide (DMSO) (Sigma, cat# W387509) and stored at -20°C.
For treatments 25 zebrafish embryos were placed in 50mL DB BPA free Flacon tubes and then topped up to 25mL with E3 zebrafish water. Embryos were either treated with 3mM Rimo or
0.3mM WIN and control (wild-type) (treated at; 24-50hpf, 50-72hpf
and 72-96hpf) embryos were treated with DMSO alone (compound vehicle). 250mL of PTU (1-Phenyl-2-thiourea) (Sigma Aldrich, cat#
7629) was then added to each tube to prevent pigment formation. Tubes were then incubated at 28°C±1°C for the required time
periods. Embryos were then dechorionated before being fixed in 4% PFA (Sigma, Paraformaldehyde, Polyoxymethyleneat, cat# 158127) and stored at 4OC.
Oil-Red O (ORO) staining
Stock solution
Add 0.5g of Oil Red O (Sigma- 1-([4-(Xylylazo)xylyl]azo)-2-naphthol, cat# O0625) add to 100ml 100% isopropanol (AnalaR NORMAPUR, cat# 20842.330). Stirred overnight on a magnetic stirrer at room temperature and then filtered using 0.2mM
What-man filters (WhatWhat-man, cat# 1202125). Store at 4OC.
Working solution
Stir ORO stock solution for 5-10 minutes before taking aliquot. Mix 1 part ORO stock to 1 part 10% isopropanol (in MilliQ water). Mix and let sit at room temperature for 20 minutes before use.
Staining
Rimo and WIN treated (24-50hpf) embryos and control (wild-type; 24-50hpf, 50-72hpf and 72-96hpf) embryos that were fixed in 4% PFA at 4OC overnight were washed with 60% isopropanol for 1 hour. 60% isopropanol was discarded and was replaced with 1 mL of ORO working solution (0.25% ORO stock in 60% isopropanol) for 1 hour and 15 mins. ORO solution is then dis-carded and embryos are washed quickly (30 seconds) with 60% isopropanol. Then rinsed again for 3 mins in 60% isopropanol, followed by a 30 second was in 0.1% PBTw (PBS with 0.1% Tween 20 (Sigma- Polyoxyethylenesorbitan monolaurate, cat# P1379). ORO stained fish go through a series of glycerol (Chem-supply, 1,2,3-Propanetriol, cat# GA010) washes prior to storage; 30% glycerol (made up in PBTw), 50% glycerol and 75% glycerol, each for 15 mins at room temperature. Embryos are then stored in 75% glycerol at 4OC.
ORO extraction and quantification
Rimo and WIN Treated zebrafish embryos were dissected in order to dissect the yolk sac away from the body and were stored in separate 1.5mL Eppendorf tubes. Sample sizes of 10 embryos were pooled together per Eppendorf tube in order to extract adequate volume of ORO stain. Replicates for each treatment group ranged from 4-8 Eppendorf tubes. E3 zebrafish water was then removed from each Eppendorf tube leaving just the zebraf-ish body or the yolk sac and then 250mL of 4% v/v Igepal CA-630
(Sigma- Octylphenoxy poly(ethyleneoxy)ethanol, cat# I8896) (can substitute with Nonidet P-40 (Octylphenoxy poly(ethyleneoxy) ethanol) made up in 100% isopropanol was added to each Ep-pendorf tube. Samples were briefly mixed in a vortex machine (Vortex Genie 2, Scientific Industries Inc., Bohemia, N.Y, 11716, USA, Laboratory Equipment, and Model G-560E) and incubated at room temperature for 2 hours until the zebrafish bodies and yolk sacs were lacking any ORO staining (tissue goes visibly white), indicating all the ORO stain has been completely extracted into solution. 200mL of the solution that contained the extracted ORO
stained embryos were then normalised to OD measurements of non ORO staining zebrafish embryo bodies.
ORO imaging
Zeiss microscope axioshop with an axiocam digital camera and AxioVision Rel 4.8 software was used to take images of ORO stained zebrafish embryos at magnification 100X.
Zebrafish lipid extraction and analysis
Lipid extraction
Rimo and WIN treated zebrafish embryos as well as control embryos were dissected in order to dissect the yolk sac away from the body as only the bodies are required, to give an average yield of 10mg of dried lipid sample. Total lipids were extracted according to the Bligh and Dyer method (Bligh & Dyer 1959) with slight modi-fications. For lipid extraction, 10-20 embryo bodies were pooled. Zebrafish were transferred to a microfuge tube in minimal media and 200ml of homogenization buffer (20 mM Tris, 1 mM EDTA)
was added. The embryos were then homogenized by hand using a mini-pestle and 750 ml of chloroform: methanol (1:2) was added
to the homogenate, followed by 250 ml of chloroform and 250 ml
of homogenization buffer. Samples were vortexed for 30 seconds after the addition of each extraction reagent. Samples were incu-bated at ~25°C for ~5-10 minutes and centrifuged at 3000 g for 5
minutes. The organic phase was transferred to a clean microfuge tube. The organic phase was then purified using authentic upper phase, which is prepared the same way as above, however the sample is substituted for distilled water, 450 ml of authentic upper
phase is added to the previously collected organic phase and the samples are incubated at ~25°C for ~5-10 minutes and centrifuged
at 3000 g for 5 minutes. The organic phase is then collected and transferred to a clean microfuge tube and stored at −80°C.
Drying lipid samples
Sample in the 10 ml glass screw cap tube that was obtained from the lipid extraction process is placed in the water bath heating system which was attached to the N-EVAP TM III Nitrogen Evaporator (Organomation Associates, Inc. Berlin, MA, 01503, USA). Tubes were placed in the apparatus (held in place by springs) and the nitrogen needles were lowered so that they were above the sample liquid but not in the liquid. Nitrogen needles were cleaned with dichloromethane:methanol (DCM:MeOH) prior to use. Samples were dried using nitrogen gas until samples were completely dry. Samples were then reconstituted in hexane in order to be analyzed via thin layer chromatography (TLC).
Thin layer chromatography analysis of lipids present
Extracted oil samples are analysed by capillary chromatography with a flame ionization detector (Iatroscan MK5, Iatron Laborato-ries Inc., Tokyo, Japan), as described in Byreddy AR et al., 2016 (Byreddy et al., 2016).
Free fatty acids injections and imaging
Preparation of free fatty acids for injection
BODIPY-labelled Free Fatty Acids ((BODIPY® FL C12 4,4-Diflu-oro-5,7-Dimethyl-4-Bora-3a,4a-Diaza-s-Indacene-3-Dodecanoic Acid) (Thermo Fisher Scientific, cat# D-3823) were constituted in commercially available olive oil to a final working concentration of 1 mg/ml. An insulin injection needle was used to load the FFA into a
glass capillary injection needle with an outside diameter of 1 mm. The injection needle was then placed into a table top centrifuge and spun at 150-500 rpm at 10 second intervals until the FFA was settled at the needle tip.
Injection of free fatty acids
Preloaded glass capillary injection needles were loaded into the MPPI-2 pressure injector (Applied Scientific Instrumentation, Oregon, United States). Approximately ~2 ng of conjugated
BODIPY-labelled Free Fatty Acids was injected into the yolk sac of 24 hpf anesthetized (4mg/ml Tricaine, Sigma Aldrich, cat# E10521)) ze-brafish embryos (remained inside chorion) as previously described (Miyares, de Rezende & Farber 2014).
Imaging of free fatty acid-injected zebrafish embryos
Imaging of FFA injected zebrafish embryos was performed on the ZOE fluorescent cell imager (Bio-Rad Laboratories, Inc, Victoria, Australia). At 20X magnification under a GFP filter at specifications; Gain: 40, Exposure: 100, LED Intensity: 40, Contrast: 26.
Statistical analysis
When possible, ORO extraction experiments were completed using 5 replicates with 10 zebrafish embryos per replicate and FFA injections using 4 replicates with 10 zebrafish embryos per replicate to facilitate statistical analysis. Rimonabant and WIN-552272-2 treated groups were each compared with the control group and WT 72hpf and WT 96hpf were compared with WT 50hpf, whilst WT 96hpf was also compared with WT 72hpf, using SPSS software (version 22.0; Fullerton, USA). OD (optical density) data for each of the treatments including the ORO stained control group was normal-ized to the data of the non-ORO stained control group. Statistical analysis of BODIPY FFA injection experiments were performed as described above using SPSS software. Independent sample t-test analysis was used assess the difference in OD between the treatment groups and the ORO stained control groups; translating to a difference in lipid deposition between the treatment groups and the control group. Data was significant if p<0.05.
Results and Discussion
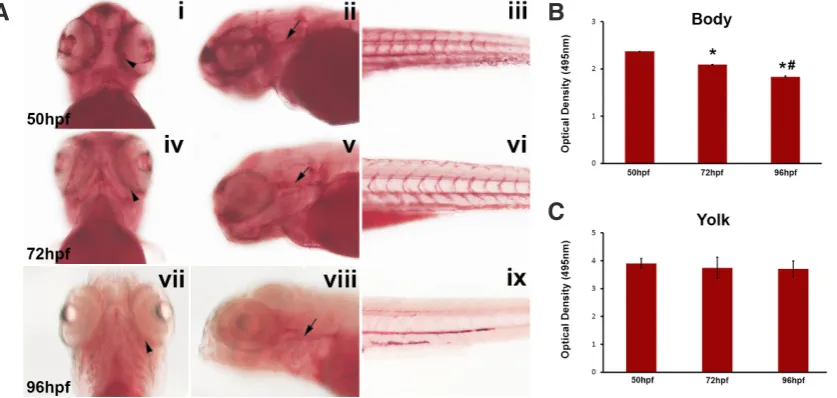
First, we used WT embryos that haven’t been exposed to ei-ther Rimo or WIN during different stages of development (50, 72 and 96 hours post fertilization (hpf)) when lipid deposition can be visualized by ORO staining (Fig. 1A). From 0 hpf up until 5 days post fertilization (dpf), the zebrafish embryo is considered a “closed system” and solely relies on its yolk sac for nutrients throughout development until and early larval stage (which primarily consists of lipids) as it is a lecithotrophic organism (Kunz-Ramsay 2013) and won’t be able to commence feeding until 5 dpf. When WT embryos were stained using ORO at 50 hpf, 72 hpf and 96 hpf, ORO staining was localized in the forebrain, around the eye, underneath the otic vesicle, and in the developing vasculature (number of biological replicates = 4, n = 10 embryos per biological replicate) as previ-ously described (Nishio et al., 2012) (Fig. 1A). It was observed that as the nutrients in the yolk (as the zebrafish were progressing through development) were depleted the intensity and localization of the ORO stain decreased.
which the yolk sac was dissected intact from the zebrafish body (Fraher et al., 2016). Quantification was then performed via optical density (OD) analysis on the body and yolk sac separately. As ORO stains for neutral lipids and triglycerides, OD measurements can be taken as a direct and correlative indication for the amount of neutral lipids and triglycerides that are present within the zebrafish embryo compared to a reference point or control. Quantification demonstrated that at 72 hpf and 96 hpf there was a 11.80% and 22.70% decrease in ORO staining in the body of the embryo
compared to the body of WT 50 hpf embryos (n = 10 embryos per time point, P = 0.016 and 0.045 respectively, student t-test). Moreover, at WT 96 hpf there was a 12.35% decrease in ORO staining compared to compared to WT 72 hpf zebrafish embryos (Fig. 1B, n = 10 embryos per time point, P = 0.000017, student t-test). This data fits well with the observation that ORO staining decreases as development progresses during early zebrafish em-bryogenesis. There was no significant change in measurements from OD analysis of ORO staining extracted from the yolk sac of
Fig. 2. Spread of OD Measure-ments. Optical Density analysis of ORO stained embryos using a microplate spectrophotometer. Quantification took into account the intensity and amount of ORO staining present within the body (A) and yolk sac (B) of the zebrafish embryos. Data is represented as optical density measurements analysed at a wavelength of 495 nm. 72 hpf and 96 hpf embryos show a significant decrease in ORO staining compared to 50 hpf embryos, whilst 96 hpf em-bryos also show a s significant decrease in ORO staining com-pared to 50 hpf embryos. Data is represented as the mean ± SEM of the staining. Raw optical density data is also displayed to display the spread of optical density measurements across each of the 5 experiments (consisting of 10 embryos each) for the body (A) and yolk sac (B). *p<0.05, @ = measured at wavelength 495nm.
B
A
Fig. 1. Staining for neutral triglycerides and lipids in wild-type embryos and quantification of ORO staining. (A) 50 hpf, 72 hpf and 96 hpf wild-type embryos from ORO. Arrowheads are pointing to ORO staining around the eyes and arrows are pointing to ORO staining in the head. Ventral view is shown in the first column, anterior view is shown in the second column and posterior view is shown in the third column. (i-iii) 50 hpf, (iv-vi) 72 hpf, (vii-ix) 96 hpf. 72 hpf and 96 hpf embryos showed decreased ORO staining compared with 50 hpf embryos and 96 hpf embryos showed decreased ORO staining compared with 72 hpf embryos. This figure is representative of 10 embryos per treatment (5 replicates with 10 embryos in each). (B,C)
Optical Density analysis of ORO stained embryos using a microplate spectrophotometer. Quantification took into account the intensity and amount of ORO staining present within the body (B) and yolk sac (C) of the zebrafish embryos. Data is represented as optical density measurements analysed at a wavelength of 495 nm. 72 hpf and 96 hpf embryos show a significant decrease in ORO staining compared to 50 hpf embryos, whilst 96 hpf embryos also show a significant decrease in ORO staining compared to 50 hpf embryos. Data is represented as the mean ± SEM of the staining for 50 embryos for 50 hpf (5 replicates with 10 embryos in each), 50 embryos for 72 hpf and 50 embryos for 96 hpf (n=5). *p<0.05 compared to 50hpf embryos, # p<0.05 compared to 72hpf embryos, @ = measured at wavelength 495nm.
B
the embryos at each studied time points (Fig. 1C, n = 10 embryos per time point). This is explained by the fact that the yolk sac is dense with lipids causing ORO staining to be trapped and become saturated, even though ORO staining was decreasing within the body of the zebrafish embryo there was no significant change in the yolk sac. As a result quantification of neutral lipids and triglyc-erides via ORO staining is optimal only for changes in the embryo’s body. To confirm the reproducibility of this assay, we performed the same experiment over multiple replicates in 50, 72 and 96 hpf embryos. We were able to show that OD measurements remained consistent and uniform in both the zebrafish body and the yolk sac (Fig. 2). This is demonstrated by the spread between the values for the OD measurements between each of the replicates at each respective time point (50, 72 and 96 hpf) for WT embryo bodies (Fig. 2A), which produced a tight grouping of OD measurements (σ = 0.005, 0.007, 0.001, respectively). This was also observed for the spread of OD measurements for the yolk sacs of WT em-bryos at each of the subsequent time points (Fig. 2B) (σ = 0.01, 0.01, 0.007, respectively). Through this data we have been able to demonstrate that we can accurately and in a reproducible manner measure the level of neutral lipids and triglycerides being deposited, and that ORO staining can be used to repeatedly quantify neutral lipids and triglycerides during vertebrate embryogenesis. As the zebrafish is becoming a popular model in metabolic studies we wanted to test if this method of lipid quantification could be ap-plied to measure physiological differences in lipid content during zebrafish embryogenesis.
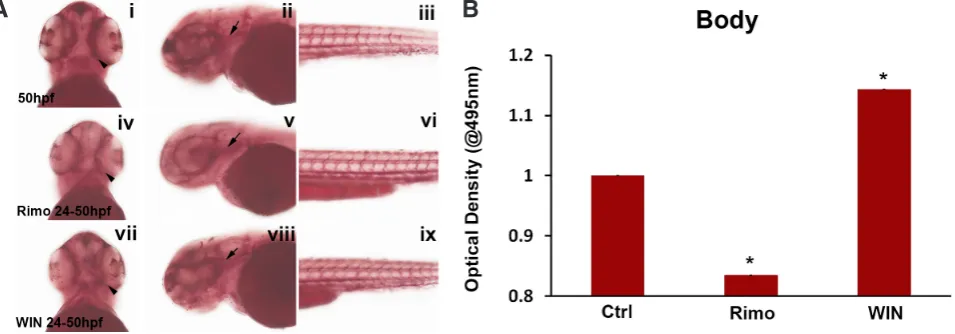
Increasing endocannabinoid (ECS) activity by treatment with 0.3 mM WIN, as we previously demonstrated, caused an increase
in ORO staining and expansion of the stained areas (Fraher et al., 2015). While decreasing ECS activity with 3 mM Rimo decreased
the area and intensity of ORO staining in the body of the embryos (Fraher et al., 2015) (Fig. 3A, n = 10 embryos per treatment). To
confirm the changes in the deposition of neutral lipids and triglycer-ides, ORO staining was measured via OD analysis (Fig. 3B). Fitting with the observed overall ORO stain previously described (Fraher
et al., 2015), Rimonabant decreased ORO staining by 16.5% (n
= 10 embryos, P = 0.00005, student t-test) and WIN increased ORO staining by 14.4% (n = 10 embryos, P = 0.000016, student t-test). This data draws a parallel to previous studies that have validated that Rimo decreased lipid accumulation in the embryos, whilst the CB1/CB2 agonist WIN brought about an increase in lipid deposition. A study investigating the weight-loss produced by various anti-obesity drugs published that rimonabant reduced weight by nearly 14% over a 28 day dosing period observed in the diet induced obesity (DIO) rats (Vickers et al., 2011). Clinical trials conducted in 2006 across Europe and North America, dem-onstrated that Rimo produced a 10% weight loss in approximately 30% of the patients that were given a rimonabant dosage of 20 mg (Gadde & Allison 2006).
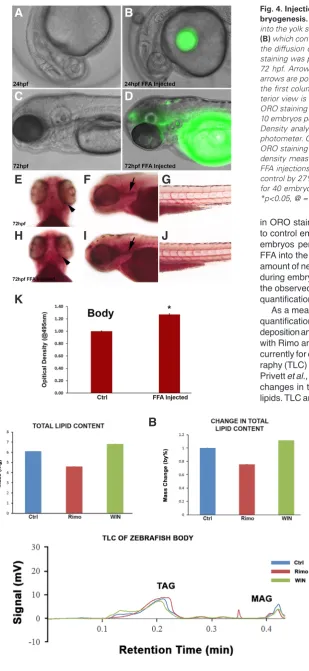
To validate the newly developed process we injected BODIPY-labelled fatty acids into the yolk sac of wild-type zebrafish embryos at 24 hpf as depicted by the hydrophobic fluorescent lipid sphere (Fig. 4B). Using BODIPY-labelled fatty acids not only can we intro-duce exogenous free fatty acids (FFAs) into the zebrafish yolk sac during embryogenesis but we are also able to track the dispersion of the FFAs into and around the zebrafish body, as observed at 72 hpf (Fig. 4C). It was evident that there was an increase in the amount of FFA in the head of the zebrafish embryo. Furthermore, ORO staining visually alone demonstrated that at 72 hpf there was an increased localization of ORO staining in the forebrain, around the eye, underneath the otic vesicle, and in the develop-ing vasculature of FFA injected embryos compared to the control embryos (Fig. 4 E-G) (number of biological replicates = 4, n = 10 embryos per biological replicate) (Fig. 4 H-J). Quantification via OD analysis revealed that at 72 hpf there was a significant increase
Fig. 3. Staining for neutral triglycerides and lipids after activation of the ECS and quantification of ORO staining 24-50 hpf. (A) Embryos from ORO, treated from 24-50 hpf. Arrowheads are pointing to ORO staining around the eyes and arrows are pointing to ORO staining in the head. Ventral view is shown in the first column, anterior view is shown in the second column and posterior view is shown in the third column. (i-iii) Control 50 hpf, (iv-vi) 3 mM Rimo treated 24-50 hpf, (vii-ix) 0.3 mM WIN treated 24-50 hpf. Rimo treatments showed decreased ORO staining compared with control treated embryos and WIN treatments depicted increased ORO staining compared with control treated embryos. This figure is representative of 10 embryos per treatment (n=10). (B,C) Optical Density analysis of ORO stained embryos using a microplate spectrophotometer. Quantification took into account the intensity and amount of ORO staining present within the body (B) of the zebrafish embryos. Data is represented as optical density measurements analysed at a wavelength of 495 nm. Rimo treatments show a significant decrease in ORO staining compared to control by 16.5%, whilst WIN treatments show a significant increase in ORO staining compared to control by 14.4%. Data is represented as the mean ± SEM of the staining for 50 embryos for control (5 replicates with 10 embryos in each), 50 embryos for Rimo and 50 embryos for WIN (n=5). *p<0.05, @ = measured at wavelength 495nm.
in ORO staining in the body of FFA injected embryos compared to control embryos by approximately 27% (replicates = 4, n = 10 embryos per replicate, P = 0.0279, student t-test). By injecting FFA into the yolk sac, we were able to exogenously increase the amount of neutral lipids and triglycerides available to the zebrafish during embryogenesis, but were also able to accurately measure the observed increase in neutral lipids and triglycerides using our quantification method.
As a means of further validating the developed method for the quantification of neutral lipids and triglycerides, we compared lipid deposition and its composition in bodies of zebrafish embryos treated with Rimo and WIN from 24-50 hpf against a known method used currently for quantifying and analysing lipids, thin layer chromatog-raphy (TLC) lipid analysis (Fuchs et al., 2011; Hudson et al., 2001; Privett et al., 1965). TLC allows for the measure of two parameters: changes in total lipid content and changes in specific classes of lipids. TLC analysis revealed that Rimo- and WIN-treated embryos
Fig. 5. Total lipid content (TLC) and TLC analysis of the zebrafish body.(A) Mass (mg) of total lipid content extracted from each of the groups; control, rimo and WIN. A decrease in total lipid content is observed in the rimo treatment group compared to control group, whilst an increase is observed in WIN treated groups.
(B) Percentage change in total lipid content in rimo and WIN treated groups normalised to the control treatment group. (C) TLC analysis of treated zebrafish bodies show that the peak for the triglyceride (TAG) lipid group has a retention time of approximately 0.21 min. No statistical analysis was performed as there was only one replicate for each treatment group. Blue: Control treatment group; Red: Rimo treatment group; Green: WIN treatment group.
B
A
C
Fig. 4. Injection of BODIPY free fatty acids into zebrafish during em-bryogenesis. At 24 hpf WT embryos were collected and FFA was injected into the yolk sac. A WT embryo (A) is compared to a FFA injected embryo
(B) which contains a GFP tagged hydrophobic FFA vacuole. (C-D) Portrays the diffusion of the FFA from the yolk sac into the zebrafish body. ORO staining was performed on WT (E-G) and FFA injected embryos (H-J) at 72 hpf. Arrowheads are pointing to ORO staining around the eyes and arrows are pointing to ORO staining in the head. Ventral view is shown in the first column, anterior view is shown in the second column and pos-terior view is shown in the third column. At 72 hpf there was increased ORO staining in the FFA injected embryos This figure is representative of 10 embryos per treatment (4 replicates with 10 embryos in each). Optical Density analysis of ORO stained embryos using a microplate spectro-photometer. Quantification took into account the intensity and amount of ORO staining present within the body (K) Data is represented as optical density measurements analysed at a wavelength of 495 nm. At 72 hpf FFA injections show a significant increase in ORO staining compared to control by 27%. Data is represented as the mean ± SEM of the staining for 40 embryos for control (4 replicates with 10 embryos in each) (n=5). *p<0.05, @ = measured at wavelength 495nm.
B
C
D
A
G
E
F
H
I
J
yielded 4.8 mg and 6.1 mg of total lipid content respectively, cor-responding to a 21% decrease and a 9% increase compared to the control (Fig. 5A, Fig. 5B, n=500 embryos per treatment group). Changes in total lipids present similar findings to what we observe when we quantify ORO staining (Fig. 3B). However, TLC analysis demonstrated that triglyceride levels in all treatment groups do not change and remained uniform (Fig. 5C). Since it is known that ORO staining depicts the localization of triglycerides and other neutral lipids, it can be hypothesised that the changes in total lipid content that we observed during early zebrafish development (24-50 hpf) under the exposure of Rimo and WIN was not due to triglycerides but other classes of neutral lipids that are yet to be identified.
Conclusion
The development of this method demonstrates that ORO staining alone can now be used as a consistent and reliable method of quan-tifying the neutral lipids and triglycerides content during zebrafish embryogenesis. As a result, instead of using ORO staining solely qualitatively which will then need to be further investigated using other lipid analysis methods. ORO staining now used to provide a visual representation but it also allows the quantification of neutral lipids and triglycerides; ultimately saving time and resources.
In addition, it is important to note that the zebrafish samples that are pooled together across each of the replicates are con-sistent, i.e. they are of similar age. Embryos that are different in age would have varying amounts of lipids present, consequently resulting in varying degrees of ORO staining. For that reason, it is crucial that similar aged embryos are used in the ORO staining and quantification process.
This method not only paves the way towards the application of ORO staining in measuring the deposition of neutral lipids and triglycerides in zebrafish during embryogenesis, but it provides the benefit of being utilised in an in vivo model whereas before it has been limited to, as previously mentioned in in vitro (Kang et al., 2013) applications and fixed histological samples (Lee et al., 2016).
References
BLIGH, EG AND DYER, WJ (1959). A rapid method of total lipid extraction and purification. Can J Biochem Physiol 37: 911-917.
BYREDDY, AR, BARROW, CJ and PURI, M (2016). Bead milling for lipid recovery from thraustochytrid cells and selective hydrolysis of Schizochytrium DT3 oil using lipase. Bioresour Technol 200: 464-469.
D’ALENCON, CA, PENA, OA, WITTMANN, C, GALLARDO, VE, JONES, RA, LOOSLI, F, LIEBEL, U, GRABHER, C and ALLENDE, ML (2010). A high-throughput
chemi-cally induced inflammation assay in zebrafish. BMC Biol 8: 151.
FRAHER, D, ELLIS, MK, MORRISON, S, MCGEE, SL, WARD, AC, WALDER, K and GIBERT, Y (2015). Lipid Abundance in Zebrafish Embryos Is Regulated by Complementary Actions of the Endocannabinoid System and Retinoic Acid Pathway. Endocrinology 156: 3596-3609.
FRAHER, D, SANIGORSKI, A, MELLETT, NA, MEIKLE, PJ, SINCLAIR, AJ and GIB-ERT, Y (2016). Zebrafish Embryonic Lipidomic Analysis Reveals that the Yolk Cell Is Metabolically Active in Processing Lipid. Cell Rep 14: 1317-1329
FUCHS, B, SUSS, R, TEUBER, K, EIBISCH, M and SCHILLER, J (2011). Lipid analysis by thin-layer chromatography--a review of the current state. J Chromatogr
A 1218: 2754-2774.
GADDE, KM and ALLISON, DB (2006). Cannabinoid-1 receptor antagonist, rimonabant, for management of obesity and related risks. Circulation 114: 974-984. HUDSON, ED, HELLEUR, RJ and PARRISH, CC (2001). Thin-layer
chromatography-pyrolysis-gas chromatography-mass spectrometry: a multidimensional approach to marine lipid class and molecular species analysis. J Chromatogr Sci 39: 146-152. KANG, OH, KIM, SB, SEO, YS, JOUNG, DK, MUN, SH, CHOI, JG, LEE, YM, KANG, DG, LEE, HS and KWON, DY (2013). Curcumin decreases oleic acid-induced lipid accumulation via AMPK phosphorylation in hepatocarcinoma cells. Eur Rev
Med Pharmacol Sci 17: 2578-86.
KARLSSON, J, VON HOFSTEN, J and OLSSON, PE (2001). Generating transpar-ent zebrafish: a refined method to improve detection of gene expression during embryonic development. Mar Biotechnol (NY) 3: 522-527.
KUNZ-RAMSAY, Y (2013). Lecithotrophic species, Developmental Biology of Teleost
Fishes. Springer Science and Business Media.
LEE, EY, YOO, JA, LIM, SM and CHO, KH (2016). Anti-Aging and Tissue Regen-eration Ability of Policosanol Along with Lipid-Lowering Effect in Hyperlipidemic Zebrafish via Enhancement of High-Density Lipoprotein Functionality.
Rejuvena-tion Res 19: 149-58.
MATHIAS, JR, DODD, ME, WALTERS, KB, YOO, SK, RANHEIM, EA and HUTTENLO-CHER, A (2009). Characterization of zebrafish larval inflammatory macrophages.
Dev Comp Immunol 33: 1212-1217.
MIYARES, RL, DE REZENDE, VB and FARBER, SA (2014). Zebrafish yolk lipid pro-cessing: a tractable tool for the study of vertebrate lipid transport and metabolism.
Dis Model Mech 7: 915-27.
NISHIO, S, GIBERT, Y, BEREKELYA, L, BERNARD, L, BRUNET, F, GUILLOT, E, LE BAIL, JC, SANCHEZ, JA, GALZIN, AM, TRIQUENEAUX, G and LAUDET, V (2012). Fasting induces CART down-regulation in the zebrafish nervous system in a cannabinoid receptor 1-dependent manner. Mol Endocrinol 26: 1316-1326. PARICHY, DM, ELIZONDO, MR, MILLS, MG, GORDON, TN and ENGESZER, RE
(2009). Normal Table of Post-Embryonic Zebrafish Development: Staging by Externally Visible Anatomy of the Living Fish. Dev Dyn 238: 2975-3015. PRIVETT, OS, BLANK, ML, CODDING, DW and NICKELL, EC (1965). Lipid Analysis
by Quantitative Thin-Layer Chromatography. J Am Oil Chem Soc 42: 381-393. SETH, A, STEMPLE, DL and BARROSO, I (2013). The emerging use of zebrafish
to model metabolic disease. Dis Model Mech 6: 1080-1088.
TINGAUD-SEQUEIRA, A, OUADAH, N and BABIN, PJ (2011). Zebrafish obesogenic test: a tool for screening molecules that target adiposity. J Lipid Res 52: 1765-1772. VICKERS, SP, JACKSON, HC and CHEETHAM, SC (2011). The utility of animal
Characterization and expression analysis of mcoln1.1 and mcoln1.2, the putative zebrafish co-orthologs of the gene responsible for human mucolipidosis type IV
Anna Benini, Andrea Bozzato, Silvia Mantovanelli, Laura Calvarini, Edoardo Giacopuzzi, Roberto Bresciani, Silvia Moleri, Daniela Zizioli, Monica Beltrame and Giuseppe Borsani
Int. J. Dev. Biol. (2013) 57: 85 - 93 http://dx.doi.org/10.1387/ijdb.120033gb
Loss of plakophilin 2 disrupts heart development in zebrafish
Miriam A. Moriarty, Rebecca Ryan, Pierce Lalor, Peter Dockery, Lucy Byrnes and Maura Grealy Int. J. Dev. Biol. (2012) 56: 711-718
http://dx.doi.org/10.1387/ijdb.113390mm
Could modifications of signalling pathways activated after ICSI induce a potential risk of epigenetic defects?
Brigitte Ciapa and Christophe Arnoult
5 yr ISI Impact Factor (2013) = 2.879
Int. J. Dev. Biol. (2011) 55: 143-152 http://dx.doi.org/10.1387/ijdb.103122bc
Generation of germ-line chimera zebrafish using primordial germ cells isolated from cultured blastomeres and cryopreserved embryoids
Yutaka Kawakami, Rie Goto-Kazeto, Taiju Saito, Takafumi Fujimoto, Shogo Higaki, Yoshiyuki Takahashi, Katsutoshi Arai and Etsuro Yamaha
Int. J. Dev. Biol. (2010) 54: 1493-1501 http://dx.doi.org/10.1387/ijdb.093059yk
Zebrafish epiboly: mechanics and mechanisms
Stephanie E. Lepage and Ashley E.E. Bruce Int. J. Dev. Biol. (2010) 54: 1213-1228 http://dx.doi.org/10.1387/ijdb.093028sl
Identification of hoxb1b downstream genes: hoxb1b as a regulatory factor controlling transcriptional networks and cell movement during zebrafish gastrulation
Willem M.R. van den Akker, Antony J. Durston and Herman P. Spaink Int. J. Dev. Biol. (2010) 54: 55-62