Cite as: Can Urol Assoc J 2015;9(1-2):E14-21. http://dx.doi.org/10.5489/cuaj.2147 Published online January 12, 2015.
Abstract
Introduction: In this study, we estimated the time from first detect-able prostate-specific antigen (PSA) following radical prostatec-following radical prostatec-tomy (RP) to commonly used definitions of biochemical recurrence (BCR). We also identified the predictors of time to BCR.
Methods: We identified subjects who underwent a RP and had an
undetectable PSA after surgery followed by at least 1 detectable PSA between 2000 and 2011. The primary outcome was time to BCR (PSA ≥0.2 and successive PSA ≥0.2) and prediction of the rate of PSA rise. Outcomes were calculated using a competing risk analysis, with univariable and multivariable Fine and Grey models. We employed a mixed effect model to test clinical predictors that are associated with the rate of PSA rise.
Results: The cohort included 376 patients. The median follow-up from surgery was 60.5 months (interquartile range [IQR] 40.8– 91.5) and from detectable PSA was 18 months (IQR 11–32). Only
45.74% (n = 172) had PSA values ≥0.2 ng/mL, while 15.16%
(n = 57) reached the PSA level of ≥0.4 ng/mL and rising. On multi-variable analysis, the values of the first detectable PSA and patho-logic Gleason grade 8 or higher were consistently independent predictors of time to BCR. In the mixed effect model rate, the PSA rise was associated with time from surgery to first detectable PSA, Gleason score, and prostate volume. The main limitation of this study is the large proportion of patients that received treatment without reaching BCR. It is plausible that shorter estimated median times would occur at a centre that does not use salvage therapy at such an early state.
Conclusion: The time from first detectable PSA to BCR may be
lengthy. Our analyses of the predictors of the rate of PSA rise can help determine a personalized approach for patients with a detect-able PSA after surgery.
Introduction
Radical prostatectomy (RP) is the surgical treatment of choice for clinically localized prostate cancer. Prostate-specific antigen (PSA) monitoring is the primary tool for detecting relapse of cancer after RP. About 27% to 53% of men undergoing RP will have a detectable serum PSA within 10 years of surgery.1-5 Although biochemical
recur-rence (BCR) is an ominous finding and is associated with an increased risk of progression to metastatic disease,6 it
precedes clinical recurrence by many years.7-9 Furthermore,
many patients with BCR will never progress.
Currently, level 1 evidence suggests that adjuvant radia-tion should be administered to patients with high-risk pros-tate cancer following RP.10-13 However, adjuvant
radia-tion has not been compared to early salvage radiaradia-tion.14-16
Therefore, most urologists would rather use early salvage therapy, most commonly offered after reaching BCR rather than after the first detectable PSA.17 To the best of our
knowl-edge, the time frame from the first detectable PSA to BCR has not been explored.
In this study we used the 4 most accepted definitions for BCR: (1) PSA ≥0.2 ng/mL; (2) an initial PSA of ≥0.2 ng/mL and successive PSA ≥0.2 ng/mL; (3) PSA ≥0.4 ng/mL; and (4) PSA ≥0.4 ng/mL and rising. We examined the natural history of the first detectable PSA and determined the associated predictors of reaching BCR.6,17-20 Since physicians differ in
the exact time and PSA level for which they offer salvage radiation treatment, we also provide additional analysis to predict the rate of PSA rise after the first detectable PSA.
Methods
We used a retrospective cohort design to test the natural history of patients with a detectable PSA following RP. Our
Leonora de Boo, MD;
*Melania Pintilie, PhD;
†Paul Yip;
§Jack Baniel, MD;
¥Neil Fleshner, MD, FRCSC;
±David Margel, MD, PhD
£*Division of Urology, Department of Surgical Oncology,University Health Network, Toronto, ON and Erasmus MC-beurs, Erasmus University Rotterdam, Netherlands; †Clinical Study Coordination and Biostatistics,
University Health Network, Toronto, ON; §Laboratory Medicine Program, University Health Network, Toronto, ON; ¥Division of Urology, Rabin Medical Center and Sackler Faculty of Medicine, Tel Aviv University,
Tel Aviv, Israel; ±Division of Urology, Department of Surgical Oncology, University Health Network, Toronto, ON; £Division of Urology and Davidoff Cancer Center, Rabin Medical Center, Beilinson Hospital, Israel
objective was to report the time from the first detectable PSA to 4 commonly used definitions of BCR and to identify predictors of time to BCR. The study was approved by the institutional review board at the Princess Margaret Cancer Centre, University Health Network, Toronto, Canada.
Our study included patients who underwent RP for clinic-ally localized prostate cancer between the January 1, 2000 and March 1, 2011. All subjects had to have an undetect-able PSA after surgery followed by at least 1 detectundetect-able PSA. The cohort entry date was defined as the date of the first detectable PSA. We followed up eligible individuals until they experienced an event (4 different definitions of BCR), or among those who did not reach BCR, until last follow-up visit, whichever came first. Patients treated with salvage radiation or androgen-deprivation therapy (ADT) before reaching our definitions of BCR were not at risk for biochemical failure. Thus these patients experienced a competing event at the date of salvage treatment initiation. We excluded patients receiving any form of neoadjuvant or adjuvant therapy.
RP specimens were examined by specialist genitourin-ary pathologists at our institution. Following surgery, serum PSA levels were measured every 3 months for the first year, biannually in years 2 and 5, and annually thereafter. PSA assays used at our institution were AxSYM Total PSA assay (Abbott Diagnostics) before November 21, 2006, and the ARCHITECT Total PSA assay (Abbott Diagnostics) thereafter with a 0.04 ng/mL lower detection limit for both assays.
Our primary analysis used the most commonly used BCR definition: initial PSA ≥0.2 ng/mL and successive PSA
≥0.2 ng/mL.17,19,20 A secondary analysis tested 3 other
def-initions for BCR: any PSA ≥0.2 ng/mL;6 any PSA ≥0.4 ng/
mL;18 and any PSA ≥0.4 ng/mL and rising.17
Possible predictors of time to BCR can be: baseline patient characteristics (age); pathology (Gleason score, prostate vol-ume, pathologic stage, margin status, perineural invasion); and PSA related criteria (PSA value prior to surgery, time from RP to first detectable PSA, first detectable PSA value). For each definition of failure, there are events which com-pete with the event of interest (i.e., BCR). Thus, the statis-tical techniques are specific to competing risk analysis. The probability of failure was calculated based on cumulative incidence function.21 The probabilities of failure between
groups of patients were compared using Gray’s test and the model was based on Fine and Gray’s work.22,23
The time to failure was calculated from the first detectable PSA to the first event (BCR, treatment or last follow-up). The commencement of treatment was considered competing risk event. The covariates considered in the analysis were: age, pathologic T category, prostate volume, percent of tumour, margins, extra-prostatic extension, seminal vesicle invasion, the absolute value of the first PSA detected. The duration
between RP and the first detectable PSA and the Gleason score at the time of RP were also analyzed. Lympho-vascular invasion and perineural invasion have more than 10% mis-sing values (19% and 21%, respectively) and were not con-sidered in the analysis.
To test for clinical predictors that are associated with rate of PSA rise (i.e., the slope), we employed a mixed effect model. A mixed model is a statistical model containing both fixed effects and random effects. These models are particu-larly useful in settings where repeated measurements are made on the same statistical units. In our case, we used a mixed effect model to account for the repeated measurement over time of PSA. Similar clinical factors were considered as applied in the former analysis. The outcome was the PSA value and time was measured in months.
Results
Our cohort consisted of 376 patients (Table 1), with a median age at RP of 61 (interquartile range [IQR] 56–66). The median time from RP to last follow-up in patients who did not receive early salvage treatment was 60.5 months (IQR 40.8–91.5) and the median time from RP to the first detectable PSA was 26.9 months (IQR 11.7–43.0). Based on the D’Amico classification system, 77 (20.5%) men had low-risk cancer, 253 (67.3%) men had intermediate-low-risk cancer and 46 (12.2%) men had high-risk cancer.
The median follow-up time from the first detectable PSA to the end of follow-up among those who did not reach BCR was 18 months (IQR 11–32). Only 45.74% (n = 172) of our cohort had a single PSA value of ≥0.2 ng/mL, while 15.16% (n = 57) reached the PSA level of ≥0.4 ng/mL and rising.
Despite excluding all subjects receiving adjuvant treat-ment or not reaching undetectable PSA, 56.4% (n = 212) received salvage treatment prior to the end of follow-up. Of this group, 187 (88.2%) men received radiation ther-apy and 25 were treated with ADT (11.8%). The medi-an PSA value before salvage treatment was 0.16 ng/mL (IQR 0.11–0.25), with a median follow-up of 6.2 months (IQR 2.8–12.9).
Estimates of time to biochemical recurrence
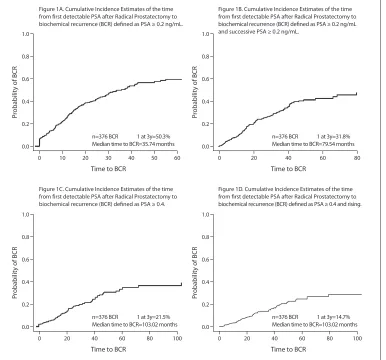
Figure 1 illustrates the cumulative incidence of BCR, using the competing-risk approach. After 3 years of follow-up, only 50.3% of patients reached a PSA value above 0.2 ng/mL (Fig. 1, part A) and only 31.8% a PSA value ≥0.2 ng/mL, and successive PSA ≥0.2 ng/mL (Fig. 1, part B).
first detectable PSA (D) are depicted in Figure 2. As shown, on univariable analysis a high initial PSA value (higher than 0.1), a Gleason score above 8 on RP, and a pathological stage above T3b were associated with earlier time to BCR. Margin status was not associated with BCR. Similar results were reached for the other BCR definitions.
Predictors of BCR
On multivariable analysis 2 variables were consistently independent predictors of time to reaching any of the 4 BCR definitions (Table 2). The absolute value of the first detectable PSA, as well as Gleason grade 8 or higher, were associated with an increased risk of time to any BCR. Age, PSA value prior to surgery, prostate volume, pathological
stage, margin status, and perineural invasion were not asso-ciated with time to BCR.
Predictors of rate of PSA rise
In the mixed effect model we demonstrated that PSA rise was associated with: time from RP to first detectable PSA, Gleason score at RP, and prostate volume. Furthermore, there is an equation that may be used to generate a projected PSA curve for patients with a detectable PSA following RP (Table 3).
In Figure 3 we provide an example of how physicians may use the above mentioned equation and provide a per-sonalized projected slope of PSA rise. In Figure 3, part A the predicted PSA values stratified by Gleason score are plotted Table 1. Clinical characteristics of patients treated by radical prostatectomy for clinically localized prostate cancer at the time of first detectable PSA
Characteristic Total cohort
(N = 376)
Patients treated with salvage therapy
(N = 212)
Patients not treated with salvage therapy
(N = 164)
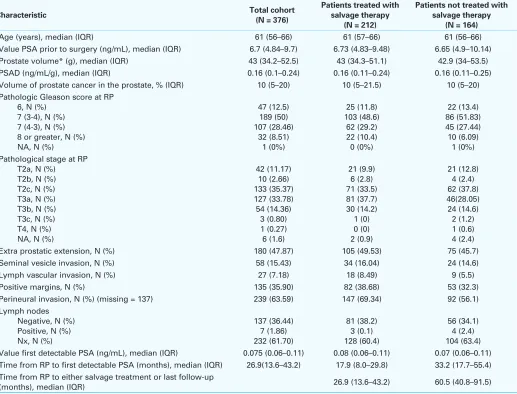
Age (years), median (IQR) 61 (56–66) 61 (57–66) 61 (56–66)
Value PSA prior to surgery (ng/mL), median (IQR) 6.7 (4.84–9.7) 6.73 (4.83–9.48) 6.65 (4.9–10.14)
Prostate volume* (g), median (IQR) 43 (34.2–52.5) 43 (34.3–51.1) 42.9 (34–53.5)
PSAD (ng/mL/g), median (IQR) 0.16 (0.1–0.24) 0.16 (0.11–0.24) 0.16 (0.11–0.25)
Volume of prostate cancer in the prostate, % (IQR) 10 (5–20) 10 (5–21.5) 10 (5–20)
Pathologic Gleason score at RP 6, N (%)
Extra prostatic extension, N (%) 180 (47.87) 105 (49.53) 75 (45.7)
Seminal vesicle invasion, N (%) 58 (15.43) 34 (16.04) 24 (14.6)
Lymph vascular invasion, N (%) 27 (7.18) 18 (8.49) 9 (5.5)
Positive margins, N (%) 135 (35.90) 82 (38.68) 53 (32.3)
Perineural invasion, N (%) (missing = 137) 239 (63.59) 147 (69.34) 92 (56.1)
Lymph nodes
Value first detectable PSA (ng/mL), median (IQR) 0.075 (0.06–0.11) 0.08 (0.06–0.11) 0.07 (0.06–0.11)
Time from RP to first detectable PSA (months), median (IQR) 26.9(13.6–43.2) 17.9 (8.0–29.8) 33.2 (17.7–55.4)
Time from RP to either salvage treatment or last follow-up
(months), median (IQR) 26.9 (13.6–43.2) 60.5 (40.8–91.5)
for a patient who had a first detectable PSA 24 months after surgery and had a prostate volume of 50 g. Figure 3, part B depicts the predicted PSA values stratified by prostate volume for a patient with a Gleason of 7 and a first detect-able PSA at 24 months. Similarly in Figure 3, part C the predicted PSA values stratified by time between surgery and first detectable PSA are plotted for a patient with a Gleason 7 and prostate volume of 50 g.
Discussion
Prior studies demonstrated that BCR after surgery predicts an ominous finding of distant metastasis.7-9 However, it may
precede clinical disease by many years. In fact, most patients will not develop any clinical manifestations despite having
BCR.6,18,24 Evidence suggests that adjuvant radiation therapy
should be offered to high-risk patients after RP.10-13 Critics to
this approach cite that this modality was not compared to early salvage therapy in pivotal studies, as well as that more recent trials have failed to demonstrate a survival benefit.25
Notwithstanding the fact that many patients with adverse pathology never manifest BCR, its clinical significance is uncertain, and salvage radiation may cure the disease, most urologists prefer to wait before referring patient for radiation. To the best of our knowledge, this is the first study to report
estimated time from first detectable PSA to BCR. We report that during the 60-month (IQR, 41-92) median follow-up, only 111 men (29.25%) in our cohort had BCR according to the definition recommended by the American Urological Association (AUA) and European Association of Urology (EAU).19 Thus our results suggest that, on average, the time
for patients who have a detectable PSA to reach BCR may be very long. Furthermore our mixed effect model demon-strates that the rate of PSA rise can be projected based on 3 factors: time from RP to first detectable PSA, Gleason score, and prostate volume.
One of the unique challenges we faced was identifying an appropriate cohort of patients. Unlike other studies test-ing BCR and its predictors,6-9,17-20 we wanted to formulate
a personalized strategy for the initiation of salvage therapy for patients with a first detectable PSA. The first problem we encountered trying to move forward was that no data existed to estimate median time to BCR among PSA failures. We therefore selected a cohort of patients who had surgery with-out neo- or adjuvant therapy. All subjects had to have had an undetectable PSA following surgery followed by at least one detectable PSA. In our analysis we also used the first detectable PSA as the cohort entry date, as opposed to the date of surgery. In doing this, our cohort became unbiased, as it includes all patients with a detectable PSA who would be candidates for a future personalized strategy. We had the best available data to estimate median time to BCR among patients with a detectable PSA following surgery.
The main limitation of this study is fact that many patients received early salvage therapy. A total of 212 men (56.4%) received either radiation or ADT during follow-up. Of these, 133 men received therapy before reaching a PSA of 0.2 ng/mL; these patients could have reached any BCR. We therefore performed our analyses considering such Table 2. Univariable and multivariable analysis of the predictors of time to BCR*
Predictor Univariable analysisHR (95% CI) Multivariable analysisHR (95% CI)
Age (years) 1 (0.97–1.03), p = 0.85
Value PSA prior to surgery (ng/mL) 1.01 (0.98–1.03), p = 0.63
Time from RP to first detectable PSA
(months) 1 (1–1.01), p = 0.17
Value first detectable PSA (ng/mL) 2.06 (1.72–2.47), p< 0.0001 2.02(1.71–2.39), p < 0.0001
Pathology Gleason score 6 (ref)
7
8 or greater
1
1.95 (0.96–3.95), p = 0.065 2.43 (1.02–5.81), p = 0.046
1
1.92 ( 0.94–3.91), p = 0.071 2.41 (1.01–5.79), p = 0.049
Prostate volume (g) 1 (0.99–1.01), p = 0.85
Pathological stage T2 and T3a (ref) T3b/c, T4
1
1.61 (1.05–2.5), p = 0.03
Margins (positive) 0.96 (0.65–1.4), p = 0.82
Perineural invasion (positive) 0.84 (0.52–1.36), p = 0.48
*BCR defined as ≥0.2 ng/mL and successive PSA ≥ 0.2 ng/mL. BCR: biochemical recurrence; PSA: prostate-specific antigen; HR: hazard ratio; CI: confidence interval; RP: radical prostatectomy.
Table 3. Equation to generate a projected PSA curve for patients with a detectable PSA following RP
PSA = exp (A + 0.0009 × RP to detection + 0.00018 × volume + B × time [months] – 0.0003 × time × RP to detection – 0.00015 × time
× volume)
events as competing risk events. Our results and estimated median time to BCR reflect current practice among aca-demic urologists who many times offer early salvage therapy to patients even before they reach a PSA of 0.2 ng/mL.
Aside from competing risk analyses, we also assessed PSA slope among patients with detectable PSA post-RP. This analysis was not affected by early salvage therapies. These additional analyses demonstrated that Gleason score, time to first detectable PSA, and prostate volume were independent predictors of the rate of rise. Furthermore we were able to plot a projected PSA rise given individual characteristics. If externally validated, these data may have significant utility in a clinical setting and they can be used to counsel patients on their best time to require salvage radiation based on their disease characteristics. These data are also important as many investigators use patients with detectable PSA to study novel agents (e.g., metformin, statins) that could even-tually be used to prevent or delay BCR or augment active
surveillance. In some ways these patients may be ideal as, in theory, the PSA production is exclusively secondary to tumour cell production and not confounded by benign pros-tatic hyperplasia. This study provides a framework by which one can statistically power such a clinical trial.
The effect of prostate size on oncologic outcome after RP remains controversial.26,27 Our analysis demonstrated that
among patients who have had a detectable PSA following surgery, those who have a smaller prostate will have a higher rise of PSA. The biological mechanism that explains this remains unknown. Smaller prostate size is correlated with higher grade and stage of disease and that may contribute to our findings.26 However in our multivariable analysis
prostate size was an independent predictor of the rate of PSA increase even after controlling for grade and stage. We hypothesized that more patients with large prostates may have residual benign tissue following RP. This would then contribute to a slower rise in PSA post-surgery. Although the
Fig. 1. Cumulative incidence estimates of the time from first detectable PSA after RP to BCR defined as: A: PSA ≥0.2 ng/ mL; B: PSA ≥0.2 ng/mL and successive PSA ≥0.2 ng/mL; C: PSA ≥0.4; D: PSA ≥0.4 and rising. Times indicated are months from first detectable PSA. Estimated cumulative incidence of BCR using the competing-risk approach for all. PSA: prostate-specific antigen; RP: radical prostatectomy; BCR: biochemical recurrence.
1.0
0.8
0.6
0.4
0.2
0.0
0 10 20 30
Time to BCR
Pr
obability of BCR
40 50 60 Figure 1A. Cumulative Incidence Estimates of the time from first detectable PSA after Radical Prostatectomy to biochemical recurrence (BCR) defined as PSA ≥ 0.2 ng/mL.
Figure 1B. Cumulative Incidence Estimates of the time from first detectable PSA after Radical Prostatectomy to biochemical recurrence (BCR) defined as PSA ≥ 0.2 ng/mL and successive PSA ≥ 0.2 ng/mL.
Figure 1C. Cumulative Incidence Estimates of the time from first detectable PSA after Radical Prostatectomy to biochemical recurrence (BCR) defined as PSA ≥ 0.4.
Figure 1D. Cumulative Incidence Estimates of the time from first detectable PSA after Radical Prostatectomy to biochemical recurrence (BCR) defined as PSA ≥ 0.4 and rising. n=376 BCR 1 at 3y=50.3%
Median time to BCR=35.74 months
1.0
0.8
0.6
0.4
0.2
0.0
0 20 40 60
Time to BCR
Pr
obability of BCR
80 100 n=376 BCR 1 at 3y=21.5% Median time to BCR=103.02 months
1.0
0.8
0.6
0.4
0.2
0.0
0 20 40 60
Time to BCR
Pr
obability of BCR
80 100 n=376 BCR 1 at 3y=14.7% Median time to BCR=103.02 months 1.0
0.8
0.6
0.4
0.2
0.0
0 20 40 60
Time to BCR
Pr
obability of BCR
exact biological explanation remains elusive our analysis demonstrated that prostate size was an important predictor of the rate in which PSA will rise among patients with PSA failures.
Another important finding is that margin status was not associated with either time to BCR or rate of PSA rise, con-trary to other studies.17 The reason for this is that our research
question is different than all other studies. We included only patients who had a PSA detected and among these patients we explored predictors of time to reaching BCR, or the rate of PSA rise. Margin status indeed was an important predictor of having a PSA detected after surgery. However for those who already have a PSA failure, it was not associated with a PSA rise.
Our study has several limitations. First, despite the pro-spective database used, the research question is retrospect-ive. Regrettably, our follow-up time was relatively short.
However, to the best of our knowledge this represents the first systematic analysis of this specific time frame and we believe these results and the associated predictors reported may provide patients and clinicians insight in the natural history of detectable PSA following RP. Second, our results reflect management trends at our tertiary centre and a large proportion of patients received treatment without reach-ing BCR. It is plausible that shorter estimated median times would have occurred at a centre that does not utilize salvage therapy at such an early state. However, we believe that these results reflect current treatment trends. Lastly our PSA lower detection limit was 0.04 ng/mL; many institutions use ultrasensitive assays for PSA with even lower PSA levels. However these assays would only extend the time to reach BCR, but should not affect the analyses for predictors or the rate of PSA rise.
Fig. 2. Cumulative incidence estimates of BCR (initial PSA ≥0.2 ng/mL and successive PSA ≥0.2 ng/mL) for men with detectable PSA after RP, stratified according to: A: Gleason score; B: Pathological stage; C: Time from RP to first detectable PSA; D: Value of first detectable PSA. Times indicated are months from first detectable PSA. Estimated cumulative incidence of BCR using the competing-risk approach. BCR indicates biochemical recurrence defined as a PSA value ≥0.2 ng/mL and successive PSA ≥0.2 ng/mL. PSA: prostate-specific antigen; RP: radical prostatectomy; BCR: biochemical recurrence. Figure 2A. Cumulative Incidence Estimates of BCR (Initial PSA ≥ 0.2 ng/mL and successive PSA ≥ 0.2 ng/mL) for Men with Detectable PSA after Radical Prostatectomy, stratified according to Gleason Score.
Figure 2B. Cumulative Incidence Estimates of BCR (Initial PSA ≥ 0.2 ng/mL and successive PSA ≥ 0.2 ng/mL) for Men with Detectable PSA after Radical Prostatectomy, stratified according to Pathological Stage
Figure 2C. Cumulative Incidence Estimates of BCR (Initial PSA ≥ 0.2 ng/mL and successive PSA ≥ 0.2 ng/mL) for Men with Detectable PSA after Radical Prostatectomy, stratified according to Time from Radical Prostatectomy to 1st Detectable PSA
Figure 2D. Cumulative Incidence Estimates of BCR (Initial PSA ≥ 0.2 ng/mL and successive PSA ≥ 0.2 ng/mL) for Men with Detectable PSA after Radical Prostatectomy, stratified according to the Value of 1st Detectable PSA. 1.0 pT2, pT3a n=312, BCR at 3y=31.1%
pT3b,pT4 n=58, BCR at 3y=36.9%
Gray’s p-value=0.11
pT3b, pT4 vs. pT2,pT3a, HR=1.61, 95% CI:105–2.47, Wald p-value=0.028 Gleason 6 n=47, BCR at 3y=22.2%
Gleason 7 n=296, BCR at 3y=32.5% Gleason ≥ 6 n=32, BCR at 3y=35.6% Gray’s p-value=0.19
Gleason 7 vs. Gleason 6, HR=1.95, 95% CI:0.96–3.95, Wald p-value=0.065
Duration RP to detec. PSA≤23.6 n=188, BCR at 3y=24.3% Duration RP to detec. PSA>23.6 n=188, BCR at 3y=29.3% Gray’s p-value=0.0065
Continuous: HR=1, 95% CI:1–1.01, Wald p-value=0.17
PSA first detec. post-RP≤0.1 n=273, BCR at 3y=25% PSA first detec. post-RP>0.1 n=103, BCR at 3y=48.7% Gray’s p-value=6.3e-07
Conclusion
Our study reveals that the estimated median time from first detectable PSA to BCR may be long. The absolute values of PSA when first detected and Gleason score at RP were independent predictors of the length of this time frame. Furthermore we provided clinicians with an equation that may help them develop a personalized projection of the rate of PSA rise. This equation, if externally validated in a larger multicentre cohort, may be used to counsel patients with a detectable PSA following RP.
Competing interests: Leonora de Boo, Melania Pintilie, Paul Yip, Jack Baniel, and David Margel declare no competing financial or personal interests. Dr. Fleshner is a member of the Advisory Board for Amgen, Janssen, Astellas and Eli Lily. He has received honoraria from Amgen, Janssen, Astellas and Eli Lily. He is and has participated in clinical trials for Amgen, Janssen, Medivation, OICR, and Prostate Cancer Canada.
This paper has been peer-reviewed.
References
1. Pound CR, Partin AW, Epstein JI, et al. Prostate-specific antigen after anatomic radical retropubic pros-tatectomy: Patterns of recurrence and cancer control. Urol Clin North Am 1997;24:395-406. http:// dx.doi.org/10.1016/S0094-0143(05)70386-4
2. Zincke H, Oesterling JE, Blute ML, et al. Long-term (15 years) results after radical prostatectomy for clinically localized (stage T2c or lower) prostate cancer. J Urol 1994;52:1850-7.
3. Trapasso JG, DeKernion JB, Smith RB, et al. The incidence and significance of detectable levels of serum prostate specific antigen after radical prostatectomy. J Urol 1994;152:1821-5.
4. Catalona WJ, Smith DS. 5-Year tumor recurrence rates after anatomical radical retropubic prostatectomy for prostate cancer. J Urol 1994;152:1837-42.
5. Ohori M, Goad JR, Wheeler TM, et al. Can radical prostatectomy alter the progression of poorly dif-ferentiated prostate cancer? J Urol 1994;152:1843-9. http://jama.jamanetwork.com/article. aspx?articleid=189741
6. Pound CR, Partin AW, Eisenberger MA, et al. Natural history of progression after PSA elevation following radical prostatectomy. JAMA 1999;281:1591-7. http://dx.doi.org/10.1001/jama.281.17.1591 7. Kuriyama M, Wang MC, Lee CI, et al. Use of human prostate-specific antigen in monitoring prostate
cancer. Cancer Res 1981;41:3874-8.
8. Oesterling JE, Chan DW, Epstein JI, et al. Prostate specific antigen in the preoperative and postoperative evaluation of localized prostatic cancer treated with radical prostatectomy. J Urol 1988;139:766-80. 9. Lange PH, Ercole CJ, Lightner DJ, et al. The value of serum prostate specific antigen determinations before
and after radical prostatectomy. J Urol 1989;141:873-7.
10. Thompson IM, Tangen CM, Paradelo J, et al. Adjuvant radiotherapy for pathologically advanced pros-tate cancer: A randomized clinical trial. JAMA 2006;296:2329-35. http://dx.doi.org/10.1001/ jama.296.19.2329
11. Thompson IM, Tangen CM, Paradelo J, et al. Adjuvant radiotherapy for pathological T3N0M0 prostate cancer significantly reduces risk of metastases and improves survival: Long-term follow up of a randomized clinical trial. J Urol 2009;181:956-62. http://dx.doi.org/10.1016/j.juro.2008.11.032 12. Bolla M, van Poppel H, Collette L, et al. Postoperative radiotherapy after radical prostatectomy: A ran-Postoperative radiotherapy after radical prostatectomy: A
ran-domised controlled trial (EORTC trial 22911). Lancet 2005;366:572-8. http://dx.doi.org/10.1016/ S0140-6736(05)67101-2
13. Wiegel T, Bottke D, Steiner U, et al. Phase III postoperative adjuvant radiotherapy after radical prostatec-tomy compared with radical prostatecprostatec-tomy alone in pT3 prostate cancer with postoperative undetectable prostate-specific antigen: ARO 96-02/AUO AP 09/95. J Clin Oncol 2009;27:2924-30. http://dx.doi. org/10.1200/JCO.2008.18.9563
Fig. 3. A: Predicted PSA values stratified by Gleason score are plotted for a patient who had a first detectable PSA at 24 months after surgery and had a prostate volume of 50 g. Here we provide an example of how physicians may use the above mentioned equation and provide a personalized projected slope of PSA rise. In this figure the predicted PSA values stratified by Gleason score are plotted for a patient who had a first detectable PSA at 24 months after surgery and had a prostate volume of 50 g. B: Predicted PSA values stratified by Prostate volume are plotted for a patient who had a first detectable PSA at 24 months after surgery and had a Gleason score of 7. In this figure the predicted PSA values stratified by Prostate volume are plotted for a patient who had a first detectable PSA at 24 months after surgery and had a Gleason score of 7. C: Predicted PSA values stratified by time to first detectable PSA are plotted for a patient who had a Gleason score of 7 and a prostate volume of 50 g. In this figure the predicted PSA values stratified by time to first detectable PSA are plotted for a patient who had a prostate volume of 50 g and had a Gleason score of 7. PSA: prostate-specific antigen.
Pr
edic
ted PSA
0 5 10
Time since PSA detection (months)
15 20 25
Figure 3A: predicted PSA values stratified by Gleason score are plotted for a patient who had a first detectable PSA at 24 months after surgery and had a prostate volume of 50 grams.
Figure 3B: predicted PSA values stratified by Prostate volume are plotted for a patient who had a first detectable PSA at 24 months after surgery and had a Gleason score of 7.
0.35
Time since PSA detection (months)
15 20 25
Figure 3C: predicted PSA values stratified by time to first detectable PSA are plotted for a patient who had a Gleason score of 7 and a prostate volume of 50 grams.
0.35
Time since PSA detection (months)
15 20
RPtoPSA 24m and prostate volume 50g
Gleason 7 and RPtoPSA 24m
14. Stephenson AJ, Bolla M, Briganti A, et al. Postoperative radiation therapy for pathologically advanced prostate cancer after radical prostatectomy. Eur Urol 2012;61:443-51. http://dx.doi.org/10.1016/j. eururo.2011.10.010
15. Elshaikh MA, Ibrahim DR, Stricker H, et al. Adjuvant radiation treatment after prostatectomy. Where do we stand? Can J Urol 2011;18:5592-600.
16. Kibel AS. Treat now or later: the dilemma of postoperative radiotherapy. Eur Urol 2012;61:452-4. http:// dx.doi.org/10.1016/j.eururo.2011.11.044
17. Stephenson AJ, Kattan MW, Eastham JA, et al. Defining biochemical recurrence of prostate cancer after radical prostatectomy: A proposal for a standardized definition. J Clin Oncol 2006;24:3973-8. http:// dx.doi.org/10.1200/JCO.2005.04.0756
18. AmLing CL, Bergstralh EJ, Blute ML, et al. Defining prostate specific antigen progression after radical prostatectomy: What is the most appropriate cut point? J Urol 2001;65:1146-51.
19. Mottet N, Bastian PJ, Bellmunt J, et al. Guidelines on prostate cancer. European Association of Urology, April 2014. http://www.uroweb.org/gls/pdf/09%20Prostate%20Cancer_LRLV2.pdf. Accessed December 18, 2014.
20. Cookson MS, Aus G, Burnett AL, et al. Variation in the definition of biochemical recurrence in patients treated for localized prostate cancer: The American Urological Association Prostate Guidelines for Localized Prostate Cancer Update Panel report and recommendations for a standard in the reporting of surgical outcomes. J Urol 2007;177:540-5. http://dx.doi.org/10.1016/j.juro.2006.10.097
21. Prentice RL, Kalbfleisch JD, Peterson AV, et al. The analysis of failure times in the presence of competing risks. Biometrics 1978;34:541-54. http://dx.doi.org/10.2307/2530374
22. Gray RJ. A class of K-sample tests for comparing the cumulative incidence of a competing risk. Ann Stat
1988;16:1141-54. http://dx.doi.org/10.1214/aos/1176350951
23. Fine JP, Gray RJ. A proportional hazards model for the subdistribution of a competing risk. JASA
1999;94:496-509. http://dx.doi.org/10.1080/01621459.1999.10474144
24. Freedland SJ, Humphreays EB, Mangold LA, et al. Risk of prostate cancer-specific mortality following bio-chemical recurrence after radical prostatectomy. JAMA 2005;294:433-9. http://dx.doi.org/10.1001/ jama.294.4.433
25. Bolla M, van Poppel H, Tombal B, et al. Postoperative radiotherapy after radical prostatectomy for high-risk prostate cancer: Long-term results of a randomised controlled trial (EORTC trial 22911). Lancet
2012;380:2018-27. http://dx.doi.org/10.1016/S0140-6736(12)61253-7
26. Freedland SJ, Isaacs WB, Platz EA, et al. Prostate size and risk of high-grade, advanced prostate can-cer and biochemical progression after radical prostatectomy: A SEARCH database study. J Clin Oncol
2005;23:7546-54. http://dx.doi.org/10.1200/JCO.2005.05.025
27. Davidson DD, Koch MO, Lin H, et al. Does the size matter? Prostate weight does not predict PSA recur-rence after radical prostatectomy. Am J Clin Pathol 2010;133:662-8. http://dx.doi.org/10.1309/ AJCPPHGXDI94SGAC