DEVELOPMENT AND VALIDATION METHOD FOR QUANTITATIVE DETERMINATION OF
CIPROFLOXACIN IN HUMAN PLASMA AND ITS APPLICATION IN BIOEQUIVALENCE TEST
ANGGUN AJI MUKTI
1, FATHUL JANNAH
1, ARIEF NURROCHMAD
2, ENDANG LUKITANINGSIH
3*
1Department of Magister Program, Faculty of Pharmacy, Gadjah Mada University, Indonesia. 2Department of Pharmacology and Toxicology, Faculty of Pharmacy, Gadjah Mada University, Indonesia. 3Department of Pharmaceutical Chemistry, Faculty of Pharmacy, Gadjah Mada
University, Indonesia. Email: [email protected]
Received: 14 Decemer 2015, Revised and Accepted: 13 May 2016
ABSTRACT
Objective: This study aimed to develop and validate an high-performance liquid chromatography method coupled with an ultraviolet detection for determination of ciprofloxacin in spiked human plasma and subsequently used for bioequivalence (BE) study.
Methods: The chromatographic separation was achieved on an RP-C18 column (Lachrom Hitachi, 250×4.6 mm, 5 μm), utilizing a mobile phase of phosphate buffer/acetonitrile (87:13, v/v, pH 3.0±0.1) at a flow rate of 1.5 ml/minutes. Detection is carried out at 276.6 nm using a spectrophotometer. The developed method is statistically validated for the linearity, accuracy, limit of detection (LOD), limit of quantitation, precision, and specificity. The specificity of the method is ascertained by comparing chromatograms of blank plasma and plasma containing ciprofloxacin.
Results: Plasma matrix and ciprofloxacin can be separated very well using the validated method. The LOD and limit of quantification (LOQ) were 0.07 μg/ml and 0.26 μg/ml, respectively. The regression curve of the standard was linear (R>0.999) over a range concentration of 0.01-3.00 μg/ml. The mean recovery of the method ranged between 95.27% and 104.45%. Both intra- and inter-day precision data showed reproducibility (relative standard deviation ≤8.0, n=9). The validated method is successfully applied in pharmacokinetic and BE study of ciprofloxacin tablet in a small number of subjects. The mean values of Cmax, Tmax, area under curve (AUC)(0-12), and AUC(0-∞) for the test (generic) formulation of ciprofloxacin were
2.25±0.29 μg/ml, 1.0 hr, 8.60±0.69 μg/ml/h, and 9.52±0.70 μg/ml/h, respectively. Meanwhile, for the reference formulation (ciproxin tablet), the values were 2.30±0.27 μg/ml, 1.0 hr, 8.54±0.85 μg/ml/h, and 9.38±0.89 μg/ml/h, respectively. From BE study, the 90% confidence intervals for the test formulation/reference formulation ratio for the logarithmic transformations of Cmax, AUC(0-12), and AUC(0-∞) were within the BE limit of 80-125%
(96.08%, 101.00%, and 102.02%, respectively).
Conclusion: According to the validation result, the method was rapid, simple, and reliable. It can be used for routine analysis of ciprofloxacin in human plasma and BE study. The test formulation (tablet “X”) met the regulatory criteria for assuming BE in healthy subjects.
Keywords: Validation, High-performance liquid chromatography, Ciprofloxacin, Plasma, Bioequivalence.
INTRODUCTION
Ciprofloxacin (Fig. 1a) is one of a fluoroquinolone class of antibiotics that are widely used in the treatment of several bacterial infections [1,2]. Ciprofloxacin exhibits a broad spectrum antimicrobial activity against Gram-negative and Gram-positive bacteria [3]. Ciprofloxacin has low toxicity and potential for used as oral therapy in urinary tract as well as skin and soft infections [4].
Ciprofloxacin is rapidly dissolved in the gastrointestinal tract and well absorbed in duodenum and jejunum. Like other fluoroquinolone, it is both metabolized and excreted unchanged in the urine [5,6]. Oral bioavailability is approximately 70%, and a maximum concentration ranging from 1.5 to 2.5 μg/ml is achieved 1-2 hrs after a dose of 500 mg by oral. Area under the serum concentration curve (AUC) range from 6.8 to 12.7 μg/h/ml with an elimination half-life ranging from approximately 3-5 hrs [7].
Various methods have been developed for the determination of ciprofloxacin individually using spectrophotometer [8], spectrofluorometer [9,10], flow injection analysis [11], or high-performance liquid chromatography (HPLC) method that can be found in British Pharmacopeia [12], United States Pharmacopeia [13], and Indonesian Pharmacopeia [14]. In these pharmacopeias, HPLC methods were officially method for the determination of ciprofloxacin as alone. Many applications of HPLC method have been reported in the literature for determination ciprofloxacin in pharmaceuticals preparations [15],
human plasma [6,16], and other biological fluids such as simultaneous analysis of ciprofloxacin and phenazopyridine in solid dosage form using isocratic RP-HPLC that reported Pola and Sankar [17]. In addition, Sachan et al. (2010) have reported simultaneous estimation of ciprofloxacin hydrochloride and ofloxacin by reverse phase-HPLC (RP-HPLC) [18]. Some of HPLC methods that involved the use ion-pair reagent to get better peak shape have been also reported in the literature [19,20].
The current study was devised to develop and validate the HPLC method for ciprofloxacin determination in human plasma. The developed method is expected tobe simpler, faster, and more reliable than previously published methods. Validation will be conducted in accordance with ICH harmonization for validation of analytical procedure ICH Q2 (R1) [21]. The validated method is then applied to quantify ciprofloxacin in healthy volunteers human plasma for pharmacokinetic purposes as well as for bioequivalence studies of a generic tablet found in Indonesia. Bioequivalence (BE) study should be done to prove equality between copy or generic drug to the innovator drug and considered to be inter changeable. This is important to improve the protection of the public from drug products that risk to the health and ensure the quality, efficacy, and safety drugs in the market, specially ciprofloxacin drug [22]. The BE study can be a test of pharmacokinetic, pharmacodynamics test, or comparative clinical trials depend on whether the drugs work systemically or locally. National Agency of Drugs and Foods Controls in Indonesia or BadanPengawasan Obat dan Makanan Indonesia has released guideline for the conduct of
BE study to provide instruction for conducting BE study in accordance with established international standards such as those published by the US Food and Drug Administration (FDA) [23,24] and the European Medicines Agency (EMA) [25,26] as well as ICH harmonization [21]. These guidelines are very important not only for researcher and BE center but also for the evaluators and the pharmaceutical industry [22].
METHODS
Chemical and materials
Ciprofloxacin standard (≥99.0% from Sigma-Aldrich (Dorset, UK), ciprofloxacin generic tablet “X” from Indonesia, ciproxin tablet 500 mg from Bayer. Triethanolamine (TEA), phosphoric acid, and glacial acetic acid are obtained from Merck (Darmstadt, Germany). Methanol and acetonitrile HPLC grade were purchased from Merck (Darmstadt, Germany). Human plasma was from Indonesian Red Cross. HPLC was equipped with ultraviolet (UV)-Vis L-2420, pump L-2130, and Lachrom C18 column (250 mm×4.6 mm; 5 μm) from Hitachi (Japan). Refrigerated centrifuge (Eppendorf), vortex thermolyne 16700 mixer (USA).
Validation of ciprofloxacin analysis in spiked human plasma Preparation of spiked human plasma
Human plasma 300 μl, spiked with 200 μl of the ciprofloxacin solution (10 μg/ml) and 1000 μl acetonitrile. The mixture is centrifuged with the speed of 10.000 rpm for 10 minutes in 4°C. Supernatant is collected and placed in vial. Plasma is rinsed with 1 ml of acetonitrile and centrifuged again; supernatant is collected and added to the vial which contains the result of the first centrifugation. Supernatant is dried until completely dry. A number of 1.0 ml of solvent is added to the dry extract, then vortexed for 30 seconds and filtered using membrane filter which has pore size 0.2 μm. The filtrate is ready to be injected into HPLC instrument.
Determination of the maximum wavelength of ciprofloxacin
Ciprofloxacin solution in concentration of 20 μg/ml is scanned using the UV spectrophotometer at a wavelength range of 200-400 nm. The maximum wavelength is chosen from the spectrum and used for next analysis.
Optimization of flow rate and mobile phase composition
At the beginning of HPLC system optimization, ciprofloxacin is injected into HPLC and eluted using mobile phase that consisted of phosphate buffer solution 20 mM, pH 3.0±0.1 adjusted with TEA:acetonitrile in ratio (15:85 v/v). The flow rate is controlled in 1.0 ml/minute. Mobile phase composition and flow rate are modified until producing a good performance chromatogram. Detection is conducted using UV-detector at the maximum wavelength. All parameters included retention time (Rt), resolution factor (Rs), tailing factor (Tf), the peak area under curve (AUC), the peak height, height equivalent of theoretical plate, and number of theoretical plates (N) are evaluated to decide which HPLC system can be used for routine analysis.
System suitability tests
Ciprofloxacin solution in concentration of 5 μg/ml is injected into HPLC and eluted using the optimal condition. It was replicated 6 times and
calculated relative standard deviation (RSD) of Rt, Rs, AUC, Tf, and N. The parameters evaluated to decide whatever the method is suitable for routine analysis.
Validation of ciprofloxacin determination
Validation method conducted by calculating parameters of validation: Selectivity, linearity, precision, accuracy, limit of detection (LOD), limit of quantification (LOQ), and ruggedness.
The selectivity performed by calculating Rs. The requirement of selectivity parameter is Rs value >2 [27].
Linearity conducted by preparing series concentration of ciprofloxacin standard at the concentration of 0.01, 0.02, 0.05, 0.10, 0.20, 0.50, 1.00, 2.00, and 3.00 (μg/ml). The peak area of each concentration is plotted by concentration to form a linear regression curve. Correlation coefficient (R) and coefficient of determination (R2) as well as % y-intercept are calculated and evaluated according
to acceptance criteria including R≥0.999, R2≥0.997, and % y-intercept
value ≤2.0% [28,29]. The SD of y-intercept is used to measure LOD and LOQ parameters.
Precision performed in three different measurement times by injecting ciprofloxacin that extracted from human plasma for 6 times replication. Then, % RSD was calculated to determine repeatability and reproducibility system. According to AOAC PVM Program, % RSD value for analyte at concentration of 5 μg/ml should be less than 9.36% [30,31].
Accuracy expressed as percentage recovery and determined by standard addition method using three concentration levels which are specific ranges of 80%, 100%, and 120% of the target analyte concentration. Each concentration is injected into HPLC in three times replication. The percentage recovery calculated as the measured value/ theoretical value×100%. The used concentrations of ciprofloxacin in human plasma were 1, 2, and 3 μg/ml. Therefore, % recovery value should be in the range 80-110%, whereas for active substance should be 98-102% [30,31].
Ruggedness performed by preparing human plasma containing ciprofloxacin concentration of 1 μg/ml. Plasma filtrate is then injected into difference HPLC instrument from difference laboratories. The data then analyzed by statistical measurement (t-test) to evaluate the ruggedness of the method.
Application in pharmacokinetic and BE test Study design
The study designed using an open-label, randomized two-way cross over (2 treatments, 2 periods, and 2 sequences) with 7-days washout period between the 2 study arms. Subjects are randomized into two groups. Each subject is assigned a subject number; treatment sequence randomized, and all subjects received the test and reference formulations. The test formulation was generic tablet “X” containing 500 mg ciprofloxacin produced by Indonesian Pharmaceutical Industry. The reference formulation was ciproxin 500 mg (produced by PT. Bayer Indonesia Tbk).
Fig. 1: Structure of ciprofloxacin (a); Ultraviolet spectra of ciprofloxacin (b)
Ethical Clearance (Ref: KE/FK/124/EC; 24 Dec 2013) obtained from Medical and Health Research Ethics Committee, Faculty of Medicine, Gadjah Mada University. This study is conducted in compliance with the principles of the Declaration of Helsinki. Informed consent signed by all of the subjects after the presentation of verbal and written explanations of the study and before initiation of screening procedures.
Subjects
Healthy volunteers are recruited and assessed for inclusion in the study. A medical history is taken including the recording allergies, illnesses, consumption of alcohol, drugs, and also tobacco. Physical examination is conducted before treatment, including measurement of weight, blood pressure, pulse, respiratory, abdominal. Blood samples (10 ml) collected for full blood count, urea and electrolyte, liver function by determining of protein, serum glutamic oxaloacetic transaminase, serum glutamic pyruvic oxoacetic, and bilirubin. Renal function is also tested by determining of ureum, creatinine, and electrolyte. Urine samples are collected for urine-formed elements with microscopic examination analysis, and urinary pregnancy test is conducted for all the female subjects. All of blood and urine analysis are carried out by Pramitha Clinical Laboratory that already received accreditation by the International Organization for Standardization (Standard No. 15189 and 9001).
Inclusion and exclusion criteria
Subjects were healthy volunteers between the ages of 18 and 55 years that have a body mass index between 18 and 25 kg/m2. They had
passed all screening parameters included physical examination, liver function tests, hemogram, hepatitis B, HIV, and urine analysis. Subjects have no history of allergic responses to ciprofloxacin, a history of drugs alcohol abuse, significant diseases or disorders of liver, cardiovascular, respiratory and kidney or gastrointestinal. Female subjects were not under pregnancy and menstruation during the study. Women who were breastfeeding were also ineligible. All subjects have to sign an informed consent before treatment during the research.
Admission and procedures
Subjects are admitted to the “Rumah Sakit Akademik” Hospital of Gadjah Mada University 1 day before the study. The explanations about the nature and risk of the study are given, and subjects then signed informed consent forms for participation in the study. No other medications or outside foods are permitted. No foods are allowed at least 12 hrs before dosing.
Formulations are given to subjects after 12 hrs fasting and then given 200 ml of water. A light breakfast and lunch are provided after 2 and 6 hrs, respectively. According to the schedule of administration, half subjects received test formulation (tablet “X”) and half others subjects received reference formulation (ciproxin tablet). After a washout period of 7 days, the subjects received formulations that different from at first period.
Collection of blood samples
Venous blood samples (3-5 ml) collected in the heparinized tube using wing needle intravenous at 0 hr (shortly before consumption of drug) 0.25, 0.5, 1, 2, 3, 5, 7, 10, and 12 hrs after digestion drugs. After collection, blood samples are immediately centrifuged at 8.000 rpm for 10 minutes. Plasma is separated and placed in vials in duplicate and stored at −80°C until analyzed using HPLC.
Bioanalytical work and statistical analysis
Ciprofloxacin concentration in plasma measured using optimum preparation and HPLC method resulted from validation procedure.
All pharmacokinetic parameters determined by non-compartmental analysis using Pharmacokinetic Functions for Microsoft Excel software. Cmax and Tmax are directly read from the concentration-time plots.
Elimination rate constant calculated from the linear regression line of the elimination phase.
BE assessment for Cmax, AUC0-12, and AUC0-∞are calculated by parametric
analysis using paired t-test as well as two-way ANOVA by two-one-sided test at 90% confidence interval (CI). The test formulation (tablet “X”) is considered bioequivalent to the standard formulation (ciproxin tablet) if it passes the requirement of 80-125% at CI of 90% for both statistical tests.
RESULTS AND DISCUSSION
From optimization of procedure analysis, the optimum wavelength of ciprofloxacin was 276.6 nm as displayed in Fig. 1b, whereas Table 1 showed the start conditioning of HPLC for ciprofloxacin analysis. Maximum wavelength found in this study was very close to the maximum wavelength in previously publication [32]. Tables 2 and 3 showed the optimization data for flow rate and composition of mobile phase, respectively.
Based on the optimization data (Table 3), the chromatographic condition option 5 is chosen for ciprofloxacin assay in plasma samples for BE study. The optimum condition of HPLC for ciprofloxacin analysis can be summarized as follows in Table 4, while the chromatogram can be found in Fig. 2.
Fig. 2 showed that the Rt of ciprofloxacin was 7.18 minutes, whereas for levofloxacin (as internal standard) was 6.17 minutes. Rt of ciprofloxacin was less than 10 minutes and shorter than previously publications from Vybiralova et al. (2005) and Locatelly et al. (2015). They stated that the Rts were 14 minutes [33] and 9.19 minutes [34]. Chromatogram Fig. 2 displayed that ciprofloxacin can be perfectly separated from plasma endogenous matrix and internal standard. Plate number and Tf were, respectively, N≥2000 and Tf≤2 that were in agreement with acceptance criteria from Snyder et al. [27].
Table 5 displayed parameters of suitability test that meets with validation requirements. Therefore, the optimum HPLC system can be used as routine analysis method for quantification ciprofloxacin in human plasma.
The selectivity parameter (Rs) of ciprofloxacin was 3.4. Based on the Fig. 2, both peak ciprofloxacin and levofloxacin showed that the peaks were symmetric, homogeneous, and there were no co-eluting peaks. It was indicating that the method has high selectivity and can be applied for routine analysis. In addition, the method has a good linearity in the range of 0.01 to 3.00 μg/ml with coefficient of correlation (R) 0.9997, coefficient of determination (R2) 0.9995, and regression equation
Y=101675X−1377.2. The linear regression of calibration curve can be seen in Fig. 3.
Repeatability test is conducted to describe the precision parameter. The precision of method evaluated by performing six replicate analyses of the samples through the complete analytical procedure from sample preparation to the final step. In this case, ciprofloxacin 2 μg/ml (in human plasma) extracted using acetonitrile and subsequently injected into HPLC. Measurement is repeated on three different days and calculated the % RSD. Intermediate precision evaluated by comparing the assays on three different days using different analyst. Acceptance criteria according to AOAC PVM Program was %RSD≤10.59% [30,31]. All of RSD values are in agreement with
Table 1: Starting HPLC condition for ciprofloxacin analysis
Stationary phase Lachrom Hitachi C18, 250 mm×4.6 mm, 5 μm Mobile phase Phosphate buffer solution 20 mM,
SD/B and LOQ=10 SD/B. The results from this research were 0.07 and 0.26 μg/ml for LOD and LOQ, respectively. LOD value obtained in this study is smaller than 1.44 μg/ml the value from Pola et al. (2015) [17]. Therefore, the validated method was more sensitive than the previously method.
Table 2: Result of the flow rate optimization using mixture of phosphate buffer at pH 3±0.1: Acetonitrile (87:13, v/v) Flow rate
(ml/menit)
Retention time (menit)
Theoretical plate number (N)
Tailing factor (Tf)
Height of equivalent of theoretical plate/HETP (mm)
Peak area (miliarea unit)
Note
1 12.58 11460 1.34 0.002182 6273454
1.5 7.19 12979 1.31 0.001926 6404905 Optimum
2 2.48 4453 2.54 0.005614 3416720
HETP: Height equivalent of theoretical plate
Table 3: Result of optimization of mobile phase composition (phosphate buffer at pH 3±0.1 and acetonitrile) with a flow rate of 1.5 ml/minute
Option Mobile phase composition (phosphate buffer: acetonitrile)
Retention time (menit)
Theoretical plate number (N)
Tf HETP
(mm)
Peak area (miliarea unit)
1 80:20 2.89 4546 1.95 0.0055 5192543
2 83:17 3.57 6632 1.79 0.0037 5868978
3 85:15 4.92 8847 1.63 0.0028 5835432
4 86:14 5.55 9864 1.52 0.0025 5781028
5 87:13 7.19 11460 1.31 0.0022 5915811
Note: Option 5 was the optimum condition. Tf: Tailing factor, HETP: Height of theoretical plate
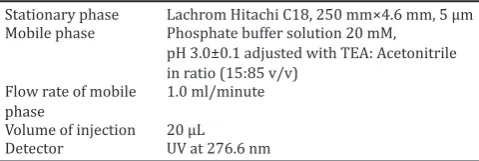
Table 4: Optimum condition of HPLC for ciprofloxacin in human plasma analysis
Stationary phase Lachrom Hitachi C18, 250 mm×4.6 mm, 5 μm
Mobile phase Phosphate buffer solution 20 mM, pH 3.0±0.1 adjusted with TEA: Acetonitrile in ratio (13:87 v/v)
Flow rate of mobile phase
1.5 ml/minute
Volume of injection 20 μL
Detector UV at 276.6 nm
HPLC: High-performance liquid chromatography
Table 5: Parameters of suitability test of ciprofloxacin analysis using HPLC
Parameters Acceptance
criteria
Replication Mean RSD (%)
1 2 3 4 5 6
Retention time (menit) RSD≤1 7.23 7.29 7.24 7.28 7.27 7.29 7.27 0.23 Peak area RSD≤2 191256 176754 196320 189431 195635 188152 189591 1.95 Tailing factor ≤2 1.22 1.22 1.15 1.16 1.20 1.18 1.19 2.52 Theoretical plate number (N) >6000 10824 11520 10737 11535 10461 11358 11071 4.11
HPLC: High-performance liquid chromatography, RSD: Relative standard deviation
Table 6: Repeatability parameter of ciprofloxacin analysis using HPLC
Day-1 Day-2 Day-3 Note
μg/ml RSD (%) μg/ml RSD (%) μg/ml RSD (%)
1.92 1.14 1.91 1.28 1.85 0.79 Repeatability
Mean=1.89±0.05 Reproducibility (inter-day precision) RSD=2.04%
HPLC: High-performance liquid chromatography, RSD: Relative standard deviation
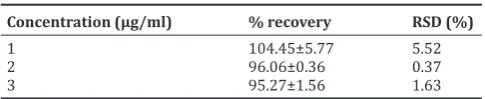
Table 7: Accuracy parameter of ciprofloxacin in human plasma analysis
Concentration (μg/ml) % recovery RSD (%)
1 104.45±5.77 5.52
2 96.06±0.36 0.37
3 95.27±1.56 1.63
RSD: Relative standard deviation
validation requirement, so this method can be concluded has a good repeatability (Table 6).
To ensure the accuracy and reliability of the method, the recovery study is carried out by adding a known quantity of standard into the sample and then analyzed by the proposed method. Accuracy was measured at three different concentrations. Recovery of analysis calculated by dividing the found concentration with the known concentration that added into the sample. According to the result displayed in Table 7, HPLC method has good accuracy that in line with the requirement of AOAC PVM Program (% recovery with analyte concentration of 1-10 μg/ml should be in 80-110%).
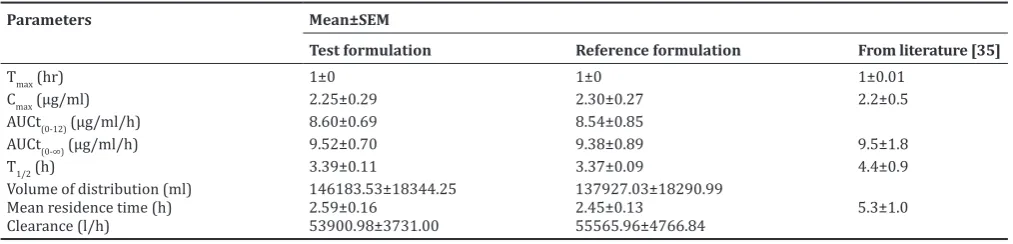
Using validated method from this study, plasma samples from all healthy volunteers are measured to know the pharmacokinetic profile both of tablet “X” (as test formulation) and tablet ciproxin (as reference formulation). Mean concentration-time profile of ciprofloxacin is presented in Fig. 4. The pharmacokinetic parameters of ciprofloxacin, such as AUC, Cmax, and Tmax obtained from all subjects, are given in Table 9. As evident from Fig. 4 and Table 9, ciprofloxacin is rapidly absorbed with Tmax of 1 hr. Other pharmacokinetic parameters of tablet “X” were similar with the parameters of reference tablet. In this study, we also compared these parameters with the results published by Wagenlehner et al. (2006) [35]. From the comparison, we can conclude that there are no difference parameters between the result of this study and Wagenlehner’s publication.
Table 10 showed the 90% CIs and the mean ratio of the test-to-reference formulation for log10 Cmax, AUC0-12, and AUC0-∞. In this study, the 90% CI for the test formulation/reference Formulation ratio for both log10 Cmax and log10 AUC0-∞ were within the BE limit of 80% to 125% (96.08% and
102.02%, respectively). Therefore, the test and reference formulations met the regulatory of FDA, EMA, and Nation Agency for Drug and Food Controls in Indonesia. The test and reference formulations appeared to be bioequivalent.
CONCLUSION
1. HPLC condition for cipro loxacin analysis consisted of Lachrom Hitachi C18 (250 mm×4.6 mm, 5 μm) as the stationary phase, while as mobile phase was a mixture of phosphate buffer solution 20 mM, pH of 3.0±0.1 that adjusted with TEA:acetonitrile in ratio (13:87 v/v), low rate of 1.5 ml/minutes, and detected using UV detector at wavelength of 276.6 nm.
2. The validated method successfully applied in pharmacokinetic and BE study of cipro loxacin tablet in small number of subjects. The mean values of Cmax, Tmax, AUC(0-12), and AUC(o-∞) for the test formulation of cipro loxacin were 2.25±0.29 μg/ml, 1.0 hr, 8.60±0.69 μg/ ml/h, and 9.52±0.70 μg/ml/h, respectively. Meanwhile, for the reference formulation, the values were 2.30±0.27 μg/ml, 1.0 hr, 8.54±0.85 μg/ml/h, and 9.38±0.89 μg/ml/h, respectively. From BE
Fig. 2: Chromatogram of ciprofloxacin in human plasma matrix detected using high-performance liquid chromatography with the
optimum condition as mentioned in Table 4.
Table 8: Result of ruggedness test of ciprofloxacin method by using HPLC
Result (μg/ml) from Significance (P) Conclusion
UGM Laboratory BPOM Laboratory
0.9875 0.9235 0,1776 There are no significant differences between result from UGM Laboratory and BPOM Laboratory 1.0128 0.9491
1.0154 0.9199 0.9234 0.9544 0.9848±0.0428 0.9367±0.0175
UGM Laboratory is Laboratory in Gadjah Mada University. BPOM Laboratory is Laboratory in National Agency of Drugs and Food Controls in Indonesia. BPOM: Badan Pengawasan Obat dan Makanan, HPLC: High-performance liquid chromatography
Table 10: 90% CIs for the mean ratio of the test formulation to reference formulations for Cmax, AUC0-12, and AUC0-∞ for
ciprofloxacin
Parameters 90% CI Test/reference ratio (%)
Log10 Cmax 74.08-124.60 96.08
Log10 AUC(0-12) 83.53-122.14 101.00 Log10 AUC(0-∞) 86.07-120.92 102.02
CI: Confidence interval, Log10: Logarithmic transformation, test formulation: Tablet “X” containing ciprofloxacin 500 mg, reference formulation: Trademark ciproxin tablet 500 mg
The result of ruggedness test (Table 8) showed that this method was rugged. When the method is applied for ciprofloxacin analysis in two difference laboratories with difference time, person, and equipment, there are no statistically significant differences in results from both laboratories.
Table 9: Pharmacokinetic parameters for ciprofloxacin after administration of test formulation (tablet “X”) and reference formulation to healthy subjects
Parameters Mean±SEM
Test formulation Reference formulation From literature [35]
Tmax (hr) 1±0 1±0 1±0.01
Cmax (μg/ml) 2.25±0.29 2.30±0.27 2.2±0.5
AUCt(0-12) (μg/ml/h) 8.60±0.69 8.54±0.85
AUCt(0-∞) (μg/ml/h) 9.52±0.70 9.38±0.89 9.5±1.8
T1/2 (h) 3.39±0.11 3.37±0.09 4.4±0.9
Volume of distribution (ml) 146183.53±18344.25 137927.03±18290.99
Mean residence time (h) 2.59±0.16 2.45±0.13 5.3±1.0 Clearance (l/h) 53900.98±3731.00 55565.96±4766.84
study, the 90% CIs for the test formulation/reference formulation ratio for the logarithmic transformations of Cmax, AUC(0-12), and AUC(0-∞) were 75.08-124.60%, 83.53-122.14%, and 86.07-120.92%, respectively. According to the BE test guidelines of the European Commission-EMA, FDA and National Agency for Drug and Food Controls in Indonesia, it can be concluded that the test formulation (tablet “X”) met the regulatory criteria for assuming BE in these healthy subjects.
ACKNOWLEDGMENT
This study was supported by “Magister Program, Faculty of Pharmacy, Gadjah Mada University through “Research Grant for Thesis: UGM/FA/1969/M/05/01” awarded to Dr.rer.nat. Endang Lukitaningsih.
REFERENCES
1. Ball P. Quinolone generations: Natural hist ory or natural selection? J Antimicrob Chemother 2000;46 Suppl T1:17-24.
2. Oliphant CM, Green GM. Quinolones: A comprehensive review. Am Fam Physician 2002;65(3):455-64.
3. Katzung BG. Basicand Clinical Pharmacology, Pharmacokinetics & Pharmacodynamics: Rational Dosing & The Time Course of Drug Action. 9th ed. New York: McGraw-Hill Medical; 2004.
4. Amini M, Khanavi M, Shafiee A. Simple high-performance liquid chromatographic method for determination of ciprofloxacin in human plasma. Iran J Pharm Res 2004;2:99-101.
5. Molinaro M, Corona G, Fiorito V, Spreafico S, Bartoli AN, Zoia C. Bioavailability of two different oral formulations of ciprofloxacin in healthy subjects. Drug Res 1997;47(II):1406-10.
6. Noman AM, Kadi H. High performance liquid chromatography assay with UV detection for determination of ciprofloxacin in human plasma. Greener J Phys Sci 2012;2(1):020-6.
7. Mandell GL, Pertri WA. Penicillins, cephalosporins and other β-lactam, antibiotics. In: Goodman & Gilman’s - The Pharmacological Basis of Therapeutics. 11th ed. New York: McGraw-Hill; 1996. p. 1073.
8. Manorajan S, Venkateshwarlu G, Mahesh S, Patro SK, Kirankumar B, Saidulu D. Stability indicating UV-spectrophotometer determination of
Fig. 4: Mean±standard deviation concentration of ciprofloxacin in human plasma versus time after consuming a single oral dose of ciprofloxacin 500 mg. Tablet “X” was a test formulation and
ciproxin 500 mg used as reference tablet
Fig. 3: Standard curve of ciprofloxacin in human plasma matrix detected by high-performance liquid chromatography
ciprofloxacin dosage forms. Int J Pharm Chem Res 2012;2(1):1-8. 9. Sarr SO, Ndiaye SM, Fall D, Diedhiou A, Diop A, Ndiaye B. Development
and validation of a simple and economical spectrofluorometric method for estimation of ciprofloxacin in pharmaceutical dosage forms. Int J Bio Anal Chem 2013;3(3):72-7.
10. Karunasree A, Thejomoorthy K, Jaffer M, Reddy YP, Ramalinga P. In vitro protein binding study of cipro floxac in by new UV-Spectrophotometric method. Int J PharmTech Res 2010;2(2):1150-4. 11. Turkey SN, Khudhair AF. Determination of ciprofloxacin HCl in
pharmaceutical formulation by continuous flow injection analysis via turbidimetric (T180°) and scattered light effct at two opposite position (2N 90°) using ayah 4Sw-3D-T180-2N90-Solar CFI analyser. J Kerbala Univ 2013;11(4):153-69.
12. British Pharmacopoeia Commission. British Pharmacopoeia. Vol. III. London, England: Stationery Office; 2014.
13. United States Pharmacopeia and National Formulary. USP-30 NF-25. Asian Edition. Rockville, MD: United States Pharmacopeial Convention; 2007.
14. Indonesian Pharmacopoeia Commission. Indonesian Pharmacopoeia. 4th ed. Jakarta: Health Ministry of Republic Indonesian; 1995.
15. Qureshi MN, Rahman IU, Marwat GA. Comparative analysis of ciprofloxacinin different pharmaceutical products by high performance liquid chromatograph. Sci Tech Dev 2012;31(1):69-73.
16. Khan KM, Khan FM. Extraction and separation of cipro floxacin by HPLC from human plasma. Int Chem Pharm Med J 2005;2:267-70. 17. Pola LM, Sankar DG. Novel isocratic reverse phase high performance
liquid chromatography method development and validation for simultaneous estimation of ciprofloxacin and phenazopyridine in solid dosage form. Int J Pharm Pharm Sci 2015;7(4):355-61.
18. Sachan N, Chandra P, Saraf SK, Gupta RC. Novelbmethod for simultaneouses timation ofciprofloxacinhydrochlorideandofloxacin by reverse phase-high performance liquid chromatography (RP-HPLC). Int J Pharm Sci Res 2010;1(7):100-7.
19. Manceau J, Gicquel M, Laurentie M, Sanders P. Simultaneous determination of enrofloxacin and ciprofloxacin in animal biological fluids by high-performance liquid chromatography. Application in pharmacokinetic studies in pig and rabbit. J Chromatogr B Biomed Sci Appl 1999;726(1-2):175-84.
20. Al-Dgither S, Alvi SN, Hammami MM. Development and validation of an HPLC method for the determination of gatifloxacin stability in human plasma. J Pharm Biomed Anal 2006;41:251-5.
21. International Conference on Harmonization. Validation of Analytical Procedure Methodology ICH Q2 (R1); 2005.
22. National Agency of Drugs and Foods Controls in Indonesia. Methodology Guidelinesfor Bioequivalence Study of Specific Active Substances. Jakarta: Badan Pengawas Obat dan Makanan RI: 2012. 23. Food and Drug Administration. Guidance for Industry: Bioanalytical
Method Validation, Department of Health and Human Services. United States of America; 2001.
24. US Department of Health and Human Services, (HHS), Food and Drug Administration (FDA), Center for Drug Evaluation and Research (CDER). Guidance for Industry. Bioavailability and Bioequivalence Studies for Orally Administrered Drug Products-General Considerations; 2003. Available from: http://www.fda.gov/ downloads/Drugs/GuidanceComplianceRegulatoryInformation/ Guidance/ucm070124.pdf. [Last accessed on 2015 Nov 23].
25. The European Agency for the Evaluation of Medicinal Products (CPMP). Note for Guidance on the Investigation of Bioavailability and Bioequivalence. Available from: http://www.apps.who.int/ prequal/info_applicants/BE/emea_bioequiv.pdf. [Last accessed on 2015 Nov 23].
26. The European Medicines Agency. Guideline for Good Clinical Practice E6(R2). Available from: http://www.ema.europa.eu/docs/en_GB/ document_library/Scientific_guideline/2015/08/WC500191488.pdf. [Last accessed on 2015 Dec 12].
27. Snyder LR, Kirkland JJ, Dolan JW. Introduction to Modern Liquid Chromatography. 3th ed. United States of America: John Wiley & Sons,
Inc., Publication; 2010.
28. Ahuja S, Dong MW. Handbook of Pharmaceutical Analysis by HPLCSeparation Science and Technology. 1st ed. Amsterdam: Elsevier;
2005.
29. Chan CC, Lam H, Lee YC, Zang XM. Analytical Method Validation and Instrument Performance Verification.Canada: John Wiley & Sons, Inc.; 2004. p. 16-24.
31. González AG, Herrador MA, Asuero AG. Intra-laboratory assessment of method accuracy (trueness and precision) by using validation standards. Talanta 2010;82(5):1995-8.
32. Vella J, Busuttil F, Bartolo NS, Sammut C, Ferrito V, Serracino-Inglott A, et al. Asimple HPLC-UV method for the determination of ciprofloxacin in human plasma. J Chromatogr B Analyt Technol Biomed Life Sci 2015;989:80-5.
33. Vybíralová Z, Nobilis M, Zoulova J, Kvetina J, Petr P. High-performance liquid chromatographic determination of ciprofloxacin in plasma samples. J Pharm Biomed Anal 2005;37(5):851-8.
34. Locatelli M, Ciavarella MT, Paolino D, Celia C, Fiscarelli E, Ricciotti G, et al. Determination of ciprofloxacin and levofloxacin in human sputum collected from cystic fibrosis patients using microextraction by packed sorbent-high performance liquid chromatography photodiode array detector. J Chromatogr A 2015;1419:58-66.