ASSESSMENT OF ADVERSE DRUG REACTIONS OCCURRING AT DEPARTMENT OF NEUROLOGY
OF A TERTIARY CARE HOSPITAL IN INDIA
JENNIFER R GRACE
1, ANNA K SAINA
1, MAHESWARI E
2*, SRINIVASA R
3, VISWAM SUBEESH
21Department of Pharmacy Practice, M. S. Ramaiah College of Pharmacy, Bengaluru, Karnataka, India. 2Department of Pharmacy Practice, Faculty of Pharmacy, M. S. Ramaiah University of Applied Sciences, Bengaluru, Karnataka, India. 3Department of Neurology, M. S. Ramaiah
Medical College and Hospitals, Bengaluru, Karnataka, India. Email: maheswarieswar@gmail.com
Received: 26 June 2018, Revised and Accepted: 12 July 2018
ABSTRACT
Objective: The purpose of this study was to assess the incidence and pattern of adverse drug reactions (ADRs) reported from the department of neurology of a tertiary care hospital in Karnataka, India.
Methods: It is a hospital-based prospective, observational study, conducted among the inpatients of all age groups of either sex for a period of 6 months. ADRs were reported by the clinical pharmacists and physicians of this hospital. ADRs obtained were categorized based on its causality, severity, preventability, predictability, and outcomes. Binary logistic regression was carried out to identify the predictors of ADR and Kaplan–Meier analysis was performed for survival analysis.
Results: Atotal of 250 patients were enrolled for the study in which 108 (43%) patients were presented with at least one ADR and a total of 212 ADRs were observed. The highest rate of ADRs was observed with antiepileptics 61 (29.5%). The most commonly reported ADRs were skin reactions 23 (10.8%). Causality was assessed using three different scales which showed that most of the ADRs were probable. Severity, preventability, and predictability were assessed, of which 125 (59%) ADRs were moderate, 192 (90.6%) ADRs were probably preventable, and 156 (73.6%) ADRs were predictable, respectively. The outcomes showed that 150 (70.1%) patients recovered from the reactions. Predictors such as polypharmacy and duration of stay were found to be significant.
Conclusion: The study concluded that the prevalence of ADRs in the department of neurology is high. Thus, early detection and management of ADRs are essential to avoid further complications of the reaction.
Keywords: Adverse drug reactions, Neurology, Causality, Severity, Predictability, Preventability, Polypharmacy.
INTRODUCTION
Clinical evolution of medications is a convoluted procedure which consumes both resources and time. During the diverse periods of clinical trials, the medications are tried for its transient safety and efficacy on a set number of deliberately chosen people. After the medication is affirmed for utilization by overall population, post-marketing surveillance helps to recognize the new adverse drug reactions (ADRs) related to the utilization of various medicated formulations [1]. An ADR is defined as “any response to a drug that is noxious and unintended, and that occurs at doses normally used in man for the prophylaxis, diagnosis, or therapy of disease, or for the modifications of physiological function” [2]. Monitoring of ADRs helps to evaluate the effectiveness and risk of medications, empower safe and rational use of drugs and enhance general patient care and well-being. The cost of ADRs in the community is high, and under-reporting of ADRs by health experts is a globally perceived issue. ADR identification and reporting may prevent the occurrence of ADRs and drug-related problems (DRPs) in future [1].
The patient may experience ADRs with single or multiple drugs as anticipated or may show up instantly, on continued use, even after cessation of therapy. Although ADRs influence all age groups, yet the most usually influenced ones are geriatrics and pediatrics. Geriatrics experience ADRs due to comorbid diseases, polypharmacy, altered pharmacokinetic, and pharmacodynamic changes which enhance hospital admissions. Pediatrics particularly neonates experience ADRs due to immature organ development and instabilities in pharmacokinetics and pharmacodynamics [2,3]. Administration of drugs acting on the central nervous system (CNS) during pregnancy may
manifest potential teratogenic impacts on the fetus. Consumption of phenytoin increases the proportion of malformations such as orofacial clefts, cardiovascular deformities, and seizures. Medications such as carbamazepine, levetiracetam, and lorazepam can reach the fetus through breast milk and can harm them [4]. Hepatic and renal impairment with comorbidities, genetic polymorphisms, and medications with a narrow therapeutic index may demonstrate high occurrences of ADR.
Drugs acting on the CNS such as antiepileptic, antipsychotic, and anxiolytic contribute to ADRs such as extrapyramidal symptoms, insomnia, sedation, and even serious effects such as increasing suicidal tendency and depression [5]. Studies have showed that the patients in neurology department experience 23.5% of ADRs [6]. The ADRs transpire due to particular idiosyncratic mechanisms or harmful metabolic items which may lead to initial treatment failure [7]. ADRs can influence the consistence and course of treatment in patients exposed to drug therapy. The effect of ADRs can be determined based on cessation of therapy, treatment failure or due to an adverse event [8].
An active pharmacovigilance program is the need of the hour in all hospitals especially in Indian setup, as ADRs cause a significant burden to the patients and also to the economy. This project is aimed to work in this regard to monitor, detect, assess, and disseminate the ADRs which ensures patient safety and minimizes the cost of health care. Detection and monitoring of ADR in the inpatient department of neurology is lacking in Indian literature. The objectives of the study were to compare the incidence and pattern of ADRs, to detect and assess the causality, preventability, predictability, and severity of ADRs, to evaluate the management of ADR and to document and report the detected ADR. © 2018 The Authors. Published by Innovare Academic Sciences Pvt Ltd. This is an open access article under the CC BY license (http://creativecommons. org/licenses/by/4. 0/) DOI: http://dx.doi.org/10.22159/ajpcr.2018.v11i10.27737
Thus, the current study improves the knowledge and pattern of ADRs in patients with neurological diseases.
METHODS
A hospital-based prospective, observational study was conducted among the inpatients of Department of Neurology of Ramaiah Memorial Hospital, Bengaluru, Karnataka for over a period of 6 months, from November 2016 to April 2017. Patients diagnosed with neurologic disorders and treated with one or more neurological agents were included in the study and screened for ADRs, irrespective of the neurologic diagnosis while samples with inadequate data and patients not willing to participate in the study were excluded. The ADRs that were identified and reported by clinical pharmacists and physicians were recorded. The data obtained include patient demographic details, relevant history, general and systemic examination, laboratory investigations, diagnosis, treatment, description and nature of reaction, date and time of onset of reaction, suspected drugs, severity, treatment offered, and outcomes. Permission from Institutional Ethical Committee of Ramaiah Medical College was obtained before instigation of the study.
The degree of association of drug and the adverse reaction is determined using three different scales, namely Naranjo’s algorithm, World Health Organization (WHO) causality assessment scale, and Karch and Lasagna’s causality assessment scale. Naranjo’s algorithm involves a set of questionnaires, to each of which score has been provided ranging
from −1 to +2. The total score for a particular drug-ADR combination is calculated, and if it is ˃9 it is categorized as definite, 5–8 as probable, 1–4 as possible, and ˂1 as unlikely. WHO causality assessment scale and Karch
and Lasagna’s causality assessment scale are also used to determine causality. Modified Hartwig and Siegel severity assessment scales are used to determine the severity of the suspected ADRs. Severity of a reaction was determined based on the classification systems of the WHO and system of Hartwig et al. The severity of a reaction was classified as Mild, Moderate, and Severe which, in turn, is categorized into different levels of which Level 1 and 2 is categorized as Mild, Level 3, 4a, and 4b is categorized as Moderate, and Level 5, 6, and 7 is categorized as Severe. Mild reactions will be resolved over a period of time with or without an antidote and without extending the period of hospital stay. Moderate reactions are those which require specific treatment and hospitalizations for at least 1 day. Serious ADRs were considered as life-threatening leading to disability and required prolonged hospitalization usually in intensive care units. Preventability is measured using Modified Schumock and Thornton Preventability assessment scale. In this scale, it is categorized as definitely preventable, probably preventable, and not preventable based on a set of questions. Predictability of an ADR was done utilizing the Council of International Organization for Medical Sciences based on the incidence of the reactions reported in the available literature and the previous history of the reactions to the suspected drug under study [9].
Statistical analysis
Binary logistic regression was performed to identify the predictors contributing to the occurrence of ADR. Age, gender, the presence of comorbidities, route of administration, duration of stay, polypharmacy, diseases, and drugs were considered as the independent variable.
p≤0.05 was considered as statistically significant. We compared the
survival function of the subjects (occurrence of ADR) with respect to polypharmacy by plotting the Kaplan–Meier (KM) graph. Mantel–Cox statistics was performed for the comparison of KM components.
RESULTS
Percentage of occurrence of ADRs
In our study, a total of 250 patients were enrolled and of which, 108 patients (43%) were presented with at least one ADR (Fig. 1).
Gender and age distribution based on ADR occurrence
The male and female patients with or without ADRs were assessed. Of 78 females admitted 36 (46.2%) were found to have at least one ADR and of 172 males, 72 (41.9%) were found to have ADR (Fig. 2). Patients of all age groups were included in the study. Among patients between 0 and 19 years, 5 (50%) patients showed a higher incidence of ADR followed by geriatrics in which 52 (48%) of 107 experienced ADR (Table 1).
Correlation of occurrence of ADRs with comorbidities
Comparing patients with and without comorbidities, patients with comorbidities were found to have more ADRs 77(71.3%) when compared to patients without comorbidities 31 (28.7%) (Table 2).
Correlation of occurrence of ADRs with number of drugs prescribed More number of ADRs were seen in patients with polypharmacy (˃5
drugs). 95(54%) patients experienced ADRs (Table 3).
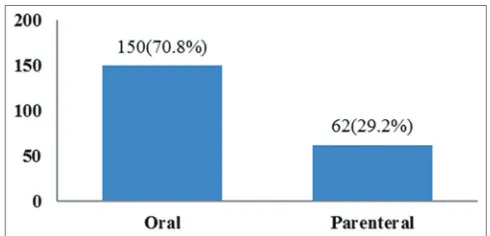
Route of administration of suspected drugs
In our study, ADRs were commonly observed in orally administered drugs when compared to parenteral drugs (Fig. 3).
Correlation of occurrence of ADR with duration of stay
Correlation of occurrence of ADR with duration of stay was assessed, and the study revealed that occurrence of ADR prolonged the length of hospital stay (Table 4).
Correlation of occurrence of ADR with time
Delayed ADRs (>24 h) were found to be more when compared to rapid ADRs (within 24 h) (Fig. 4).
Occurrence of ADRs in neurological disorders
Patients diagnosed with epilepsy showed a higher percentage of incidences of ADRs when compared to other neurological disorders (Table 5).
Drug combinations involved in the pharmacokinetic and pharmacodynamic interaction
In the current study, 19 ADRs occurred due to pharmacokinetic and pharmacodynamic interactions, among which 11 reactions were due to pharmacodynamic interactions and 5 were due to pharmacokinetic interactions. The summary of the drug combinations involved in pharmacokinetic and pharmacodynamics is shown in Table 6.
Fig. 1: Percentage of occurrence of adverse drug reactions
Table 1: Age distribution in patients with or without ADR
ADR n (%)
0–19 years 20–39 years 40–59 years >60 years
Patients with ADR 5 (50) 19 (33.9) 32 (41.6) 52 (48.6)
Patients without ADR 5 (50) 37 (66.1) 45 (58.4) 55 (51.4)
Total number of patients 10 (100) 56 (100) 77 (100) 107 (100)
Category of drugs based on ADR occurrence
Among the 212 ADRs observed, the highest rate of ADRs was observed in antiepileptics 61 (29.5%) followed by antihypertensives 27 (13%), anticoagulants 19 (9.2%), antibiotics 15 (7.2%), and antidiabetics 11 (5.3%) (Table 7).
Among the commonly prescribed antiepileptics, levetiracetam 19 (31.2%) was found to cause more number of ADRs followed by phenytoin 13 (21.3%), carbamazepine 8 (13.1%), gabapentin 6 (9.9%), and oxcarbazepine 5 (8.2%) (Table 8).
Analysis of ADRs based on the system
The organ system most commonly affected by ADRs were found to be gastrointestinal (GI) system 43 (20.3%) followed by CNS 42 (19.8%) and dermatological system 23 (10.8%). The findings of the study showed that the most commonly reported ADR was found to be skin reactions 23 (10.8%) followed by constipation 18 (8.5%), giddiness 16 (7.5%), hyponatremia 13 (6.1%), tachycardia 11 (5.2%), hypokalemia 10 (4.7%), and headache 10 (4.7%) (Table 9).
Treatment of ADR
All the reactions were managed appropriately in our study. In 94 reactions, either the suspected drug was withdrawn, and changes in
doses were made, and in 111 reactions, specific antidote or treatment was given for the ADR. Continuous monitoring was done in 52 reactions to prevent the worsening of ADR (Fig. 5).
Assessment of ADR
The causality of ADR was assessed using three different scales, namely Naranjo’s Causality assessment scale, WHO causality assessment scale, and Karch and Lasagna’s causality assessment scale. Naranjo’s Causality assessment scale indicated that 149 (70.3%) ADRs were “probable” and 63 (29.7%) ADRs were “possible.” WHO causality assessment scale inferred that 142 (67%) ADRs were “probable,” 64 (30.2%) ADRs were “possible,” and 6 (2.8%) ADRs were “unlikely.” Karch and Lasagna’s Causality scale showed that 145 (68%) of the ADRs were probable followed by possible (Fig. 6). The severity of the reported reactions was assessed using Modified Hartwig and Siegel Severity Assessment Scale which showed that 125 (59%) of the ADRs were categorized as moderate, 87 (41%) as mild, and none of the ADRs were found to be severe. In moderate reactions, Level 3 contributed to the highest percentage 93 (43.9%) (Fig. 7). The study revealed that 192 (90.6%) of the ADRs were “probable preventable” followed by “not preventable” 16 (7.5%) and “definitely preventable”
Table 2: Correlation of occurrence of ADRs with comorbidities
Comorbidities n (%)
Patients with
ADR Patients without ADR
With comorbidities 77 (71.3) 82 (57.7) Without comorbidities 31 (28.7) 60 (42.3)
Total 108 (100) 142 (100)
ADR: Adverse drug reactions
Table 3: Correlation of occurrence of ADRs with number of drugs prescribed
Number of drugs per
prescription n (%)2–3 drugs 4–5 drugs ˃5 drugs
Patients with ADR 3 (15) 10 (18.5) 95 (54) Patients without ADR 17 (85) 44 (81.5) 81 (46) Total 20 (100) 54 (100) 176 (100) ADR: Adverse drug reactions
Table 4: Correlation of occurrence of ADRs with duration of stay Duration of stay (days) n (%)
≤10 days ˃10 days
Patients with ADR 60 (33.1) 48 (69.6) Patients without ADR 121 (66.9) 21 (30.4)
Total 181 (100) 69 (100)
ADR: Adverse drug reactions
Table 5: Occurrence of ADRs in neurological disorders
Diseases n (%)
Patients
with ADR Patients without ADR Total
Stroke 64 (43) 85 (57) 149 (100) Epilepsy 18 (51.4) 17 (48.6) 35 (100) Parkinson’s disease 4 (44.4) 5 (55.6) 9 (100) Meningitis 8 (80) 2 (20) 10 (100) Headache 1 (10) 9 (90) 10 (100) Others 14 (37.8) 23 (62.2) 37 (100) ADR: Adverse drug reactions
Fig. 2: Gender distribution based on adverse drug reactions occurrence
Fig. 3: Route of administration of suspected drugs
4 (1.9%) using Schumock and Thornton Preventability Assessment Scale (Fig. 8). The study suggests that majority of the ADRs were “predictable” 156 (73.6%) when assessed by predictability scale (Fig. 9).
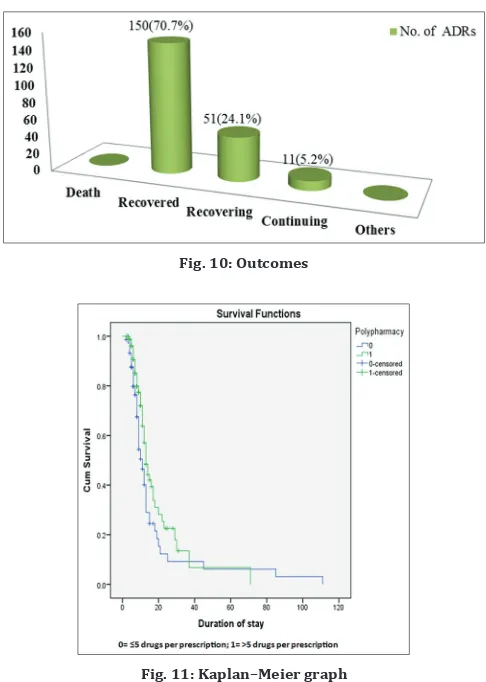
Outcomes
The outcomes of the suspected reactions were studied, and the results showed that 150 (70.1%), of our study subjects recovered from the reactions whereas 51 (24.1%) are still under recovery and 11 (5.2%) of reactions were continuing. 5.2% of the reactions were estimated to be continuing of which 6 (54.5%) reactions were mild and 5 (45.5%) reactions were moderate (Fig. 10).
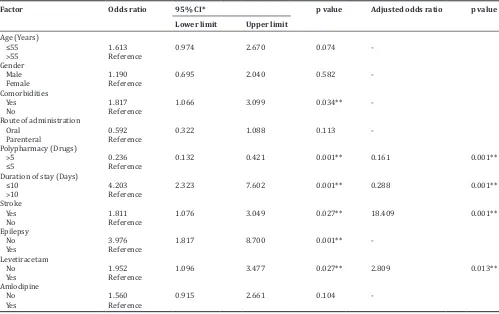
Predictors of ADR
Binary logistic regression was analyzed (Table 10) and the predictors contributing to the occurrence of ADR was evaluated. Age, gender, presence of comorbidities, route of administration, duration of stay, polypharmacy, diseases, and drugs are the contributing factors. In this
Table 6: Drug combinations involved in pharmacokinetic and pharmacodynamics interaction
Drug combination Interaction effect Mechanism of interaction Frequency
Enoxaparin+Clopidogrel+Aspirin Hemorrhage PD (Synergism) 2
Enoxaparin+Aspirin Hemorrhage PD (Synergism) 1
Glycopyrrolate+Ipratropium bromide Anticholinergic effects PD (Synergism) 2
Amantadine+Trihexyphenidyl Anticholinergic effects PD (Synergism) 2
Metoprolol+Telmisartan Hyperkalemia PD (Synergism) 1
Haloperidol+Ondansetron ECG changes PD (Synergism) 1
Nebivolol+Olmesartan+Hydrochlorothiazide Hypotension PD (Synergism) 1
Insulin+Metformin Hypoglycemia PD (Synergism) 1
Insulin+Telmisartan Hypoglycemia Unknown mechanism 1
Carbamazepine+Levetiracetam Ataxia Unknown mechanism 1
Carbamazepine+Levetiracetam Dizziness Unknown mechanism 1
Phenytoin+Clobazam Ataxia PK (metabolism) 2
Phenytoin+Clobazam Nystagmus PK (metabolism) 1
Phenytoin+Metronidazole Dizziness PK (metabolism) 1
Phenytoin+Clopidogrel Nystagmus PK (metabolism) 1
Table 7: Category of drugs based on ADR occurrence
Category: Suspected drugs n (%)
Antiepileptics (N03A): Phenytoin, Levetiracetam, Carbamazepine, Pregabalin, Oxcarbazepine, Clonazepam, Topiramate, Gabapentin,
and Sodium valproate 61 (29.5)
Antibiotics (R02AB): Piperacillin+Tazobactam, Ceftriaxone, Linezolid, Ceftazidime, Meropenem, Tigecycline, and Cefuroxime 15 (7.2) Antihypertensives (C02): Clonidine, Amlodipine, Metoprolol, Ramipril, Minoxidil, Mannitol, Telmisartan, Nebivolol, Losartan,
Hydrochlorothiazide, Olmesartan, Furosemide, and Atenolol 27 (13) Anticholinergics (R03BB): Tolterodine, Trihexyphenidyl, and Glycopyrrolate 10 (1.9) Antidiabetics (A10): Insulin, Metformin, Glimepiride, and Sitagliptin 11 (5.3)
Skeletal muscle relaxants (M03): Baclofen 1 (0.5)
Analgesics (N02): Tramadol 5 (2.4)
Lipid-modifying agents (C10): Atorvastatin 2 (1)
Adrenergics, Inhalants (R03A): Salbutamol and Ipratropium bromide 5 (2.4)
Hemorrhagic cystitis inhibitor (R05CB): Mesna 5 (2.4)
Proton Pump Inhibitors (A02BC): Pantoprazole and Esomeprazole 3 (1.4)
Antiemetics (A04A): Ondansetron 6 (2.9)
Antineoplastics (L01): Rituximab 2 (1)
Vasopressin antagonists (C03XA): Tolvaptan 3 (1.4)
Corticosteroids for systemic use (H02): Betamethasone, Methyl prednisolone, and Dexamethasone 10 (4.8)
Cardiac glycoside (C01A): Digoxin 1 (0.5)
Antiarrhythmics (C01B): Amiodarone 1 (0.5)
Antigout preparations (M04A): Febuxostat 2 (1)
Anesthetics, general (N01A): Propofol 1 (0.5)
Thyroid Hormones (H03AA): Levothyroxine 1 (0.5)
Antiarrhythmics (C01B): Amiodarone 1 (0.5)
Antigout preparations (M04A): Febuxostat 2 (1)
Iron preparations (B03A): Elemental Iron 1 (0.5)
Antithrombotics agents (B01A): Dalteparin, Enoxaparin, Alteplase, Aspirin, Nicoumalone, Clopidogrel, and Cilostazol 19 (9.2) Antipsychotics (N05A): Lithium, Quetiapine, and Haloperidol 5 (2.4)
Antifungals for systemic use (D01B): Voriconazole 1 (0.5)
Vitamins (A11): Vitamin B 1 (0.5)
Anesthetics, general (N01A): Propofol 1 (0.5)
Thyroid Hormones (H03AA): Levothyroxine 1 (0.5)
Antidepressants (N06A): Duloxetine and Venlafaxine 5 (2.4)
Antiparkinson drugs (N04): Carbidopa, Levodopa, and Entacapone 1 (0.5) Antihistamines for systemic use (R06): Hydroxyzine and Chlorpheniramine 2 (1)
Total 207 (100)
study, association was observed in patients with polypharmacy (odds ratio - 0.236, 95% confidence interval [CI] 0.132-0.421, p=0.001), duration of stay (odds ratio - 4.203, 95% CI 2.323–7.602, p=0.001), in diseases such as stroke (odds ratio - 1.811, 95% CI 1.076–3.049,
p=0.027) and epilepsy (odds ratio - 3.976, 95% CI 1.817–8.700, p=0.001) in patients using levetiracetam (odds ratio - 1.952, 95% CI 1.096-3.477, p=0.027) and with comorbidities (odds ratio - 1.817, 95% CI 1.066-3.099, p=0.034). Association was not observed in age, gender, and route of administration.
KM analysis
We compared the survival function of the subjects with respect to polypharmacy by plotting the KM graph. The KM graph displays the cumulative survival function on a linear scale by polypharmacy. The survival curve of no polypharmacy (labeled as “0”) was lower than that of with polypharmacy (labeled as “1”), which means that no polypharmacy has a higher probability of surviving (not experiencing an event, ADR) than polypharmacy (logrank statistics, p=0.23) (Table 11 and Fig. 11).
DISCUSSION
The current study is a hospital-based prospective and observational study conducted among the inpatients of department of neurology. Of the 250 patients reviewed, 108 (43%) patients experienced at least one ADR. Among which 106 (98.1%) patients experienced ADR during their hospital stay and 2 (1.9%) patients were admitted due to the occurrence of ADRs. Our study showed an increase in the incidence of ADRs during the period of hospitalization which is in concordance with Nirojini et al., which stated that of total 295 patients, 157 patients experienced ADR during hospitalization [5].
In our study, a total of 172 male patients and 78 female patients were followed up of which 72 (41.9%) male patients and 36 (46.2%) female patients were presented with ADRs. Women were found to be affected with more number of ADRs when compared to men. This may be due to pharmacokinetic, pharmacodynamic, and hormonal changes in women. This finding is in agreement with Vijayakumar and Dhanaraju on the description of ADRs in a multi-specialty teaching hospital (2013) which expressed that more reports were observed
Fig. 6: Causality assessment scales
Fig. 7: Modified Hartwig and Siegel severity scale
Fig. 8: Schumock and Thornton preventability scale
Fig. 9: Predictability scale
Table 8: Occurrence of ADR in Antiepileptics
Antiepileptics n (%)
Levetiracetam 19 (31.2)
Phenytoin 13 (21.3)
Carbamazepine 8 (13.1)
Gabapentin 6 (9.9)
Oxcarbazepine 5 (8.2)
Sodium Valproate 3 (4.9)
Fosphenytoin 3 (4.9)
Pregabalin 2 (3.3)
Topiramate 1 (1.6)
Clonazepam 1 (1.6)
Total 61 (100)
in females (53.6%) compared to males (46.4%) [6]. Adolescents and geriatrics were most commonly affected with ADRs as observed in
our study. This observation is contrary with the study of Palanisamy
et al., on assessment, monitoring and reporting of ADRs in Indian hospital (2011) [10], where patients in the age group of 41–60 years (53.33%) contributed to the highest percentage of ADRs. Patients with comorbidities were found to have more ADRs when compared to patients without comorbidities 77 (71.3%). Maximum number of ADRs were seen in patients with polypharmacy which is in accordance with Ahmed et al. (2014) [11]. In our study, ADRs are commonly seen with orally administered drugs and delayed reactions were found to be more
Table 9: Organ system classification of ADRs
System involved: Reactions n (%)
Gastrointestinal system disorders (0600): Loose stools (8), Constipation (18), Nausea and Vomiting (8), Gastric ulcer (1), Weight
loss (1), Abdominal pain (2), and Dry mouth (5) 43 (20.3)
Central and peripheral nervous system disorders (0410): Giddiness, Somnolence, Dizziness (16), Ataxia (8), Seizure (3),
Headache (10), Fever (2) Neuroleptic Malignant Syndrome (NMS) (1), Slurred speech (1), and Insomnia (1) 42 (19.8) Metabolic and nutritional disorders (0800): Hyponatremia (13), Hypokalemia (10), Hyperkalemia (2), Edema (9), Hypocalcemia (1),
and Lactic acidosis (1) 36 (17)
Skin and appendages disorders (0100): Drug Reaction Eosinophilia and Systemic Symptoms (DRESS) (1), Rash (14), Xerosis (4),
Erythema (4) 23 (10.8)
Heart rate and rhythm disorders (1030): Atrial fibrillation (1), Tachycardia with palpitations (11), ECG changes (2), and
Bradycardia (1) 15 (7.1)
Red blood cell disorders (1210): Hemorrhage (7) and Anemia (7) 14 (6.6) Vision disorders (0431): Conjunctivitis (2), Nystagmus (7), and Ptosis (3) 12 (5.7)
Respiratory system disorders (1100): Cough (6) 6 (2.8)
Platelet, bleeding and clotting disorders (1230): Thrombocytopenia (3) and Thrombocytosis (1) 4 (1.9) Cardiovascular system disorders, general (1010): Hypotension (2) and Hypertension (2) 4 (1.9) Endocrine disorders (0900): Hyperglycemia (1), Hypoglycemia (2), and Cushings syndrome (1) 4 (1.9) Liver and biliary system disorders (0700): Hepatic injury (3) 3 (1.4) Urinary system disorders (1300): Renal damage (2) and Urinary Tract Infection (UTI) (1) 3 (1.4) Reproductive disorders, male (1410): Erectile dysfunction (2) 2 (0.9) Musculoskeletal system disorders (0200): Rhabdomyolysis (1) 1 (0.5)
Total (100) 212 (100)
ADR: Adverse drug reactions
Table 10: Binary logistic regression result of predictors associated with ADR
Factor Odds ratio 95% CI* p value Adjusted odds ratio p value
Lower limit Upper limit
Age (Years)
≤55 1.613 0.974 2.670 0.074
-˃55 Reference
Gender
Male 1.190 0.695 2.040 0.582
-Female Reference
Comorbidities
Yes 1.817 1.066 3.099 0.034**
-No Reference
Route of administration
Oral 0.592 0.322 1.088 0.113
-Parenteral Reference Polypharmacy (Drugs)
˃5 0.236 0.132 0.421 0.001** 0.161 0.001**
≤5 Reference
Duration of stay (Days)
≤10 4.203 2.323 7.602 0.001** 0.288 0.001**
˃10 Reference
Stroke
Yes 1.811 1.076 3.049 0.027** 18.409 0.001**
No Reference
Epilepsy
No 3.976 1.817 8.700 0.001**
-Yes Reference
Levetiracetam
No 1.952 1.096 3.477 0.027** 2.809 0.013**
Yes Reference
Amlodipine
No 1.560 0.915 2.661 0.104
-Yes Reference
*CI: Confidence interval, **Significance at 0.05
Table 11: Test of equality of survival distributions for the different levels of polypharmacy
Chi‑square df Sig.
which is in concordance with Lucca et al. The study finalized that the occurrence of ADR prolongs the length of hospital stay. 19 interaction-led ADRs were observed among which 11 were pharmacodynamic and 5 were pharmacokinetic which is in par with Lucca et al., which stated that 27 (18.9%) reactions were pharmacokinetic and 98 (68.9%) reactions were pharmacodynamic [12].
The organ system most commonly affected by ADRs were found to be GI system 43 (20.3%) followed by CNS 42 (19.8%) which is in contrary with the study conducted by Nirojini et al. which observed that CNS (37.18%) was most commonly affected followed by GI (14.07%) [5]. The most commonly reported ADR was found to be skin reactions 23 (10.8%) followed by constipation 18 (8.5%) which is on par with the study conducted by Vijaykumar et al. [6].
Patients diagnosed with epilepsy showed a higher incidence of ADR when compared to other neurological disorders. The highest rate of ADRs was recorded to be induced by AEDs 61 (29.5%) followed by antihypertensives 27 (13%) which is in conformity with Thuermann
et al., on detection of ADRs in a neurological department [13]. Among the antiepileptics, levetiracetam 19 (31.2%) was found to cause more number of ADRs in contrary with Ramakrishna, on collection, detection, assessment, monitoring, and prevention of ADRs of antiepileptic drugs (2014) which inferred that phenytoin (44.7%) caused more number of ADRs [7]. According to the literature, most of the antiepileptic drugs have a narrow therapeutic index, therefore, therapeutic drug monitoring has to be employed to ensure safe and effective treatment. Monotherapy and regular follow-up of patients on antiepileptics should be considered to prevent the adverse reactions and to improve the patient’s compliance with drug therapy.
Among the total ADRs observed, 94 ADRs were managed either by withdrawing the suspected drug or by increasing or reducing the dose. Specific treatment along with or without a suitable antidote
was given for 111 ADRs, to prevent further deterioration of reactions. This is contradictory to the study conducted by Vijayakumar et al. [14] which was conducted in intensive care and cardiac care units, where withdrawal of the drug was commonly initiated to manage the ADRs. In our study, administering an antidote or a specific treatment was the commonly adopted method. Abrupt cessation of the neurotropic drugs is not recommended as they lead to withdrawal complications; thus, dose has to be tapered slowly before it is withdrawn completely. Specific drug therapy has to be administered immediately on the appearance of an adverse reaction and/or an alternative can be prescribed.
Causality assessment scale showed that most of the ADRs were probably followed by possible. This study is in congruence with the study conducted by Singh et al., which illustrated that 36.36% were probably followed by possible with 31.16% [15]. The severity of the reported reactions was analyzed, and accordingly, 15 (59%) ADRs were categorized as moderate, 87 (41%) ADRs as mild and none of the ADRs were found to be severe. These findings were similar to the results of the study on Palanisamy et al. which confirmed that the majority of ADRs were moderate (58.33%) followed by mild (35%) [10]. The preventability assessment scale by Schumock and Thornton revealed that 192 (90.6%) ADRs were “probable preventable” followed by 16 (7.5%) “not preventable” and 4 (1.9%) “definitely preventable.” Majority of the ADRs were “predictable” 156 (73.6%) as assessed by predictability scale. This study is similar to the study which is conducted by Raut et al., which proved that 45% of ADRs were “probably preventable” and 69% were “predictable” [16].
The outcomes of the suspected reactions showed that 156 (70.1%) study subjects recovered from the reactions. Severity and outcomes were correlated, most of the mild reactions showed faster recovery when compared to moderate reactions which were still under recovery. 11 (5.2%) reactions were estimated to be continuing of which 6 (54.5%) reactions were mild and 5(45.5%) reactions were moderate. These findings are in accordance with Vijayakumar and Dhanaraju where 77% recovered from reactions [6]. The early detection and management of adverse reactions can reduce health and economic burden on patients, and it also improves patients adherence and enhances health surveillance [17-19].
CONCLUSION
The study concludes that the prevalence of ADRs in the department of neurology is high. The literatures also support to this aspect, due to comorbidities and multiple drug regimens. Thus, early detection and management of ADRs are essential to avoid further progression of the reaction and its associated complications. Special attention should be provided to the patients who are at a higher risk of developing adverse reactions. Educational programs by clinical pharmacists will considerably reduce the complications thereby enhancing patient’s adherence to the drug therapy in achieving better therapeutic outcomes. Future studies can be conducted for a longer period of time in both inpatients and outpatients to compare the pattern of ADRs. Prescribing pattern and other DRP could be studied to improve the safety profile.
ACKNOWLEDGMENT
We express our sincere gratitude to Dr. V. Madhavan, Professor, and Head, Department of Pharmacognosy, Faculty of Pharmacy, MSRUAS, for giving us an opportunity and for providing us all guidance and support.
AUTHOR’S CONTRIBUTIONS
Grace Jennifer Raju and Saina Anna Kurian: Data management, reporting, interpretation of results. E Maheswari: Developing an idea for the study, planning methodology, taking the responsibility for the implementation of the study. R Srinivasa: Providing guidance during the course of the study. Viswam Subeesh: Statistical analysis and interpretation of data.
Fig. 10: Outcomes
CONFLICTS OF INTEREST
There are no conflicts of interest.
REFERENCES
1. Rohilla A, Singh N, Kumar V, Kumar M, Sharma AD, Kushnoor A. Pharmacovigilance: Needs and objectives. J Adv Pharm Edu Res 2012;2:201-5.
2. Parthasarathi G, Olsson S. Adverse drug reactions. In: Parthasarathi G, Nyfort-Hansen K, Nahata MC, editors. A Textbook of Clinical Pharmacy Practice: Essential Concepts and Skills. 1st ed. Chennai: Orient Longman PVT Ltd; 2004. p. 84-102.
3. Alam K, Shakya R, Ojha P. Reporting adverse drug reactions among hospitalized medical patients: A prospective study from tertiary care hospital in Western Nepal. Nepal J Epidemiol 2014;4:330-6.
4. Law R, Bozzo P, Koren G, Einarson A. FDA pregnancy risk categories and the CPS: Do they help or are they a hindrance? Can Fam Physician 2010;56:239-41.
5. Nirojini PS, Yemineni R, Nadenla RR. Monitoring and reporting of adverse drug reactions in a South Indian tertiary care hospital. Int J Pharm Sci Rev Res 2014;24:259-62.
6. Vijayakumar TM, Dhanaraju MD. Description of adverse drug reactions in a multi-speciality teaching hospital. Int J Integr Med 2013;1:1-6. 7. Ramakrishna P. Collection, detection, assessment, monitoring and
prevention of adverse drug reactions of antiepileptic drugs. Int Res J Pharm 2014;5:653-7.
8. Singh G. Do no harm-but first we need to know more: The case of adverse drug reactions with antiepileptic drugs. Neurol India 2011;59:53-8.
9. Patel NH, Padhiyar J, Shah YB, Dixit RK. Study of causality, preventability and severity of cutaneous adverse drug reactions in a tertiary care institute. GCSMC J Med Sci 2015;4:24-7.
10. Palanisamy S, Kumaran KS, Rajasekaran A. A study on assessment,
monitoring and reporting of adverse drug reactions in Indian hospital. Asian J Pharm Clin Res 2011;4:112-6.
11. Ahmed B, Nanji K, Mujeeb R, Patel MJ. Effects of polypharmacy on adverse drug reactions among geriatric outpatients at a tertiary care hospital in Karachi: A prospective cohort study. PLoS One 2014;9:e112133.
12. Lucca JM, Ramesh M, Ram D, Kishor M. Incidence and predictors of adverse drug reactions caused by drug-drug interactions in psychiatric patients: An empirical study. Trop J Med Res 2016;19:29.
13. Thuermann PA, Windecker R, Steffen J, Schaefer M, Tenter U, Reese E,
et al. Detection of adverse drug reactions in a neurological department:
Comparison between intensified surveillance and a computer-assisted approach. Drug Saf 2002;25:713-24.
14. Pal AB, Prusty SK, Sahu PK, Swain T. Drug utilization pattern of antiepileptic drugs: A pharmacoepidemiologic and pharmacovigilance study in a tertiary teaching hospital in India. Asian J Pharm Clin Res 2011;4:96-9.
15. Kumar BN, Nayak K, Singh H, Dulhani N, Singh P, Tewari P. A pharmacovigilance study in medicine department of tertiary care hospital in Chattisgarh (Jagdalpur), India. J Young Pharm 2010;2:95-100. 16. Raut AL, Patel P, Patel C, Pawar A. Preventability, predictability and
seriousness of adverse drug reactions amongst medicine inpatients in a teaching hospital: A prospective observational study. Int J Pharm Chem Sci 2012;1:1293-8.
17. Antony A, Joel JJ, Shetty J, Umar NF. Identification and analysis of adverse drug reactions associated with cancer chemotherapy in hospitalized patients. Headache. Int J Pharm Pharm Sci 2016;6:3-7. 18. Kumar L. Pharmacovigilance/reporting adverse drug reactions: An
approach to enhance health surveillance and extending market share by minimizing the chances of drug withdrawals. Int J Pharm Pharm Sci 2015;7:1-7.