R E S E A R C H
Open Access
A resource block organization strategy for
scheduling in carrier aggregated systems
Guillermo Galaviz
1,2*, David H Covarrubias
1, Angel G Andrade
2and Salvador Villarreal
1Abstract
Carrier aggregation (CA) is a promising technology that will allow IMT-Advanced system candidates to achieve spectrum bandwidths of up to 100 MHz using available system resource blocks (RB), even if these are fragmented. Implementation of CA functionality is managed through the use of schedulers capable of assigning multiple RBs to a user. When each available RB is handled individually, the delay from assigning multiple RBs to each user can affect the quality of service (QoS). In this article we develop an efficient scheduling strategy to reduce spectrum resource assignment delay in systems that make use of CA. This strategy is based on ana-prioryorganization of available RBs in sets. Two different RB Organization Algorithms are compared. In order to evaluate the performance of the proposed strategy numerical simulation was performed using a Round Robin scheduler for the downlink of a macro-cellular environment. Results show that using the proposed strategy it is possible to reduce the delay required to assign resources to users without affecting the downlink user capacity when compared to block by block scheduling strategies proposed in literature. The benefits of using the proposed strategy are discussed as well as improvement opportunities.
1 Introduction
Wireless cellular communication systems have been part of our everyday life for more than 30 years. Currently, wireless cellular systems are evolving from voice oriented solutions into broadband wireless access sys-tems. Recent developments of next generation wireless cellular systems in the IMT Advanced initiative specify a 1Gbps downlink data rate for static users and 100 Mbps for high mobility users. In order to achieve such high data rates in a wireless system, spectrum efficiency has become a physical layer design priority. Technology developments such as MIMO-OFDM together with high order modulation schemes and efficient error correcting codes, allow for a spectrum efficiency of up to 15bps/Hz [1]. However, even with such high spectrum efficiency (achieved only under optimum channel conditions) there is a large requirement of spectrum bandwidth. For the 1Gbps transfer rate and a spectrum efficiency of 15bps/Hz, approximately 67 MHz of bandwidth would be required by one user during enough time to com-plete a data transfer.
Current versions of broadband wireless systems make use of channel bandwidths of up to 20 MHz [2]. There-fore, a different spectrum management scheme is required for next generation wireless systems in order to provide the required bandwidth. Due to the fragmen-tation of the spectrum bands for next generation broad-band wireless cellular systems, the expected growth of broadband wireless users, and the large bandwidths required to provide high data rate services [3], the spec-trum available is considered to be scarce and fragmented.
Carrier aggregation (CA) has been defined as an enabling technology to overcome the spectrum scarcity and fragmentation problem. CA allows a system to aggregate multiple spectrum resources (resource blocks or RBs) and assign them to a single user in order to provide the sufficient bandwidth for a given service. CA works by allowing the system to assign RBs that may or may not be contiguous and considering the possibility that they are in different frequency bands. This derives in three different types of CA [4]:
•Contiguous CA: Aggregation of contiguous RBs
within the same frequency band. * Correspondence: [email protected]
1
Department of Electronics and Communications, CICESE Research Center, Ensenada, Mexico
Full list of author information is available at the end of the article
• Non-contiguous intra-band CA: Aggregation of non-contiguous RBs available within the same fre-quency band.
• Non-contiguous inter-band CA: Aggregation of
non-contiguous RBs available in different frequency bands.
In order to implement CA spectrum assignment to a single user, a scheduler with multiple RB assignment capabilities is required by the system. In general, the task of the scheduler will be to optimize resource usage in a feasible amount of time. Resource usage can be measured as the throughput handled by the network. However, due to the quality of service (QoS) that has to be offered, it has to be possible to every user to make use of the available resources regardless of the achiev-able throughput. This characteristic is referred to as fair-ness. From the network perspective, there will always be a tradeoff between throughput and fairness.
Some of the scheduling proposals for CA systems available in literature involve an adaptation of algo-rithms used in non-CA systems, such as Proportional Fair and Processor Sharing. The way they provide CA capabilities is by scheduling each available RB individu-ally. When all the resources required by a user are scheduled, the user has enough resources (bandwidth) to be serviced. Proposals in [5-7] deal with CA schedul-ing usschedul-ing this strategy, which we refer to as Block by Block Scheduling. A different strategy is presented in [8], where a water filling algorithm is used to provide CA capabilities. A novel approach for CA is presented in [9], where a technique called separated burst-level scheduling (SBLS) is implemented using a two level scheduler structure.
Since the number of RBs required by next generation wireless cellular systems can be quite large, the time required by a scheduler to assign all the resources needed by a user can become considerably high if RBs are handled individually. This will yield in a potentially excessive delay of the scheduling tasks. This operation time will actually depend on the organization of the spectrum resources that the scheduler can handle. Delay is an important aspect that has to be considered within IMT-Advanced system candidates. In order to fulfill the QoS goals of high data rates, low latency and high user capacity for demanding applications such as high defini-tion real time video an achievable user plane packet delay of 2 ms is defined [1]. This packet delay involves the time epoch at which a packet arrives at the schedu-ler queue until it is completely transmitted in an unloaded system. Achieving this goal involves an improvement of several subsystems. One important component of the packet delay comes from the schedul-ing process. Efficient schedulschedul-ing of available resources is
typically characterized by higher delays, while simple scheduling algorithms usually waste system resources. Given the delay restrictions established for IMT-Advanced system candidates such as LTE-IMT-Advanced, it is important to consider the delay when designing sche-dulers with CA capabilities.
In this article we present a scheduling strategy based on the assignment of pre-organized RB sets. We will refer to this strategy as Set Scheduling. The main idea behind Set Scheduling was presented in [10] together with preliminary results. In this article, Set Scheduling is further analyzed and evaluated in a macro-cellular envir-onment in order to fully understand its potential in reducing delay due to resource assignment when com-pared to Block by Block Scheduling. In order to evaluate Set Scheduling, two different algorithms for organizing RBs in sets are evaluated. Results obtained through the evaluation of Set Scheduling in a macrocellular environ-ment show that it is possible to reduce scheduling delay due to resource assignment by up to four times and to obtain a user capacity improvement of up to 5% when compared to a Block by Block Scheduling strategy. We will also discuss how it provides a more efficient use of available resources as compared to [8]. Considering that packet delay involves the scheduling process, packet fragmentation and reconstruction (when using CA), sig-naling and physical layer processes, an improvement in the delay caused by any of these processes will even-tually impact packet delay. Therefore, depending on the delay contribution of each process, the achieved reduc-tion in scheduling delay using our proposal may have an important impact in packet delay.
The article is organized as follows: Section 2 presents the scenario and the parameters used for evaluation; Section 3 presents the proposed scheduling strategy, together with the RB organization algorithm; Section 4 shows the delay and throughput analysis for the evalua-tion scenario and the simulaevalua-tion results; Secevalua-tion 5 pre-sents our conclusions.
2 Scenario and evaluation parameters
2.1 Scenario
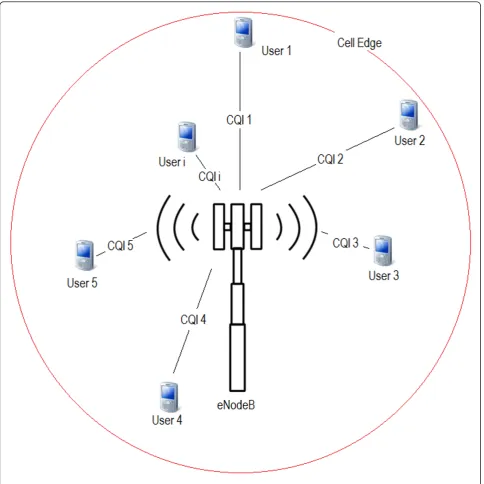
For evaluation, we consider a single cell scenario in a macrocellular urban environment. Figure 1 shows this scenario. Users are uniformly distributed within the base station’s (eNodeB) coverage area. Although a uniform user distribution does not fit the general case in practi-cal environments, for a densely populated macrocellular urban scenario it is widely used in literature such as [11]. A uniform user distribution is adequate for algo-rithm evaluation in this type of scenario when a uniform user density is used.
specifies a data rate Rbui and by a file size Sbui for the
i-th user. Each request is also associated with a chan-nel quality indicator (CQI) report. The CQI will deter-mine the achievable data rate and the amount of data that can be transported from a RB. Therefore the requested data rate will eventually define the band-width required by the user (number of required RBs), while the file size will define the number of packets needed to be transmitted (time slots) for a given CQI value.
frequency of the RB, a value of“1” indicates that the RB is available while a value of“0” indicates that the RB is not available.
The achievable data rate per RB is variable, and
depends on the CQI of user i on CC l. In order to
obtain the CQI, the signal to noise ratio (SNR) to CQI mapping presented in [12] was used. This mapping is represented by Equation (1).
CQI = 0.5250 * SNR dB + 4.5. (1)
where SNRdB is the user SNR in dB. As presented in [12], this mapping guarantees decodability of the trans-mitted information with a block error rate (BLER) of at most 10%. Our evaluation considers that requests are from slow moving or fixed users, therefore the CQI is maintained until the transmission of data is completed. For illustration purposes our simulations are based on a single cell multi-user scenario. Interference is not taken into account.
An SNR estimation is required to calculate the CQI. In order to obtain the SNR for each user, we considered the path loss (PL) and thermal noise. The PL was obtained using the ITU-R macrocellular urban NLOS scenario defined in [13] shown in Equation (2).
PL = 161.04−7.1∗log 10(W) + 7.5∗log 10(h)
The parameters for Equation (2) and the values used are taken as the default in [13] and are as follows: PL is the PL in dB, W is the street width (20 m), h is the average building height (20 m), hbsis the base station height (25 m),hutis the user terminal height (1.5 m), d
is the distance between user terminal and base station (variable with user position) andfcis the operating fre-quency in GHz (2.3 and 3.4 GHz).
A thermal noise power spectral density of -174 dBm/ Hz was considered in order to calculate de SNR per user. The 2.3 GHz and 3.4 GHz frequency bands were used with equal transmission power. The transmission power of eNodeB was adjusted in order to have a mini-mum CQI of 5 at the cell edge in the 2.3 GHz fre-quency band. Since both bands transmit at the same power, a lower CQI is expected in the 3.4 GHz band for a given user.
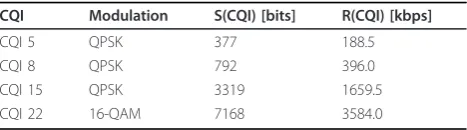
The data rates associated to CQI values presented in Table 1 are taken from [14]. In Table 1, S(CQI) repre-sents the transport block size, which defines the amount of data that can be transmitted per RB given a CQI
value. R(CQI) represents the achievable bit rate for a specific CQI value.
The total number of RBs required by user i, Ni, is such that:
Ni+ki−1
j=1+ki−1
R(CQI)j≥Rbui. (3)
where the termki-1represents the index of the last RB assigned to the previous user.
The restriction in Equation (3) guarantees that the sum rate of the assigned RBs is at least equal to the data rate required by a user. For a given user i, Ni is upper bounded by
Nbui = Rbui
R(CQI)l. (4)
where Nbui is the upper bound on the number of
RBs required by user i when all assigned RBs have an equal and the lowest achievable CQI, termed R(CQI)l. In the same way, the lower bound on Nican be repre-sented as:
Nbli= Rbui
R(CQI)h. (5)
where Nbli is the lower bound on the number of RBs required by useri when all assigned RBs have an equal and the highest achievable CQI, termed R(CQI)h. Any possible value ofNiwill fall within these two limits and depends specifically on the user channel conditions on the available carriers.
2.2 Evaluation parameters
Table 2 shows the simulation parameters used in all of the evaluations presented in this article, and their corre-sponding values.
3 Set Scheduling and resource block organization algorithm
3.1 Set Scheduling
In order to understand the difference between the pro-posed Set Scheduling strategy and Block by Block Sche-duling, let us first explain the operation of the latter.
Table 1 CQI to S(CQI) and R(CQI) mapping
CQI Modulation S(CQI) [bits] R(CQI) [kbps]
CQI 5 QPSK 377 188.5
CQI 8 QPSK 792 396.0
CQI 15 QPSK 3319 1659.5
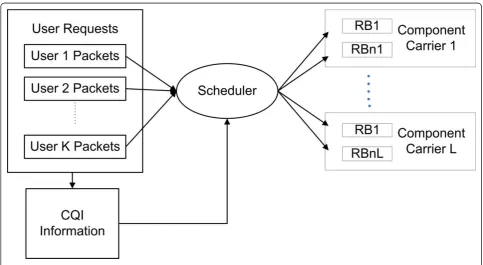
Figure 2 shows the general structure of the Block by Block Scheduling strategy presented in [5-7].
In Block by Block Scheduling each available RB is handled individually. Depending on the scheduler used (i.e., Proportional Fair, Processor Sharing) the schedul-ing metrics are evaluated for each RB. The user who maximizes the specific scheduling metric obtains the RB assignment. This process is repeated until all RBs are assigned, time at which some users will complete all of theirNi required RBs (withNi subject to the constraint in Equation (3)).
We consider that there is an important drawback in a block by block scheduling strategy. For a user i who requiresNi RBs, the time required to assign all of them
is of at least Ni times of that required to assign a single RB. This time can grow even more if the RBs assigned are not contiguous. There is also the possibility that after all the available RBs are assigned, some users will not complete the total number of required RBs. This may result in inefficient use of the available resources.
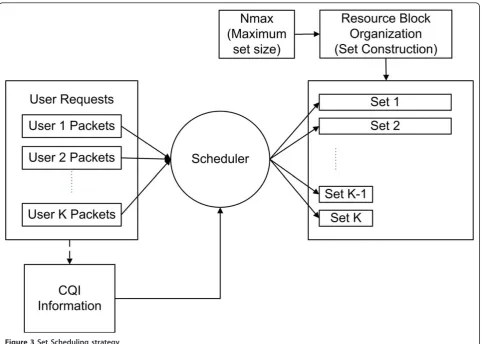
As a solution to the potentially excessive delay in block by block scheduling, we propose the use a Set Scheduling strategy as shown in Figure 3. Using Set Scheduling, available RBs are first organized in sets prior to assignment by the scheduler. Each set as a whole is available to the scheduler. For a user who requires a total ofNiRBs, if a set of size Ni or larger is available, it is assigned to that user in a single operation. There is one main drawback in the proposed Set Scheduling strategy. Additional complexity at the sche-duler is required due to the RB organization algorithm. However, depending on the algorithm itself, this com-plexity can be low compared to the rest of the scheduler components.
3.2 Resource block organization algorithm
The operation of the Set Scheduling strategy is subject to the use of a resource block organization algorithm. Figure 4 shows a block diagram of one of the proposed resource block organization algorithms as presented in [10]. The algorithm in Figure 4 will be referred to as Algorithm 1. The operation of Algorithm 1 is based on the search of consecutive available RBs. In this regard,
Figure 2General Block by Block Scheduling.
Table 2 Simulation parameters and values
Parameter Value
Site layout Single cell, omnidirectional antenna
Path loss ITU-R urban macrocellular NLOS [13]
User location Uniformly dropped within cell
Operation frequency 2.3 and 3.4 GHz
Thermal noise PSD -174dBm/Hz
Minimum CQI at cell edge 5 @ 2.3GHz
Available resource blocks 20 @ 2.3GHz, 160 @ 3.4GHz Requests per slotlu 25, Poisson distributed
Requested data rateRbui Uniformly distributed(1 kbps toRbmax)
Requested file sizeSbui Uniformly distributed(100 bits toSbmax)
Algorithm 1 finds the first available RB from the vector containing RB availability information, and then checks for the contiguous RB for availability. This process is continued until the contiguous RB checked is not avail-able, or until a total of Nmax contiguous RBs are found.
Nmax specifies the maximum size of a set. The index (position) of each RB found available is stored in a row of a Set Matrix. The last column of the row contains the size of the corresponding set. After a set has been formed, a new set is started by finding the next available Figure 3Set Scheduling strategy.
RB, starting the search at the index position where the previous set was finished. The Set Matrix is ready when no more RBs are available to form a set. This process is executed at each scheduling slot, before the assignment of resources.
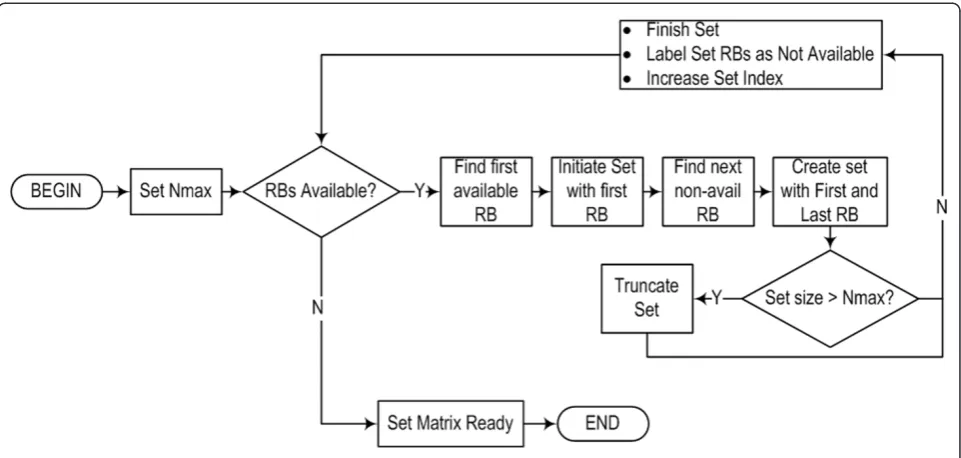
A different RB Organization algorithm is shown in Fig-ure 5, and will be referred to as Algorithm 2. In Algo-rithm 2, the output is the same as in AlgoAlgo-rithm 1 and corresponds to the Set Matrix. However, the operation is different. At the beginning, Algorithm 2 finds the first available RB to form a set. The index corresponding to this RB is considered as the first in the set. Then, Algo-rithm 2 finds the first non-available RB starting the search at the index of the RB of the previous step. This process can be thought of as a search of the beginning and end of a set. The size of the set is verified, and if it is greater than Nmax then the set found is truncated and a new set is formed immediately with the remaining RBs.
Note that the presented algorithms perform Contigu-ous CA. This simplifies the organization algorithm operation, but lacks the capacity to form sets from non-contiguous RBs. It has to be remarked that the organiza-tion operaorganiza-tion is based solely on RB availability.
3.3 Operation of Set Scheduling
Algorithms 1 and 2 were used for set construction in the Set Scheduler structure presented in Figure 3. At each scheduling slot, sets are formed using all the avail-able RBs. The scheduler then assigns each availavail-able set to users according to the scheduling rules. Due to the dynamic nature of the resource use, each set can have a different size with a minimum size of one, and a maxi-mum size of Nmax.
Once the Set Matrix is ready, the scheduler proceeds to the resource assignment operation. An important restric-tion of our Set Scheduling evaluarestric-tion is that sets are assigned to a user if and only if the user has the same CQI for all the RBs in the set. This yields a disadvantage in terms of resource assignment, but it reduces the delay involved in evaluating the constraint of Equation (3). It also guarantees decodability considering that the CQI is adequate for all the RBs in the set. In order to understand the impact of this restriction, consider a user that has dif-ferent CQI levels in contiguous frequencies that span an available set. For such user, service would be denied until a set that falls within a range of frequencies that have the same CQI level is available. In the best case this restriction results in delayed attention, and in the worst case it would result in an unattended user request. Although this restric-tion seems to severely affect QoS, in our evaluarestric-tions with no interference the probability that a user shows different CQI levels within a frequency band (2.3 or 3.4 GHz) is less than 3%. In real world applications, the use of adequate interference control mechanisms reduces the probability that a user experiences different CQI levels within a fre-quency band. This situation does not occur with Block by Block Scheduling since each RB is handled individually.
In our implementation, during the assignment process the scheduler first looks for a set that matches the num-ber of required RBs for a given user. If such set is not available the scheduler is able to assign a set with a lar-ger number of RBs. Only the required RBs will be assigned. The unused RBs from that set will be used to form a new set. The scheduling slot ends when all sets are assigned or all user requests are attended. Non attended users are queued for the next scheduling slot.
When compared to the scheduling presented in [8], there is an important advantage of using Set Scheduling. In [8] resources are assigned also as sets, but each set corresponds to a complete CC. This means that if a CC is composed of 100 RBs and a user requires 101 RBs, a total of 200 RBs will be assigned, corresponding to two CCs. Set Scheduling will only assign as many RBs as required, allowing to use unassigned RBs at a next sche-duling slot. Still, it is not possible to directly compare our proposal with that in [8].
4 Evaluation results and analysis
Using the parameters from Section 2, numerical evalua-tion was performed to asses the performance of Set Scheduling in comparison to Block by Block Scheduling. The scheduling strategy in Figure 2 was implemented considering the possibility of non-contiguous inter-band CA subject to the restriction of Equation 3. The sche-duling strategy in Figure 3 was implemented as described in Section 3. For evaluation a Round Robin scheduler was used. Although the evaluation scenario is simple, it allows to focus in the assessment of the cap-abilities of Set Scheduling.
The value of Nmax was evaluated at 15, 18, 20 and 22 RBs. The value ofRbmax was evaluated between 2,200 and 7,000 kbps and for a given CQI value it determines the average number of RBs that will be required per user. The value of Sbmax was evaluated at 2000, 3000, 4000 and 5000 bits, and for a given CQI value it deter-mines the average number of time slots required to complete a user request transmission.
4.1 Delay analysis
The expected delay due to resource assignment in block by block scheduling can be estimated using Equation 6.
E[Delay] =E[N]·τs. (6)
where E[Delay] is the expected delay to assign all the required RBs to a given user,E[N] is the expected num-ber of RBs per user andτsis the time required to assign one single RB.
To calculateE[N] we will use the conditional expecta-tion method. Thus note that for a given CQI value N
can be calculated as:
N= Rbu
R(CQI)
∀R(CQI)>0
(7)
where Rbu is a random variable and R(CQI) is
assumed to be constant and non-zero. There-fore we can obtain
Given the restriction of R(CQI) > 0 and the statistical independence between R(CQI) and Rbu, we can now
write
where considering R(CQI) as a discrete random vari-able with possible values indicated in Tvari-able 1, the term
E
1
R(CQI)|R(CQI)>0
can be obtained using the
fol-lowing
Note that R(CQI) depends directly on the CQI value. A numerical analysis of the CQI for the evaluation sce-nario and parameters of Section 2, showed that the CQI behaves as a random process with exponential probabil-ity densprobabil-ity function (pdf). This behavior was verified using Q-Qplots showing a perfect fit. Considering this and the discretization of R(CQI) due to the mapping in Table 1, it is possible to obtain specific values for the
term E
Since this value corresponds to a data rate per RB not supported, it possible to say that the value would be in
fact 1
396kbps for the 2.3 GHz frequency band. In the
which given the discretization of R(CQI) results in a
value of 1
188.5kbps.
Given the uniform distribution of the data rate requested described in Section 2, we can assume that E[Rbu] =Rbmax /2. Once the value ofE[N] is obtained
using (10), the expected delay for the assignment of resources in Block by Block Scheduling in terms ofτs can be calculated using Equation (6).
The expected delay when using Set Scheduling can be estimated using Equation (14).
E[Delayset] =E[τo]/λu+τs. (14)
where E[Delayset] represents the expected delay per user due to resource assignment using Set Scheduling;E
[τo] represents the time required by the RB organization
algorithm to obtain the Set Matrix; lu is the average number of user requests per scheduling slot.
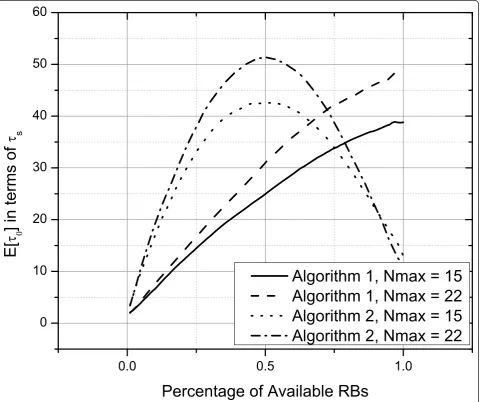
Using numeric evaluation, both RB organization algo-rithms were evaluated in order to determine the para-meter E[τo] for the evaluation conditions specified in Section 2. Figure 6 shows the evaluation ofE[τo] for the minimum and the maximum values of Nmax, with respect to the percentage of available RBs. For this eva-luation, available RBs were randomly distributed. The parameterE[τo] is expressed in terms ofτs.
For Algorithm 1 the maximum value of E[τo] is
obtained when all RBs are available, and in the worst case for a value of Nmax = 22, it corresponds to 49 ⋅τs. Using Equation (14), for the preceded worst case sce-nario, the expected delay due to resource assignment using Set Scheduling corresponds to E[Delayset] = 49 ⋅ τs/25 +τs= 2.96⋅τs. This delay calculation involves only
the availability of RBs and the value of Nmax. For this calculation, it is considered that all user requests are attended.
As it can be observed in Figure 6 there is an impor-tant difference in the behavior of the proposed algo-rithms. Algorithm 1 has a monotonically increasing response with respect to available RBs. Algorithm 2 has a parabolic behavior with its maximum at the point where 50% of RBs are available. When the percentage of RBs is below 70%, Algorithm 1 outperforms Algorithm 2 in terms of E[τo]. However, when a higher percentage of RBs is available for scheduling Algorithm 2 shows a much lower delay. This translates in the fact that when resources are more fragmented, Algorithm 1 will show a lower delay than Algorithm 2. This information is valu-able since it makes possible to select an algorithm based on the expected availability of RBs. It is possible to have both algorithms in a system and switch between them
depending on the resource availability in order to reduce resource assignment delay.
It is also possible to observe in Figure 6 that the expected delay E[τo] is also dependant on the value of Nmax. For a larger value of Nmax a higher E[τo] can be expected. In Algorithm 1, the worst case of delay shows that for Nmax = 22,E[τo] = 49, while for Nmax = 15,E
[τo] = 38. This is a significative difference that can also be observed for Algorithm 2. Given this behavior, in order to reduce delay as much as possible the lowest possible value of Nmax has to be selected.
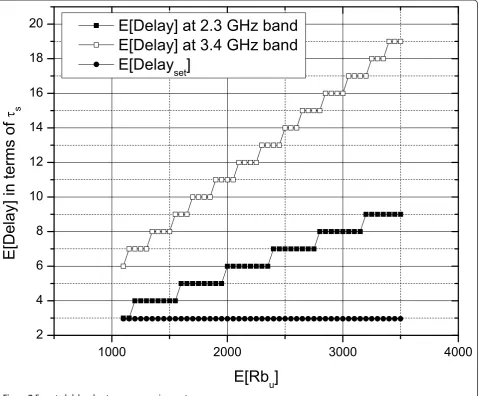
Figure 7 shows a comparison between the expected delay of Block by Block Scheduling for the different values of E[Rbu] and the two frequency bands, with the
expected delay for resource assignment when using Set Scheduling in the worst case of Algorithm 1. The delay advantage is obvious. When using Set Scheduling, delay is not dependent of E[Rbu], but rather on the
parameters of the RB organization algorithm and RB availability. It is also independent on the frequency band. The delay in block by block scheduling is depen-dent on both E[Rbu] and the frequency band, given that
the operating frequency determines the number of expected RBs required per user. For the evaluation para-meters used, Set Scheduling takes at most the same delay as Block by Block Scheduling for resource assign-ment. When compared to the 3.4 GHz band it can reduce the delay by up to six times.
4.2 Complexity description
In order to compare the complexity of Block by Block Scheduling and Set Scheduling we present the general operation of both strategies. Only the general case for each process is described for comparison. The opera-tions not included in each process are the same for each strategy, and involve frequency band distinction and restrictions such as the maximum value of RBs per user (Nmax).
Procedure 1 shows the general operation of Block by Block Scheduling. For each user request, this strategy will find and assign as many RBs as required in order to meet the restriction in Equation 3. Therefore, for a total ofNiRBs, each user needs a total ofNifind operations, as well as Ni assignandNi updateoperations. As pre-viously discussed, the delay due to resource assignment using this strategy will in fact depend on the value of
Ni. Since LTE-Advanced systems allow up to 500 RBs to be assigned to a single user in order to exceed the 1 Gbps requirement for IMT-Advance systems, the delay of Block by Block Scheduling can become considerably high. However, it has the advantage that each available RB can be optimally used for a given CQI value. The achievable data rate will be considered independently for each assigned RB.
Procedure 2 shows the general operation of Set Sche-duling. In this procedure, each user request within the assignment process requires only onecalculate, onefind
operation and oneassign operation. Since the number of required RBs is known due to the restriction of equal
CQI for the RBs in a set, no update operation is
required. In Set Scheduling, the main cause of delay is the execution of the resource block organization algo-rithm at each scheduling slot. However, as it was pre-sented in Section 4.1, the organization of available RBs in sets depends mainly on the availability of RBs and the implementation of the organization algorithm. Since the RB organization algorithm is executed once per schedul-ing slot, the delay due to its execution can be consid-ered as“distributed”among the attended users.
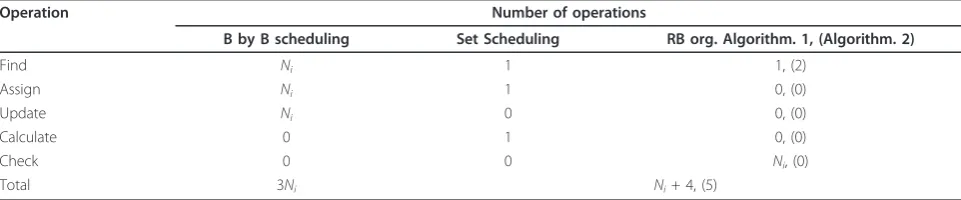
From the algorithms presented in Section 4.1, a com-plexity comparison between both strategies is possible. Consider the construction of one set and its assignment to one user. Table 3 shows a comparison in terms of the number of operations that each strategy performs in order to assign the required RBs to a given user. Each operation is considered as having the same complexity. Although not all the operations are shown, Table 3 does allow for a general comparison. In general, a total of 3Ni operations are required by Block by Block Scheduling in order to assign a total ofNiRBs to a user. On the other hand, Set Scheduling requires a total of Ni + 4 opera-tions when using the RB Organization Algorithm 1, and a total of five operations when using the RB Organiza-tion Algorithm 2. We observed that the most time con-suming operation within our simulation environment is thefind operation. Thecheck operation corresponds to the verification of contiguous RBs in Algorithm 1 (see Figure 4). Therefore, the main difference between both algorithms is that Algorithm 1 uses one findoperation andNicheckoperations per set, while Algorithm 2 per-forms two find operations per set. For any case, the number of operations performed by Set Scheduling including the RB organization algorithm is lower than for Block by Block Scheduling, with an exception when the number of required RBs isNi = 1. The complexity advantage of Set Scheduling increases withNi.
4.3 User capacity analysis
In order to evaluate the performance of Set Scheduling in terms of user capacity, we derived a metric that represents the percentage of user requests that remain in the scheduler queue after a given number of user
Table 3 Comparison of the number of operations required per attended user considering Block by Block Scheduling and Set Scheduling
Operation Number of operations
B by B scheduling Set Scheduling RB org. Algorithm. 1, (Algorithm. 2)
drops. The number of user drops used in our evaluation corresponds to 500 as presented in Section 2. This amount of user drops was obtained through a generate and test algorithm, given that simulating a larger num-ber of user drops does not change the user capacity metric. Equation (15) shows how the metric is calcu-lated
PQ = 1−(Uatt/Urec). (15)
where PQ is the percentage of user requests in queue;
Uatt represents the number of attended requests; Urec corresponds to the number of received requests.
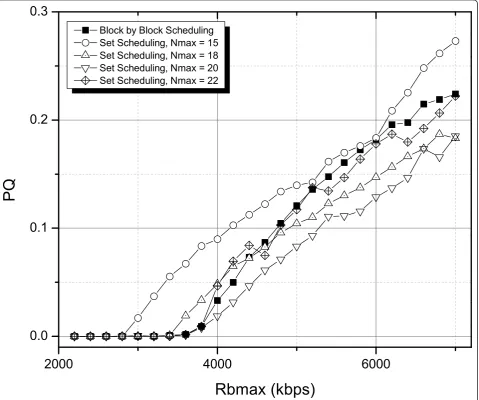
Figure 8 shows a comparison of the PQ metric between Block by Block Scheduling and Set Scheduling at Sbmax = 2,000 bit. The lower value is better. Although the different Set Scheduling evaluations vary in performance, there is always one that outperforms
the Block by Block Scheduling behavior. For anSbmax = 2,000 bit the best performance is obtained when Nmax = 20, with a PQ metric up to 5% lower than that of Block by Block scheduling (achieved atRbmax = 5,800 kbps).
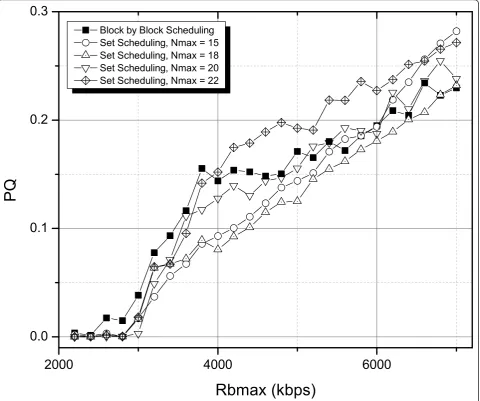
Figure 9 shows the same comparison but withSbmax = 5,000 bit. As it can be observed, the best performance in terms of the PQ metric is obtained with Set Schedul-ing with Nmax = 18. It is possible to note that the value of Nmax that minimizes the PQ metric varies depending on traffic demands. This brings the opportunity to use statistical traffic information in order to select the best possible value of Nmax at each scheduling slot in an adaptive form.
For Figures 8 and 9 it is also possible to bring the information provided by the Set Scheduling delay analy-sis. Using either one of the proposed algorithms for set
construction, the lowest possible delay is achieved with the lowest value of Nmax. Therefore, from the PQ metric analysis, when two or more performance curves overlap the best selection of Nmax will correspond to the lowest value. As such, in Figure 8 a value of Nmax = 15 will be preferred for values of Rbmax lower than 3,000 kbps, while for values ofRb max between 3,000 and 3,500 kbps a value of Nmax = 18 is preferred. For
Rbmax greater than 4,000 kbps a value of Nmax = 20 performs the best.
Figure 10 compares the best performing results for the different values of Sbmax that were evaluated. It is important to note that, for the evaluated conditions, for larger file sizes a smaller value of Nmax performed bet-ter. As expected, at higher Sbmax the PQ metric is increased. In all of the evaluations, Block by Block
Scheduling was outperformed by at least one Set Sche-duling configuration.
slot, reaching the point of system resource depletion at a lower value of average user requested data rate.
The lower PQ metric means that the cell capacity is increased. Statistically, overall throughput can be calcu-lated by multiplying the PQ metric times the mean data rate requested and the average number of users. Once the PQ metric is greater than zero, all of the available RBs are used at each scheduling slot, indicating that the throughput is at a maximum possible for the scheduling and traffic conditions.
4.4 Throughput evaluation
Since the PQ metric used to evaluate user capacity is not commonly used in literature, in this section we pro-vide an evaluation of the throughput behavior of the proposed Set Scheduling strategy. The simulation para-meters used to evaluate throughput are shown in Table
2. The maximum requested bit rate Rbmax was evalu-ated from 2,000 to 10,000 kbps, and Sbmax was evalu-ated for 2,000 and 6,000 bits. For Set Scheduling, a value of Nmax = 20 was used.
Figure 11 shows the throughput percentage calculated using Equation 16.
Throughput percentage = Total assigned throughput/Total requested throughput. (16)
Scheduling outperforms Block by Block Scheduling by up to 8 percent observed at a value ofRbmax = 6, 000 kbps. However, this advantage is reduced as Rb max increases. This is due to the fact that at some point the maximum throughput that can be handled by the sys-tem is reached by both scheduling strategies. This point is reached when Rbmax is 10,000 kbps for a value ofSb max = 2, 000 bits.
Figure 12 shows the average user throughput assigned by the schedulers. It is possible to observe the saturation of system resources as Rb max increases. For a given value of Sbmax, Set Scheduling outperforms Block by Block Scheduling until the maximum throughput that the system can handle is reached. This behavior is con-sistent with that in Figure 11.
5 Conclusions
A scheduling strategy for CA using pre-organized RB sets was presented and evaluated. We presented an analytical evaluation framework to determine the expected number of RBs required by users, based on a mapping of CQI values to data rates per RB and the statistical behavior of the CQI. This framework allowed us to evaluate a macrocellular environment in order to determine the potential delay advantage of using Set Scheduling.
Two different RB Organization Algorithms were implemented. It was possible to observe a marked differ-ence in the delay behavior of the evaluated algorithms in terms of the percentage of available RBs. A dependance to the percentage of available RBs as well as to the value of Nmax are observed. This opens the possibility of designing a different RB organization algorithm with improved behavior and lower delay when compared to the algorithms presented. The capacity of reducing delay due to resource assignment using Set Scheduling depends directly on the performance of the RB Organi-zation Algorithm.
Although the RB organization algorithm used pro-vided only contiguous CA functionality, it still outper-formed a block by block scheduler that used non-contiguous inter-band CA. Some of the improvements that can be made to the scheduling strategy presented in this article include the possibility of aggregating sets. Set aggregation can improve throughput. Also, it is pos-sible to design a different type of scheduler whose metrics are calculated for a whole set. Another improve-ment is the possibility of impleimprove-menting an adaptive RB organization algorithm, that takes into account the sta-tistical behavior of user requests.
In general, we were able to show that Set Scheduling has the capacity of reducing the delay due to resource
2000 4000 6000 8000 10000
0.6 0.8 1.0 1.2
Block by Block Scheduler, Sbm ax = 2000 bits
Block by Block Scheduler, Sbm ax = 6000 bits
Set Scheduling, Sbm ax = 2000 bits, Nm ax = 20
Set Scheduling, Sbm ax = 6000 bits, Nm ax = 20
Max Bit Rate per User, Rbmax (kbps)
P
assignment when compared to Block by Block Schedul-ing without affectSchedul-ing user capacity measured with the PQ metric, throughput percentage and average user throughput.
Procedure 1 General Block by Block Scheduling process
iis the index for the user requests
jis the index for the RB vector
R(CQI)jis the achievable data rate for RBj
forEach scheduling slotdo
whileRBs Availabledo
ifUser requests in queuethen
i¬User Index
Updated Sum Rate ¬ User i Requested Data
Rate
whileUpdated Sum Rate > 0do
find: AvailableRBj
assign:RBjto Useri
update: Updated Sum Rate = Updated Sum
Rate -R(CQI)j
end while
increment: User Index
else
break: No more user requests, process
completed
end if
end while end for
Procedure 2 General Set Scheduling process
forEach scheduling slotdo
execute: Resource Block Organization Algorithm
whileRB Set Availabledo
if User requests in queuethen
i¬User Index
calculate Ni ¬ Number of required RBs for
userifor the different CQI values
find: Set with size≥Ni
assign: NiRBs from set to Useri
increment: User Index
else
break: No more user requests, process
completed
end if end while end for
Acknowledgements
This research work was possible thanks to scholarship number 92845 granted by the National Council of Science and Technology (CONACYT, Mexico) and to the support provided by the Wireless Communications Group at the CICESE Research Center and the Autonomous University of Baja California (UABC), Mexico.
2000 4000 6000 8000 10000
1000
Max Bit Rate per User, Rbmax (kbps)
Block by Block Scheduler, Sbm ax = 2000 bits
Block by Block Scheduler, Sbm ax = 6000 bits
Set Scheduling, Sbm ax = 2000 bits, Nm ax = 20
Set Scheduling, Sbm ax = 6000 bits, Nm ax = 20
Requested Throughput
Author details
1Department of Electronics and Communications, CICESE Research Center,
Ensenada, Mexico2Department of Electrical Engineering, School of Engineering, Autonomous University of Baja California, Mexicali, Mexico
Competing interests
The authors declare that they have no competing interests.
Received: 15 October 2011 Accepted: 14 March 2012 Published: 14 March 2012
References
1. M Dötling, W Mohr, A Osserain,Radio Technologies and Concepts for IMT-Advanced, (Wiley, NJ, USA, 2009)
2. E Dahlman, S Parkvall, J Sköld,4G LTE/LTE-Advanced for Mobile Broadband, (Academic Press, Oxford, UK, 2011)
3. M Lazarus, The great spectrum famine. IEEE Spectr.47(10), 26–31 (2010) 4. G Yuan, X Zhang, Y Yang, Carrier aggregation for LTE-advanced mobile
communication systems. IEEE Commun Mag.48(2), 88–93 (2010) 5. L Lei, K Zheng, Performance evaluation of carrier aggregation for elastic
traffic for LTE-advanced systems. IEICE Trans Commun.E92-B(11), 3516–3519 (2009). doi:10.1587/transcom.E92.B.3516
6. S Songsong, F Chunyan, G Caili, A resource scheduling algorithm based on user grouping for LTE-advanced system with carrier aggregation, in
Computer Network and Multimedia Technology, 2009. CNMT 2009. International Symposium, Wuhan, China, (18-20 Dec 2009)
7. L Chen, W Chen, X Zhang, D Yang, Analysis and simulation for spectrum aggregation in LTE-advanced system, inVehicular Technology Conference Fall (VTC 2009-Fall). 2009 IEEE 70th, Anchorage, Alaska, USA (20-23 Sept 2009) 8. Y Chungm, Z Tsai, A quantized water-filling packet scheduling scheme for
downlink transmissions in LTE-Advanced systems with carrier aggregation, inSoftware, Telecommunications and Computer Networks (SoftCOM), 2010 International Conference on, Split-Adriatic Islands, Croacia, pp. 275–279 (23-25 Sept 2010)
9. L Zhang, K Zheng, W Wang, L Huang, Performance analysis on carrier scheduling schemes in the long-term evolution-advanced system with carrier aggregation. IET Com-mun.5(5), 612–619 (2011)
10. G Galaviz, DH Covarrubias, A Andrade, On a spectrum resource organization strategy for scheduling time reduction in carrier aggregated systems. IEEE Commun Lett.15(11), 1202–1204 (2011)
11. S Masashige, M Akihito, M Nobuhiko, Performance evaluation of inter-cell interference coordination and cell range expansion in heterogeneous networks for LTE-Advanced downlink, inWireless Communication Systems (ISWCS), 2011 8th International Symposium on, Aachen, Germany, pp. 844–848 (6-9 Nov 2011)
12. C Mehlführer, M Wrulich, JC Ikuno, D Bosanska, M Rupp, Simulating the long term evolution physical layer, in17th European Signal Processing Conference (EUSIPCO 2009), Glasgow, Scotland, (24-28 Aug 2009) 13. International Telecommunicaition Union, Guidelines for evaluation of radio
interface technologies for IMT-Advanced, Report ITU-R M.2135-1 (Dec 2009) 14. F Meucci, O Cabral, FJ Velez, A Mihovska, NR Prasad, Spectrum aggregation
with multi-band user allocation over two frequency bands, inMobile WiMAX Symposium, 2009. MWS‘09,IEEE, Napa Valley, California, USA, pp. 81–86 (9-10 July 2009)
doi:10.1186/1687-1499-2012-107
Cite this article as:Galavizet al.:A resource block organization strategy for scheduling in carrier aggregated systems.EURASIP Journal on Wireless
Communications and Networking20122012:107.
Submit your manuscript to a
journal and benefi t from:
7Convenient online submission
7 Rigorous peer review
7Immediate publication on acceptance
7 Open access: articles freely available online
7High visibility within the fi eld
7 Retaining the copyright to your article