EXTRACTION, ISOLATION AND STRUCTURAL ELUCIDATION OF FLAVONOID FROM
CHROZOPHORA PLICATA LEAVES AND EVALUATION OF ITS ANTIOXIDATIVE POTENTIALS
KADIRI SUNIL KUMAR
1*, AVANAPU SRINIVASA RAO
21Department of Pharmaceutical Science, Jawaharlal Nehru Technological University, Kukatpally, Hyderabad, Telangana, India. 2Department of Pharmacology, Bhaskar Pharmacy College, Yenkapally, Moinabad, Ranga Reddy, Hyderabad, India.
Email: [email protected]
Received: 15 January 2017, Revised and Accepted: 01 February 2017 ABSTRACT
Objective: This investigation involves the extraction, isolation, and characterization of flavonoid from a Euphorbiaceae family plant Chrozophora plicata followed by evaluation of its antioxidant principles.
Methods: The dried leaves were subjected to sequential soxhlation with polar and nonpolar solvents. Methanolic extract reveals the presence of large amount of flavonoids. Methanolic extract was subjected to isolation using column chromatographic analysis with solvents such as petroleum ether, chloroform, hexane, ethyl acetate, methanol, and water. Further, the isolated compound was subjected to thin layer chromatography technique and spectral analysis such as infrared, 1HNMR, 13CNMR, mass spectroscopy, and high performance thin layer chromatography (HPTLC) finger printing techniques. The compound was evaluated for in vitro antioxidant studies using 2,2-diphenyl-1-picrylhydrazyl (DPPH), NO assay, reducing power assay, H2O2 scavenging assay, superoxide anion scavenging assay and β-Carotene linoleate system and in vivo antioxidative studies using carbon tetrachloride (CCl4), and acetaminophen intoxicated rats.
Results: The compound was isolated in methanol:water in the ratio of 80:20 using column chromatographic technique. On the basis of phytochemical, chromatographic, and spectral analysis, the isolated compound was identified as kaempferol and finally with HPTLC finger printing technique it was found that the Rf value of the isolated compound was found to be 0.58 which is nearly similar to the Rf value of standard kaempferol (0.55). Hence, the isolated compound was confirmed as kaempferol and is structurally elucidated as 3,5,7-trihydroxy-2-(4-hydroxyphenyl)chromen-4-one. This compound was isolated for the first time from the C. plicata leaves. The in vitro antioxidant assay of isolated flavonoid has shown a dose-dependent increase in free radical scavenging activity using DPPH, no assay, reducing power assay, H2O2 scavenging assay, superoxide anion scavenging assay, and
β-carotene linoleate system. Further, the methanolic extract of C. plicata (MECP) leaves was subjected to single dose acute toxicity study for 14 days in female rats on the basis of OECD guidelines 423 and the therapeutically selected doses were 200 mg/kg and 400 mg/kg. In vivo antioxidant studies in CCl4 and acetaminophen intoxicated rats indicated that the MECP leaves have significantly decreased lipid peroxidation in a dose-dependent manner and increased the levels of catalase, superoxide dismutase, and glutathione.
Conclusions: By the above results, it was concluded that the isolated compound from C. plicata leaves was confirmed as kaempferol and it possesses significant antioxidative potentials.
Keywords: Chrozophora plicata leaves, Flavonoids, Extraction, Isolation, Characterization, Methanolic extract, Antioxidant activity, Carbon tetrachloride, Acetaminophen.
INTRODUCTION
Herbal drugs have become an essential part of native medical systems across the globe [1]. Traditional people have a long history of using herbal drugs for treatment of certain diseases [2]. Blind dependence on allopathic medicines has been gradually decreased, and majority of the population are leaning toward the herbal drugs hoping their ability to eradicate the diseases from the root and also due to their outstanding safety [3]. The world population depends on the usage of herbal medicines to an extent of three-quarter ratio of individuals [4]. Due to the universal health benefits of flavonoids reported in various ailments, there has been an increasing curiosity in the research of flavonoids from plant sources [5,6]. Flavonoids are believed to possess health beneficial properties as a result of high antioxidant potentials in both in vitro and in vivo systems [7,8]. Numerous reports have suggested the protective effects of flavonoids against degenerative diseases such as cancers, cardiovascular diseases, and age-related disorders as well as in many infections (bacterial and viral diseases) [9,10]. Chrozophora plicata also known as Suryavarta in India is a medicinal plant which is one of the ingredients in the well-known Indian herbal tonic Safi. Safi is considered to be a potent blood purifier. With the above background,
this research was planned to extract, isolate and characterize a flavonoid from the leaves of the plant C. plicata belonging to the family Euphorbiaceae and to establish its antioxidant activity by in vitro and in vivo methods. The plant C. plicata has been reported to contain flavonoids [11,12]. The leaves of the plant possesses a wide range of medicinal properties such as anti-inflammatory, antiulcer, anthelmintic, hepatoprotective, gastroprotective activities, for skin diseases and in asthma and bronchitis [13]. Since, there is no literature evidence regarding extraction, isolation, characterization, and antioxidant activity of flavonoids from C. plicata leaves, this research is essential and justifiable.
METHODS
For this study, the leaves of C. plicata plant were collected from the vicinity of the Gajwel (mandal), Medak dist, Telangana, India. Few leaves of C. plicata were deposited in a polythene bag. The samplespecimen is kept in fresh condition by adding 2% formalin. Plant material was identified and authenticated by Dr. N. Sivaraj, Senior Scientist (Eco Botany), National Bureau of Plant Genetic Resources, Rajendranagar, Hyderabad. The study protocol was approved by Institutional Animal © 2017 The Authors. Published by Innovare Academic Sciences Pvt Ltd. This is an open access article under the CC BY license (http://creativecommons. org/licenses/by/4. 0/) DOI: http://dx.doi.org/10.22159/ajpcr.2017.v10i4.17106
Ethical Committee (IAEC) of Vijaya College of Pharmacy, Hyderabad (1292/ac/09//CPCSEA). The leaves of C. plicata were shade dried and mechanically reduced to a coarse powder. The weight of the coarse powder was around 1500 g. The powder was subjected to hot continuous successive extraction in a Soxhlet apparatus with solvents in the increasing order of polarity using petroleum ether, chloroform, hexane, ethyl acetate, methanol, and water under controlled temperature (50-60°C) [14]. Extractives were concentrated below 40°C and further drying was carried out under reduced pressure. The six dried extractives were stored in a dessicator for further evaluation [15]. The extracts were subjected to qualitative tests for detection of phytoconstituents present in it, viz., alkaloids, carbohydrates, glycosides, phytosterols, fixed oils and fats, phenolic compounds and tannins, proteins and free amino acids, gums and mucilages, flavonoids, lignins, and saponins [16]. The methanolic extract revealed the presence of a large amount of flavonoids. Hence, methanolic extract of C. plicata (MECP) leaves was selected for further isolation and investigations.
Silica gel 100-200 mesh was made into a homogenous suspension by shaking with petroleum ether (first eluent). The bottom of the column was plugged with little cotton to prevent the adsorbent pass out, and then the silica gel suspension was poured into the column, set aside for 10 minutes and used. The column 30 cm length and 2.5 cm in diameter were washed with the suitable solvent and dried. The dried column was filled with petroleum ether up to two-third of the column length. Slurry of activated silica gel (column grade 100-200 mesh) prepared using petroleum ether was poured into the column and allowed to settle down, care was taken to avoid any air space or bubble during packing. The silica gel was packed up to three-fourth of the column length, and the solvent level was maintained 5 cm above the silica layer to avoid cracking and air entrapment. A known amount of crude MECP was dissolved in a small quantity of suitable solvent to form clear solution. To this clear solution, 10 g of activated silica gel was added and mixed thoroughly. The solvent was then dried off completely, and the sample adsorbed silica gel was uniformly placed on top of the column, care was taken that the solvent level is always maintained 1cm above the layer of silica gel. After stabilizing a filter paper disc was carefully placed on top of the silica gel.
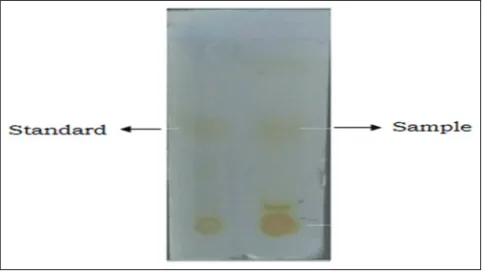
All the collected fractions were subjected to thin layer chromatography (TLC) and the fractions with similar Rf values were combined. The major fractions were purified by recrystallization. All the fractions collected by column chromatography were subjected to TLC analysis [17,18]. The spots obtained on TLC plate with chrozophora plicata methanolic extract and with standard flavonoid kaempferol is shown in Fig. 1. Benzene:Acetone:Formic acid (5:4:1 v/v/v) is used as the mobile phase. Among all the spots, spots with fraction methanol:water (80:20) were clear and distinct. These fractions were combined and concentrated using Rotavapor apparatus to get a residue and were subjected for purification [19]. The schematic representation of the procedure involved in the isolation of flavonoids from chrozophora plicata leaves is shown in Chart 1. Further, the isolated compound was compared with standard flavonoids. The compound was spectrally characterized using FT-IR, 1HNMR, 13CNMR, mass spectroscopy, and high performance TLC (HPTLC).
Characterization of the isolated compound
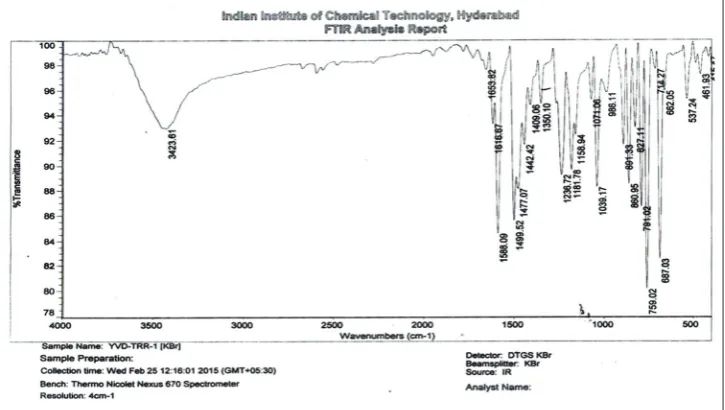
To characterize the isolated compound IR, 1HNMR, 13CNMR, mass spectroscopy, and HPTLC finger printing methods are employed. A small quantity of the sample (1-3 mg) was pressed in KBr (3-5 mg) pellets using Fourier transform infrared spectroscopy (Perkin Elmer). The spectrum was recorded with the wave number 4000-400 cm−1.
1HNMR and 13CNMR were recorded on Bruker Avance-300 DRX NMR Spectrometer using dimethyl sulfoxide (DMSO) as solvent. Mass spectroscopy converts molecules into ions and according to their mass and charge the ions can be separated and sorted. The mass spectrometer used for this purpose was SHIMADZU (SHIMADZU ACCUSPOT). HPTLC analysis was performed with CAMAG LINOMAT 5 instrument, and the images were observed at white light, UV 254 nm, and UV 366 nm. The spectras obtained from IR, 1H NMR, 13 C NMR, Mass spectroscopy and HPTLC finger printing techniques are shown in Figs. 2-9.
In vitro antioxidant activity of isolated flavonoid from C. plicata leaves
2,2-diphenyl-1-picrylhydrazyl (DPPH) assay[20]
The free radical scavenging activity of isolated flavonoid from MECP leaves was determined using Blois method. To 1 ml of 0.1 mM solution of DPPH in methanol add 3 ml of different concentrations of isolated flavonoid of C. plicata leaves (5, 10, 25, 50, and 100 µg/ml). Reference standard used is ascorbic acid (100 µg/ml). All the experiments were performed in triplicate. The percentage inhibition was calculated using the formula.
% inhibition =Absorbance of control Absorbance of sample Absorba
−
n
nce of control ×100
Chart 1: Procedure involved in isolation of flavonoids from chrozophora plicata leaves by using column chromatography
Fig. 1: Thin layer chromatographic analysis of isolated compound from Chrozophora plicata leaves and its comparison with
Nitric oxide scavenging activity
Sodium nitroprusside (2 ml) in phosphate buffer (pH 7.4) is mixed with 0.5 ml of various concentrations of isolated flavonoid of C. plicata leaves ranging from 5-100 µg/ml dissolved in methanol. The mixtures were incubated at 25°C for 150 minutes at room temperature. The same reaction mixture without isolated flavonoid from C. plicata served as control. After incubation, 0.5 ml of Griess reagent was added to 0.5 ml of each sample and was incubated for further 30 minutes at room temperature. The absorbance of the chromophore was measured at 546 nm. This experiment was done in triplicate, and the % inhibition was calculated using the following formula,
% inhibition=Absorbance of control Absorbance of sample Absorba
−
n
nce of control ×100
Reducing power assay
The reducing power of isolated flavonoid form C. plicata leaves was determined by Oyaizu method [21]. 1ml of distilled water containing different concentrations of isolated flavonoid of C. plicata leaves (20, 40, 60, 80, and 100 µg/ml) was mixed with phosphate buffer (2.5 ml, 0.2 M, and pH 6.6), potassium ferricyanide (2.5 ml, 1%), and
incubated at 50°C for 20 minutes. After incubation, a portion (2.5 ml) of 10% trichloroacetic acid was added and centrifuged at 3000 rpm for 10 minutes 2.5 ml of supernatant solution, i.e., the upper layer was mixed with distilled water (2.5 ml) and FeCl3 (0.5 ml, 0.1%) and the absorbance was measured at 700 nm. Sodium metabisulfite was used as reference standard. The test was performed in triplicate. Absorbance is directly proportional to the reducing power. Increase in absorbance of the reaction mixture suggests increase in reducing power. The percentage increase in absorbance was calculated using the following formula,
% increase in absorbance=Control OD Test OD ControlOD
−
Hydrogen peroxide scavenging activity
The ability of the substance to scavenge hydrogen peroxide was determined according to the method designed by Ruch et al. [22,23]. 1 ml of various concentrations of isolated flavonoid from C. plicata leaves (50-250 µg/ml) were mixed with 2 ml of 20 mM hydrogen peroxide in phosphate buffer saline (pH7.5) and incubated for 10 minutes. The absorbance was read at 230 nm against phosphate buffer saline blank. Fig. 2: Infrared spectra of isolated compound from Chrozophora plicata leaf
The experiment was done in triplicate. The data were represented as % inhibition. Ascorbic acid was used as reference standard.
% increase in absorbance=Control OD Test OD Control OD
−
Superoxide anion radical scavenging assay
The assay is based on the ability of the isolated compound to inhibit formazon formation by scavenging the superoxide radicals generated in riboflavin-light-NTB system [24,25]. 100 µl riboflavin (2 µm), 200 µl methionine (13 mM), 200 µl ethylenediaminetetraacetic acid (EDTA) (100 µm), and 100 µl NBT (75 µm) and 1 ml of isolated flavonoid from C. plicata leaves (100, 200, 300,400, and 500 µg/ml) was mixed and it was then diluted to 3 ml with sodium phosphate buffer. The production of formazon was followed by reading the absorbance at 560 nm after a 10 minutes illumination from a fluorescent lamp. A reaction mixture was kept in identical tubes at dark served as blanks. The percentage inhibition was calculated.
β-carotene linoleate model [26]
The antioxidant activity by β-carotene linoleate model was according
to the method of Kartal et al. [27]. 2 mg of β-carotene was dissolved in
10 ml of chloroform, and 2 ml of the above solution was transferred into 100 ml round bottom flask. Chloroform was removed under vacuum and then 40 mg of linoleic acid, 400 mg of Tween-40, and 100 ml of distilled water (aerated) were added. 4.8 ml of this emulsion (aliquots) was added to test tubes containing an isolated compound of C. plicata leaves (100, 200, 300, 400, and 500 µg/ml) in 2 ml, immediately the zero time absorbance was measured at 470 nm. After incubating the tubes at 50°C for 2 hrs, the absorbance was measured again. A blank
was prepared without β-Carotene and absorbance was measured. The
same procedure was repeated with butylated hydroxytoluene (BHT).
Antioxidant activity = (β-carotene content after 2 hr of assay/initial
β - carotene content) ×100
Acute toxicity studies [28,29]
The Acute toxicity study was performed on the basis of OECD guidelines 423 and fixed dose studies were conducted where the limit dose is 2000 mg/kg body weight of test rats. The study protocol was approved by IAEC of Vijaya College of Pharmacy, Hyderabad (1292/ac/09//CPCSEA). The Procedure was divided into two phases, phase I (observation made on day 1) and phase II (observed the animals for next 14 days). The rats were dosed at 100, 250, 500, 700, 1000, and 2000 mg/kg of MECP leaves. Individual rats were observed for 4 hrs for behavior, autonomic and neurological symptoms or mortality. Body weights were recorded 6 hrs post dosing. From next day onward, each day every 1 hr the behavioral change, toxic signs or mortality was observed in the same animals for next 14 days, and body weights were recorded on 8th and 14th day post dosing. In the absence of lethality, 1/10th and 1/5th of the higher dose was selected as a therapeutic dose.
In vivo antioxidant studies
In vivo, antioxidant studies were conducted in carbon tetrachloride (CCL4) and paracetamol intoxicated rats. The effect of MECP leaves
on antioxidant enzymes (catalase, superoxide dismutase (SOD), and glutathione) and lipid peroxidation was studied.
In vivo antioxidant studies of MECP leaves in CCL4 intoxicated rats
[30,31]
Groups: Animals were divided into seven groups containing six animals each.
• Group I: Untreated control group (1% liquid paraffin 1 ml/kg s.c as
vehicle) (-ve control).
• Group II: Hepatotoxin control (+ve control) group (vehicle only for 7 days (s.c) followed by 1 ml/kg b.w CCl4:liquid paraffin (1:1) s.c on
7th day).
• Group III: Standard group (100 mg/kg silymarin) once daily for 7 days
(p.o) followed by 1 ml/kg b.w CCl4:liquid paraffin (1:1) s.c on 7th day.
• Group IV: MECP leaves (200 mg/kg, b.w) daily for 7 days p.o followed
by 1 ml/kg b.w CCl4:liquid paraffin (1:1) on 7th day.
• Group V: MECP leaves (400 mg/kg, b.w) daily for 7 days p.o followed
by 1 ml/kg b.w CCl4:liquid paraffin (1:1) s.c on 7th day.
Effect of MECP leaves against acetaminophen intoxicated rats [32]
• Groups: Animals were divided into seven groups containing six
animals each.
• Group I: Untreated control group (-ve control) (2% w/v acacia
suspension)
• Group II: Positive control group (toxic control) (vehicle for 7 days +
paracetamol 2 g/kg b.w (p.o) on 5th day) [33].
• Group III: Standard group (Silymarin 100 mg/kg b.w daily for 7 days
and paracetamol 2 g/kg b.w on the 5th day).
• Group IV: Received MECP leaves (200 mg/kg b.w dose daily for 7 days
p.o and paracetamol 2 g/kg b.w p.o on the 5th day).
• Group V: Received MECP leaves (400 mg/kg b.w dose daily for 7 days
p.o and paracetamol 2 g/kg b.w p.o on the 5th day).
Isolation of liver
Animals were sacrificed on 8th day by mild ether anesthesia for the isolation of liver. Liver was isolated and washed thoroughly with ice-cold saline solution. The liver weight was recorded after blotting filter paper pads. The liver homogenate was prepared and used for further in vivo antioxidant studies.
Lipid peroxidation (malondialdehyde)
1 ml of solution D wasadded to 500µl of liver homogenate and boiled for 15 minutes. After cooling, the solution mixture was subjected to centrifugation at 10,000 rpm for 5 minutes. The absorbance of clear supernatant was measured at 532 nm against reference blank. The malondialdehyde content was estimated as thiobarbituric acid reactive
substances (TBARS) using the formula, C=A/єt
C= Concentration of sample (TBARS), A= absorbance of sample
Є = Molar extinction coefficient of MDA (1.56 × 10⁵/moles/cm)
t = Path length
Catalase [34,35]
was measured at 240 nm. Add 1ml of 10 mM H2O2 solution and after 1 minute reading was against taken. Catalase activity was calculated using the formula.
Catalase unit per ml of sample A A 3XDF 2
Catalase unit per mg of tissue=Catalase unit per ml of sampple Mg of tissue per ml
Where,
∆AS: Absorbance difference of sample
∆AO: Absorbance of control DF: Dilution factor
Є: Molar coefficient of H2O2
SOD [36]
To 100 µl of 10% w/v liver homogenate, add 1 ml of Na2CO3,400 µl nitro blue tetrazolium and 200 µl EDTA. The absorbance was measured at 560 nm. 400 µl of hydroxylamine hydrochloride was added to initiate the reaction and incubated for 5 minutes at 25°C. The reduction of NBT was recorded after 5 minutes at 560 nm. One unit of enzyme activity of SOD is defined as the concentration of enzyme present in 100 µl of 10% liver homogenate capable of inhibiting the reduction of NBT by 50% under assay conditions and is expressed as units/mg of tissue.
SOD= 1/50 x DF x 1/ 0.1 x 1/mg of tissue/ml
Glutathione [37]
To 1 ml of 10% w/v liver homogenate, add distilled water (1.8 ml) and 2 ml of phosphate buffer (pH 7) and the absorbance was read at 412 nm. 5 minutes after adding 0.2 ml of DTNB reagent, the intensity of yellow color was measured at 412 nm. The amount of glutathione was determined using molar extinction coefficient of 13,060/m/cm and expressed in terms of µ mol/mg of protein. It can be calculated using
the following formula, C=A/єt.
RESULTS AND DISCUSSION
Chromatographic techniques for isolation and spectral analysis for characterization of C. plicata leaves have not been reported until today according to literature survey. MECP leaves were subjected for isolation using column chromatography. Among all the fractions collected, fractions (80-84) showed identical spots with an Rf values of 0.75, 0.53, 0.26, and 0.17 using Benzene:Acetone:Formic acid (5:4:1 v/v/v) as the mobile phase. Among all these spots, spots with Rf value of 0.75 showed major spot. These fractions were combined and concentrated using Rotavapor apparatus to get a residue and were subjected for purification. The residue showed three minor spots and a major spot in TLC. To the residue, 15 ml of acetone was added and mixed thoroughly and filtered. The procedure was followed twice; the filtrates collected were mixed and subjected for TLC. The filtrate showed two spots one major spot at 0.46 and minor spot at 0.82. To the filtrate, 5 ml of
ether was added. Precipitation occurred during addition of ether. The precipitate was filtered and dried and subjected for TLC. The TLC showed single spot at Rf value 0.56 using Benzene:Acetone:Formic acid (5:4:1 v/v/v) as the mobile phase. It was yellowish-green substance designated as the compound. Further, the isolated compound was subjected to TLC and compared with standard flavonoid kaempferol.
Solvent system:Benzene:Acetone:Formic acid (5:4:1 v/v/v).
Spraying agent: Iodine vapors.
Rf values: 0.56 (standard kaempferol), 0.54 (compound).
Spectral characteristics of the isolated compound of C. plicata leaf: IR (KBr) spectrum
The data obtained from IR spectral analysis of isolated compound indicates the various functional groups present in the isolated compound. The data are as follows:
FT-IR (KBr) cm−1:3423.61 (OH), 1653.82 (C=0), 1039.17 (Phenolic C-O), and 1588.09 (aromatic C=C). the presence of four OH protons. Protons attached to the C-2' and C-6' positions were assigned a doublet at 7.9. Protons attached to the C-3' and C-5' positions were assigned a doublet at 6.9. Similarly, protons attached to C-6' and C-8' were assigned two singlets at δ values 6.6 and 6.1.
13CNMR characterization of isolated compound of C. plicata leaf The 13CNMR spectrum showed signals at δ values 156 (C-2), 136 (C-3), 175 4), 165 5), 97 6), 164 7), 95 8), 160 9), 103
(C-10), 123 (C-1'), 126 (C-2'), 110 (C-3'), 155 (C-4'), 101 (C-5'), and 125 (C-6').
Mass spectral analysis
The molecular ion peak M+ of the isolated flavonoid was observed at
m/e 286 and is shown in the Fig. 5.
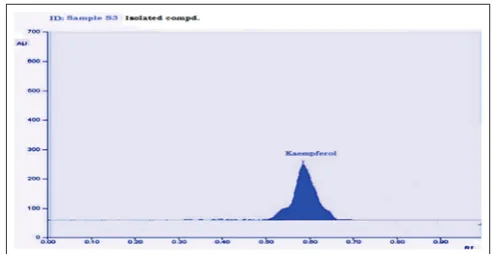
HPTLC finger printing
MECP leaves and isolated compound from MECP leaves were subjected to HPTLC determination and finally compared with the standard HPTLC of flavonoid kaempferol. 2.0 µl of the test extract, isolated compound, and 2.0 µl of standard flavonoid were dissolved in methanol
and loaded as 5 mm band length in the 4×10 silica gel 60F254 TLC
plate using Hamilton syringe and CAMAG LINOMAT 5 instrument. The sample loaded plate was then developed with 10 ml of solvent system, Benzene:Acetone:Formic acid (5:4:1) in TLC twin trough developing chamber (after saturated with solvent vapor) and the plate was
developed in the respective mobile phase up to 90 mm. The developed plate was subjected to drying by hot air oven at 100°C to evaporate solvents from the plate. The plate was placed in photo documentation chamber (CAMAG REPROSTAR 3) and images are captured at white light, UV 254 nm, and UV 366 nm. The peak table, peak display, and peak densitogram were recorded.
It is evident from the above HPTLC chromatograms that the standard kaempferol peak is seen at Rf 0.55 and the peaks of C. plicata leaf and isolated compound is seen at Rfvalues 0.56 and 0.58 which are nearly similar to the Rf value of standard kaempferol. This indicates that the isolated compound from C. plicata leaves was identified as kaempferol. The spectral data obtained from the FT-IR, 1HNMR, 13CNMR, mass spectroscopy, and HPTLC shows that the isolated compound from C. plicata leaves has similar resemblance with kaempferol. Hence, the isolated compound from C. plicata leaves was confirmed as kaempferol and its structure is presented below. The structure of the isolated compound is shown in the figure 10.
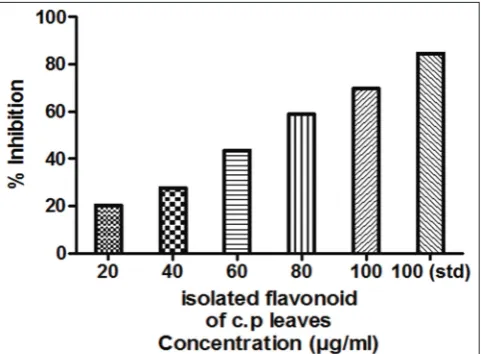
In vitro antioxidant study: DPPH (2, 2-Diphenyl-1-picryl-hydrazyl) assay
In this assay, isolated flavonoid of C. plicata leaves has shown a dose-dependent increase in the DPPH radical scavenging activity. Ascorbic acid (100 µg) has exhibited 94.12% activity. However, 100 µg/ml of isolated flavonoid has shown maximum scavenging activity, i.e., 78.27. The results are summarized in Table 1 and graphically depicted in Fig. 11. The inhibitory concentration (IC50) value is also shown in Table 1.
Nitric oxide radical scavenging activity
In this experiment, it is observed that the isolated flavonoid of C. plicata leaves has shown a significant dose-dependent increase in the nitric oxide anion scavenging property. Ascorbic acid (100 µg) has shown 84.64% activity. However, 100 µg of isolated flavonoid of C. plicata leaves has shown maximum scavenging activity, i.e., 69.76%. The results are shown in Table 2 and graphically depicted in Fig. 12. The IC50 valueis also shown in Table 2.
Fig. 6: Chrozophora plicata leaf methanolic extract plant sample
peak display (scanned at 254 nm)
Fig. 7: Kaempferol standard peak densitogram display
(scanned at 254 nm)
Fig. 8: Chrozophora plicata leaf sample (S1) methanolic extract
plant sample peak densitogram display (scanned at 254 nm)
Fig. 9: Isolated compound from Chrozophora plicata leaf sample
peak densitogram display (scanned at 254 nm)
Fig. 10: Structure of isolated flavonoid from Chrozophora plicata
leaves (3,5,7-trihydroxy-2-(4-hydroxyphenyl)chromen-4-one)
(kaempferol)
Fig. 11: Graphical representation of 2,2-diphenyl-1-picrylhydrazyl
Reducing power assay
From the above assay, it is observed that the isolated flavonoid of C. plicata leaves has exhibited dose-dependent increase in the reducing property. Standard sodium metabisulfite (100 µg) has shown 92.6% activity. Isolated flavonoid at 20, 40, 60, and 80 µg has shown steady increase in reducing property, but there is a sudden increase in the activity at concentration of 100 µg (70.11%). The results are summarized in Table 3 and graphically depicted in Fig. 13.
Hydrogen peroxide scavenging activity
Isolated flavonoid from C. plicata leaves exhibited dose-dependent H2O2 scavenging activity. Standard ascorbic acid (100 µg) has shown 77.84% activity. Isolated flavonoid from C. plicata leaves exhibited maximum activity at 250 µg (71.28) with IC50 value of 166 µg. The results are summarized in Table 4 and graphically depicted in Fig. 13. The results are graphically depicted in Fig. 14. The IC50 value is also shown in Table 4.
Superoxide anion scavenging activity
It was observed that the isolated flavonoid from C. plicata leaves scavenge the superoxide anion in dose-dependent manner. Ascorbic acid (100 µg) has shown 97.15% activity. However, 500 µg of isolated flavonoid of the leaf extract has shown maximum scavenging activity, i.e., 79.65%. The results are summarized in Table 5 and depicted in Fig. 15. The IC50 value is also shown in Table 5.
Antioxidant activity in β-carotene linoleate system
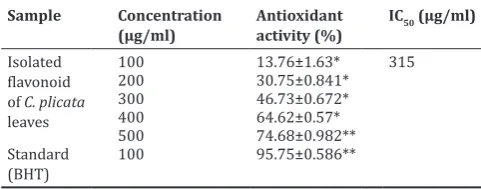
It was found that the isolated flavonoid of C. plicata leaves has shown significant dose-dependent antioxidant activity. BHT (100 µg) has shown 95.75% activity. However, 500 µg of isolated flavonoid of leaf extract has shown maximum scavenging activity, i.e., 74.68 but less than that of standard. The results are shown in Table 6 and graphically depicted in Fig. 16. The IC50 value is also shown in Table 6.
Acute toxicity studies
Acute toxicity studies of MECP leaves were conducted as per OECD guidelines 423. The methanolic extract was given to female rats at doses 100, 250,500, 700, 1000, and 2000 mg/kg using oral gavage did not reveal any signs of toxicity or adverse effects. The rats were observed twice daily for 14 days did not revealed any drug-related toxic signs
Table 1: DPPH radical scavenging activity of isolated flavonoid of C. plicata leaves
Sample Concentration
(µg/ml) DPPH free radical inhibition (%)
IC50 (µg/ml)
Isolated flavonoid of C. plicata leaves
20 22.11±0.004* 67
40 35.26±0.006*
60 45.14±0.002*
80 59.35±0.008*
100 78.27±0.004**
Standard (ascorbic acid)
100 94.12±0.003**
C. plicata: Chrozophora plicata, Data and results are expressed as mean±SEM. *p<0.05, **p<0.01, were considered statistically significant when compared to control. DPPH: 2,2-diphenyl-1-picrylhydrazyl, IC50: Inhibitory concentration
Table 2: Nitric oxide radical scavenging activity of isolated flavonoid of C. plicata leaves
Sample Concentration
(µg/ml) Nitric oxide radical inhibition (%)
IC50 (µg/ml)
Isolated flavonoid of C. plicata leaves
20 20.26±0.001* 70
40 27.73±0.005*
60 43.47±0.003*
80 58.91±0.012*
100 69.76±0.007**
Standard (ascorbic acid)
100 84.64±0.008**
Data and results are expressed as mean±SEM. *p<0.05, **p<0.01, were considered statistically significant when compared to control. C. plicata:
Chrozophora plicata, IC50: Inhibitory concentration
Fig. 12: Graphical representation of nitric oxide scavenging activity of isolated flavonoid of Chrozophora plicata leaves
Fig. 13: Graphical representation of reducing power activity of isolated flavonoid from Chrozophora plicata leaves
Fig. 14: Graphical representation of hydrogen peroxide scavenging activity of isolated flavonoid from Chrozophora plicata
Table 3: Reducing power activity of isolated flavonoid of C. plicata leaves
Sample Concentration (µg/ml) Absorbance (mean±SEM) Percentage increase IC50 (µg/ml)
Control - 0.1625±0.027 -
-Isolated flavonoid of C. plicata leaves 20 0.1728±0.033* 6.25 88
40 0.1994±0.026* 22.84
60 0.2186±0.017* 34.59
80 0.2342±0.001* 44.43
100 0.2751±0.046* 70.11
Standard (sodium metabisulfite) 100 0.3054±0.021** 92.26
-C. plicata: Chrozophora plicata, Data and results are expressed as mean±SEM. *p<0.05, **p<0.01, were considered statistically significant when compared to control. IC50: Inhibitory concentration
Table 4: Hydrogen peroxide scavenging activity of isolated flavonoid from C. plicata leaves
Sample Concentration
(µg/ml) Scavenging of hydrogen peroxide (%)
Data and results are expressed as mean±SEM. *p<0.05, **p<0.01, were considered statistically significant when compared to control.
C. plicata: Chrozophora plicata, IC50: Inhibitory concentration
Table 5: Superoxide anion scavenging activity of isolated
flavonoid from C. plicata leaves Sample Concentration
(µg/ml) Superoxide anion radical inhibition (%)
Data and results are expressed as mean±SEM. *p<0.05, **p<0.01, were considered statistically significant when compared to control. C. plicata: Chrozophora plicata, IC50: Inhibitory concentration
Table 6: Antioxidant activity of isolated flavonoid of C. plicata
leaves in β-carotene linoleate system
Sample Concentration
(µg/ml) Antioxidant activity (%) IC50 (µg/ml) Isolated
BHT: Butylated hydroxytoluene, C. plicata: Chrozophora plicata, Data and results are expressed as mean±SEM. *p<0.05, **p<0.01, were considered statistically when compared to control. significant, IC50: Inhibitory concentration
Fig. 15: Graphical representation of superoxide anion scavenging
activity of isolated flavonoid from Chrozophora plicata leaves
Fig. 16: Graphical representation of antioxidant activity of
isolated flavonoid of Chrozophora plicata leaves in β-carotene
linoleate system
was considered as safest higher dose and 1/10th, i.e., 200 mg/kg and 1/5th of 2000 mg/kg, i.e., 400 mg/kg was selected for the further studies.
In vivo antioxidant studies
CCl4 treated rats
CCl4 significantly increased the level of lipid peroxidation and reduced catalase, SOD, and glutathione levels in toxicant animals by 52.62%, 44.55%, and 45.22%, respectively. Lipid peroxidation was significantly decreased (p<0.001) with MECP leaves (MECP) at 200 mg and 400 mg/kg. Catalase levels were significantly increased by C. plicata or mortality. Hence, the acute oral LD50 of the methanolic extract was
Table 7: In vivo antioxidant activity of methanolic extract of C. plicata leaves in CCl4 treated rats Groups Lipid peroxidation (µ mol MDA/mg
of protein) Catalase (unit/mg of tissue) SOD (unit/mg of protein) Glutathione (µ mol/mg of protein)
Normal control 0.302±0.0113 9.837±0.5132 2.841±0.015 20.31±0.4512
Positive control (CCl4) 1.365±0.1082 4.628±0.3164 1.726±0.1472 11.14±0.4154
Standard (silymarin)
100 mg/kg 0.4314±0.018*** 8.276±0.2516*** 2.814±0.1306*** 17.39±0.3872***
MECP (200 mg/kg) 1.092±0.0371** 4.731±0.1836 2.164±0.0326** 12.75±0.5186***
MECP (400 mg/kg) 0.7108±0.0521*** 6.438±0.1584*** 2.653±0.134*** 15.14±0.6172***
Values are expressed as mean±SEM. Data compared against positive control group. One-way analysis of variance. **p<0.01, ***p<0.001 were considered statistically significant when compared to control. using Tukey-Kramer multiple comparison test
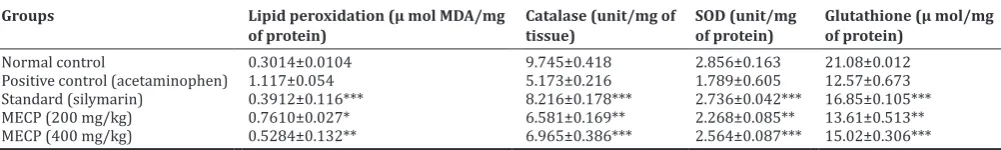
Table 8: In vivo antioxidant activity of methanolic extract of C. plicata leaves in acetaminophen-treated rats
Groups Lipid peroxidation (µ mol MDA/mg
of protein) Catalase (unit/mg of tissue) SOD (unit/mg of protein) Glutathione (µ mol/mg of protein)
Normal control 0.3014±0.0104 9.745±0.418 2.856±0.163 21.08±0.012
Positive control (acetaminophen) 1.117±0.054 5.173±0.216 1.789±0.605 12.57±0.673
Standard (silymarin) 0.3912±0.116*** 8.216±0.178*** 2.736±0.042*** 16.85±0.105***
MECP (200 mg/kg) 0.7610±0.027* 6.581±0.169** 2.268±0.085** 13.61±0.513**
MECP (400 mg/kg) 0.5284±0.132** 6.965±0.386*** 2.564±0.087*** 15.02±0.306***
Values are expressed as mean±SEM. Data compared against positive control group. One-way analysis of variance. *p<0.05, **p<0.01, ***p<0.001 using Tukey-Kramer multiple comparison test
methanolic extract at 400 mg/kg, whereas the levels of catalase were not significantly increased with 200 mg/kg. SOD and glutathione levels were significantly increased with MECP at both 200 mg/kg and 400 mg/kg. Silymarin exhibited significant effect on all the parameters at the dose of 100 mg/kg. The results are depicted in Table 7.
Acetaminophen treated rats
Acetaminophen significantly enhanced the level of lipid peroxidation and decreased the levels of catalase (48.6%), SOD (38.6%), and glutathione (35.8%) in hepatotoxin group. Lipid peroxidation was significantly reduced (p<0.001) with MECP at 200 mg/kg and 400 mg/kg. Catalase levels were significantly increased by MECP at 200 mg/kg and 400 mg/kg (p<0.001). SOD and glutathione levels were increased significantly with IFCP (p<0.01 for 200 mg/kg and p<0.001 for 400 mg/kg). Silymarin exhibited significant effect on all the parameters. The results are depicted in Table 8.
CONCLUSION
In the above research, we conclude that the flavonoid from C. plicata leaves was successfully isolated and on the basis of spectral analysis it was confirmed as 3,5,7-trihydroxy-2-(4-hydroxyphenyl)chromen-4-one (kaempferol). Further, in vitro and in vivo antioxidant studies of isolated kaempferol and MECP leaves reveals that the compound has potent antioxidant property.
ACKNOWLEDGMENTS
The authors are grateful to the management of Vijaya College of Pharmacy and Bhaskar Pharmacy College, Hyderabad, for providing facilities to carry out the present research. Dr. Avanapu Srinivasa Rao helped in designing the experiment and writing this research article. Authors would like to acknowledge Rxn Chemicals Pvt. Ltd. Mumbai, India, for providing standard drug kaempferol for the research.
REFERENCES
1. Prakash P, Gupta N. Therapeutic uses of Ocimum sanctum Linn (Tulsi) with a note on eugenol and its pharmacological actions: A short review. Indian J Physiol Pharmacol 2005;49(2):125-31.
2. Farnsworth NR. The role of ethnopharmacology in drug development. Ciba Foundation Symposium 154 - Bioactive Compounds from Plants. Baffins Lane, Chichester, England: John Wiley & Sons; 1990. p. 2-21. 3. Anonymous. Sectoral Study on Indian Medicinal Plants Status,
Perspective and Strategy for Growth. New Delhi: Biotech Consortium
India Ltd.; 1996.
4. World Health Organization. Guidelines for the Assessment of Herbal Medicines. Document No. WHO/TRM/91.4. Geneva: World Health Organization; 1991.
5. Kumar S, Mishra A, Pandey AK. Antioxidant mediated protective effect of Parthenium hysterophorus against oxidative damage using
in vitro models. BMC Complement Altern Med 2013;13:120. 6. Kumar S, Pandey AK. Phenolic content, reducing power and membrane
protective activities of Solanum xanthocarpum root extracts. Vegetos 2013;26:301-7.
7. Cook NC, Samman S. Review: Flavonoids-chemistry, metabolism, cardio protective effects and dietary sources. J Nutr Biochem 1996;7(2)66-76.
8. Rice-Evans CA, Miller NJ, Bolwell PG, Broamley PM, Pridham JB. The relative antioxidant activities of plant derived polyphenolic flavonoids. Free Radic Res 1995;22(4):375-83.
9. Pandey AK. Anti-staphylococcal activity of a pan-tropical aggressive and obnoxious weed Parihenium histerophorus: An in vitro study. Natl Acad Sci Lett 2007;30(11-12):383-6.
10. Kumar S, Gupta A, Pandey AK. Calotropis procera root extract has capability to combat free radical mediated damage. ISRN Pharmacol 2013;2013:8.
11. Abdel-Fattah MR. The Chemical Constituents and Economic Plants of the Euphorbraceae. Doha, Qatar: Chemistry Department, Faculty of Science, Qutar University; 1987.
12. Hashim OK, Abou-Zaid MM, Abdel-Galil FM, Saleh NA. The flavonoids of Egyptian Chrozophora species. Biochem Syst Ecol 1990;18:151-2.
13. Burkill HM. Families E-I. The Useful Plants of West Tropical Africa. 2nd ed., Vol. 2. Kew, Richmond, United Kingdom: Royal Botanical
Gardens; 1994. p. 636.
14. Evans WC. Pharmacognosy. 16th ed. Edinburgh: Saunders Elsevier;
2009. p. 3-4.
15. Satinder A, Karen MA. Handbook of Isolation and Characterization of Impurities in Pharmaceuticals. California: Academic Press; 2003. p. 214-20.
16. Barrett M. The Hand Book of Clinically Tested Herbal Remedies. 1st ed. New Delhi: CBS Publishers and Distributors; 2007. p. 3-6.
17. Sharma PC, Bhatia V, Bansal N, Sharma A. A review in Bael tree. Nat Prod Radiance 2007;6(2):171-8.
18. Yadav NP, Chanotia CS. Phytochemical and pharmacological profile of leaves of Aegle marmelos Linn. Pharm Rev 2009;10(3):144-9. 19. Nugroho AE, Riyanto S, Sukari MA, Maeyama K. Effects of aegeline,
a main alkaloid of Aegle marmelos Correa leaves, on the histamine release from mast cells. Pak J Pharm Sci 2011;24(3):359-67.
20. Blois MS. Antioxidant determination by the use of stable free radical. Nature 1958;29:1199-200.
Kumari DS. Assessment of in vitro antioxidant potential and quantification of total phenols and flavonoids of aqueous extract of
Phyllanthus amarus. Sri Krishna Devaraya University, Anantapur. Int J Pharm Pharm Sci 2015;7(9):439-45.
22. Ruch RJ, Cheng SJ, Klaunig JE. Prevention of cytotoxicity and inhibition of intercellular communication by antioxidant catechins isolated from Chinese green tea. Carcinogenesis 1989;10(6):1003-8. 23. Kiliçgün H, Altiner D. Correlation between antioxidant effect
mechanisms and polyphenol content of Rosa canina. Pharmacogn Mag 2010;6(3):238-41.
24. Kumaran A, Karunakaran RJ. Antioxidant activities of the methanolic extract of Cardiospermum halicacabum. Pharm Biol 2006;44(2):146-51.
25. Jainu M, Shyamala Devi CS. In vitro and in vivo evaluation of free radical scavenging potential of Cissus quadrangularis. Pharm Biol 2005;43(9):773-9.
26. Khanam S, Prasad, S.H.N. Devi K. Antioxidant activities of the methanolic extract of Cardiospermum halicacabum. Indian J Pharm. Educ 2004;38(4):180-83.
27. Fatima Z, Abderrahmane B, Seddik K, Lekhmici A. Antioxidant activity assessment of Tamus communis L. roots. Int J Pharm Pharm Sci 2016;8(12):64-71.
28. OECD Guidelines. OECD Guidelines for Testing of Chemicals, Test No. 425. Acute Oral Toxicity; 1996.
29. Ballantyne B, Timothy M, Turner P. General and Applied Toxicology. Abridged Edition. London: The Macmillan Press Limited; 1995. p. 53-6.
30. Krishna KL, Mruthunjaya K, Patel JA. Antioxidant and hepatoprotective potential of stem methanolic extract of Justicia gendarussa Burm. Int J Pharmacol 2010;6(2):72-80.
31. Srivastava A, Shivanandappa T. Hepatoprotective effect of the root extract of Decalepis hamiltonii against carbon tetrachloride-induced oxidative stress in rat. Food Chem 2010;118(2):411-7.
32. Ramachandra Setty S, Quereshi AA, Viswanath Swamy AH, Patil T, Prakash T, Prabhu K, et al. Hepatoprotective activity of Calotropis procera flowers against paracetamol-induced hepatic injury in rats. Fitoterapia 2007;78(7-8):451-4.
33. Sivakrishna S, Kottaimuthu A. In vivo antioxidant activity of ethanolic extract of aerial parts of Albizia procera roxb (Benth) against paracetamol induced liver toxicity in wistar rats. J Pharm Sci Res 2013;5(9):174-7.
34. Sumanth M, Ahmed R. Antihepatotoxic and antioxidant activity of root of Taraxacum officinale in CCl4-intoxicated rat. Pharmacogn Mag 2008;4(16):188-94.
35. Catherine W, Hosni MH. Introduction and inactivation of catalase and superoxide dismutase of Escherichia coli by ozone. Arch Biochem Biophys 1987;259(2):464-71.
36. Kono Y. Generation of superoxide radical during autoxidation of hydroxylamine and an assay for superoxide dismutase. Arch Biochem Biophys 1978;186(1):189-95.