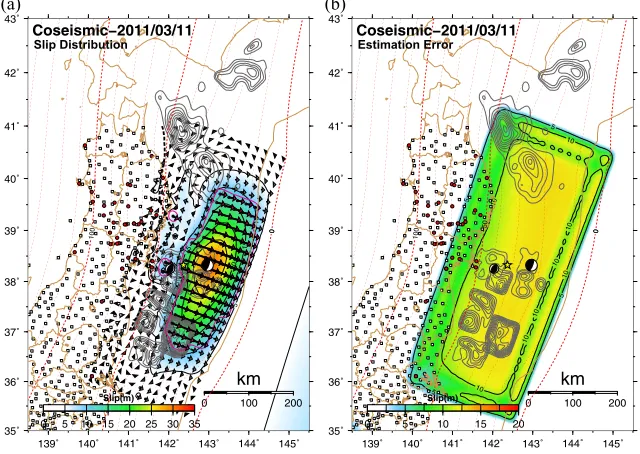
Coseismic slip distribution of the 2011 off the Pacific coast of Tohoku Earthquake (M 9 0) estimated based on GPS data—Was the asperity in Miyagi oki ruptured?
Full text
Figure


Related documents
Edwards‟s life, while it was chiefly Welsh, provides a clear example of the „British‟.. nature of
The bridge provided a crucial link across the River Tees to the emerging industrial works on the north bank of the river and beyond, and similarly provided
AOR: Adjusted odds ratio; APS: Attenuated psychotic symptoms; RMS: At risk mental state; BLIPS: Brief limited intermittent psychotic symptoms; CAARMS: Comprehensive Assessment of
One view that is prevalent is that whole genome amplification could be a very useful tool for the forensic geneticist. However, there is a wide range of different
If you call play on it again, you will notice that it makes the same rushing sound without the need to reset it, as we had to do with the Routine, since it will return a
struck me as pretentious and a therefore good source for a comedy character. It is always the case that the audience is willing to know more, and endure more, than the dramatist
486 Heidelberg Institute for International Conflict Research, ‘Heidelberg Institute for International Conflict Research Conflict Barometer’, 2019,
The key data sources for the economic cost calculations are again JICA (2000), which reports average values for coastal shipping costs per ton-km and mobilisation charges in 2000,