Clinical Ophthalmology
A single-center study evaluating the effect
of the controlled adverse environment (CAE
sm)
model on tear film stability
Richard Abelson1,2 Keith J Lane3 John Rodriguez3 Patrick Johnston3 Endri Angjeli3 George Ousler3 Douglas Montgomery1 1School of Computing, Informatics,
and Decision Systems Engineering, Arizona State University, 2Statistics
and Data Corporation, Tempe, AZ;
3Ora, Inc, Andover, MA, USA
Correspondence: Richard Abelson Statistics and Data Corporation, 21 E 6th St, Unit 110, Tempe, AZ 85281, USA
Tel +1 480 632 5468 Fax +1 480 632 5469 Email [email protected]
Purpose: To investigate use of an improved ocular tear film analysis protocol (OPI 2.0) in the Controlled Adverse Environment (CAESM) model of dry eye disease, and to examine the utility
of new metrics in the identification of subpopulations of dry eye patients.
Methods: Thirty-three dry eye subjects completed a single-center, single-visit, pilot CAE study. The primary endpoint was mean break-up area (MBA) as assessed by the OPI 2.0 system. Secondary endpoints included corneal fluorescein staining, tear film break-up time, and OPI 2.0 system measurements. Subjects were also asked to rate their ocular discomfort throughout the CAE. Dry eye endpoints were measured at baseline, immediately following a 90-minute CAE exposure, and again 30 minutes after exposure.
Results: The post-CAE measurements of MBA showed a statistically significant decrease from the baseline measurements. The decrease was relatively specific to those patients with moderate to severe dry eye, as measured by baseline MBA. Secondary endpoints including palpebral fissure size, corneal staining, and redness, also showed significant changes when pre- and post-CAE measurements were compared. A correlation analysis identified specific associations between MBA, blink rate, and palpebral fissure size. Comparison of MBA responses allowed us to identify subpopulations of subjects who exhibited different compensatory mechanisms in response to CAE challenge. Of note, none of the measures of tear film break-up time showed statistically significant changes or correlations in pre-, versus post-CAE measures.
Conclusion: This pilot study confirms that the tear film metric MBA can detect changes in the ocular surface induced by a CAE, and that these changes are correlated with other, estab-lished measures of dry eye disease. The observed decrease in MBA following CAE exposure demonstrates that compensatory mechanisms are initiated during the CAE exposure, and that this compensation may provide the means to identify and characterize clinically relevant sub-populations of dry eye patients.
Keywords: tear film break-up time, mean break-up area, interblink interval, controlled adverse environment, ocular protection index
Introduction
Dry eye disease is a term used to describe a collection of disorders with a shared diagnosis of tear film dysfunction that lead to decreased visual acuity, ocular pain, burning, and the potential for corneal scarring.1 Prevalence is highest in older
indi-viduals and in women, as well those who have previously undergone laser vision correction.1,2 The most recent reports suggest that moderate to severe dry eye currently
affects between 5 and 10 million Americans, with estimates of ten times that number
worldwide.2 Current treatments include artificial tears, tear plugs, or
immunosup-pressive drugs such as cyclosporine, but these treatments are often ineffective for
Dove
press
O R I G I n A L R E S E A R C h
open access to scientific and medical research
Open Access Full Text Article
Clinical Ophthalmology downloaded from https://www.dovepress.com/ by 118.70.13.36 on 21-Aug-2020
For personal use only.
Number of times this article has been viewed
This article was published in the following Dove Press journal: Clinical Ophthalmology
many dry eye sufferers, and so, the unmet need for new therapeutics is significant.2
Understanding of the pathophysiology of dry eye has advanced considerably in recent years, and what was once thought to be a condition due simply to insufficient tear pro-duction, is now recognized as a multifactorial collection of diseases.3 This is a result of significant strides in ocular surface
biology research, and improvements in clinical assessment techniques such as, corneal staining, blink pattern analysis, and various measures of tear film stability.4,5 In two recent papers
we described the stepwise development of our improved method of tear film analysis, which we have designated the ocular tear film analysis protocol OPI 2.0 (Ora, Inc. Andover MA, USA; patent pending) system.6,7 This method combines a number of
optimized parameters with automated video data capture and analysis, to generate a more objective, quantitative measure of tear film dynamics. These improvements have the poten-tial to substanpoten-tially enhance tear film metrics, and represent a key advance over previous methods of tear film analysis.
Tear film stability and blink behavior are inexorably linked. The tear film is established by the sweeping, squeegee-like action of the lids, and the rate and pattern of blinks is in turn, modulated by feedback from corneal sensory nerves.3,8 Efforts to measure properties of the
tear film led to the development of the tear film break-up time (TFBUT), a method of analysis in which subjects are asked to refrain from blinking while an observer monitors the integrity of the tear film.8 This “forced stare” approach
allowed the first estimates of inherent tear film stability and provided the means for addressing the impact of different disorders, drug treatments, or environmental conditions, on the physiochemical properties (and therefore, functional attributes) of the tear film.1,4 The standard values developed
for use with this method were .10 seconds for normal
sub-jects, and ,10 seconds for subjects with dry eye.1,4
More recently, studies have identified limitations to both the method used to measure TFBUT, as well as the metric itself. For example, it was found that reduction and standardization of the quantity of fluorescein used, led to a shift of the reference values for TFBUT (to a mean value of 7 seconds for normal subjects, and 2.5 seconds for those with dry eye).5 Similarly, our goal in developing the OPI
2.0 system was to enhance and streamline dry eye metrics by measuring tear film stability under conditions of natural, rather than forced stare blinking.6,7 Furthermore, by capturing
the natural dynamics of the tear film with automated methods, it is possible to expand upon previous studies of the interac-tion between blinking and tear film behavior.8–13
Blinking is a reflex function regulated by the combination of autonomic inputs and sensory feedback about
environ-mental conditions.14 Blink rate is known to increase under
adverse conditions such as those presented by the Controlled
Adverse Environment (CAESM), a clinical model that
repro-duces a standard ocular challenge (by regulation of humidity, temperature, airflow, lighting conditions, and visual tasking) for the investigation of treatments for dry eye.1,4,13,15,16 Our
early assessments of both blink behavior and tear film stability led to our development of the Ocular Protection Index (OPI), a tool used in observational and clinical studies of dry eye, to
evaluate the interaction between blinking and TFBUT.9,13–16
We defined OPI as the ratio of interblink interval (IBI) and TFBUT; lower values of the index and particularly values less than one, were associated with increased risk of keratitis (since on average, break-up of the tear film and subsequent corneal exposure would occur prior to the next blink).9 Our
more recent studies employed break-up and blink data cap-tured with the OPI 2.0 system, to yield another estimate of corneal surface exposure.7 This alternative index relied upon
the mean break-up area (MBA) rather than a break-up time elicited under forced stare conditions.6
The OPI 2.0 system was designed to evaluate ocular surface protection under a normal blink pattern and normal visual conditions, using fully automated software algorithms that provide real-time measurement of corneal exposure.7
This system provides a simultaneous measurement of both break-up area and blink rate. Video capture allows calcula-tion of a mean corneal surface exposure (we abbreviate this as mean break-up area, MBA) as well as additional metrics, such as palpebral fissure width. In an initial paper, we showed that video capture of MBA and blink rates was superior to the combination of forced stare TFBUT and IBI in distinguishing normal subjects from those with signs and symptoms of dry eye.6 In a second paper, we demonstrated that our automated
method provided accurate, reliable measures of corneal surface exposure, and again showed that these values could be used to distinguish between normal subjects and subjects with dry eye.7
In this study, we explored the ability of the OPI 2.0 system to identify the changes and modifications of the tear film after exposing dry eye subjects to the CAE. A key aspect of the CAE is its utility in distinguishing subpopulations of dry eye patients. Subjects challenged by environmental changes (such as those presented by the CAE) normally respond with some degree of physiological compensation, and previous studies have shown that the ability of these mechanisms to adequately compensate for environmental
Dovepress
Abelson et al
Clinical Ophthalmology downloaded from https://www.dovepress.com/ by 118.70.13.36 on 21-Aug-2020
challenges is reduced in those with dry eye.17 Therefore, the
nature and extent of the compensatory response will likely be a reflection of the underlying tear film pathology. These compensatory mechanisms, such as changes in blink rate or reflex tearing, are likely to have an impact on properties that are measured using the OPI 2.0 system. Our primary goal in developing new and refined metrics was their use as tools to identify and characterize patient subpopulations, particularly in multifactorial diseases such as dry eye. As the next step in the validation of OPI 2.0 System-based measures, we examined dry eye subjects before, immediately after, and 30 minutes after a 90-minute CAE challenge.
Methods
Inclusion criteria
Subjects were recruited from an existing database of dry eye patients, and a total of 33 subjects were enrolled. Criteria for inclusion in the database included a history of dry eye, use of artificial tears, and a Schirmer’s test score4 of ,5 mm
in at least one eye. Enrolled subjects were at least 18 years of age, had a history of use, or desire to use an eye drop for dry eye symptoms within the past 6 months, and had a best cor-rected visual acuity of +0.7 or better in both eyes, as assessed by the Early Treatment of Diabetic Retinopathy Study scale. Subjects also had to satisfy each of the following criteria at
baseline: a forced stare TFBUT score of ,5 seconds in at
least one eye; a deficient OPI (,1) during at least 30% of
interblink intervals, as determined by a trained technician;
and a total corneal fluorescein staining score of $3, based
on the sum of the central, superior, and inferior regions of the cornea, as defined by the Ora scale (see below).
Exclusion criteria
Subjects were excluded from the study if they had clini-cally significant anterior blepharitis in the opinion of the
investigator; were diagnosed with ongoing ocular infection (bacterial, viral, or fungal), or active ocular inflammation (eg, follicular conjunctivitis); wore contact lenses in the previous week; had used any eye drop in the 4 hours prior to the study; had previously undergone laser in situ keratomileusis surgery, or any other ocular surgery in the past year; were currently taking any topical ophthalmic prescription, or over-the-counter solutions, artificial tears, gels or scrubs that could not be discontinued for the duration of the trial; had used
Restasis® in the previous 30 days; had a systemic disease,
or uncontrolled medical condition that could interfere with study measurements or subject compliance; were currently pregnant or nursing; or had received an experimental drug or device within 30 days prior to the visit.
Study design
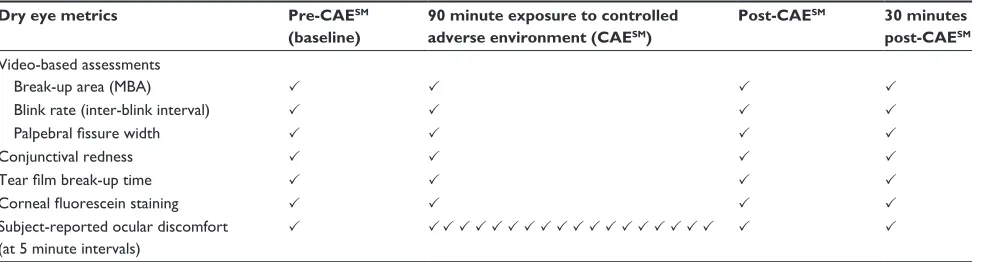
This was a single-center study, conducted in a single visit that included a 90-minute session in the CAE. Written informed consent was obtained prior to study procedures. Patient-reported and investigator-observed adverse events were captured and monitored for the duration of the study. A summary of the protocol, including the tests which were conducted, is shown in Table 1. The primary endpoint for this study was MBA prior to CAE exposure compared with MBA immediately and 30 minutes post-CAE exposure. Secondary endpoints included fluorescein staining, TFBUT, and redness prior to CAE compared with fluorescein staining, TFBUT, and redness immediately- and 30 minutes post- CAE exposure. The scoring of corneal staining was based on a 5-point Ora scale (0–4) where 0 = no staining and 4 = confluent fluorescein staining across the entire cornea. Redness was scored using a 5-point Ora scale (0–4), where 0 = no detectable vasodilation and 4 = broad, prominent ciliary and conjunctival vasodilation. Both scales have been used previously.15,16 Additional secondary endpoints
Table 1 Overview of study protocol
Dry eye metrics Pre-CAESM
(baseline)
90 minute exposure to controlled adverse environment (CAESM)
Post-CAESM 30 minutes post-CAESM Video-based assessments
Break-up area (MBA)
Blink rate (inter-blink interval)
Palpebral fissure width
Conjunctival redness
Tear film break-up time
Corneal fluorescein staining
Subject-reported ocular discomfort (at 5 minute intervals)
Note: Tests were conducted in the order shown at the three time points.
Abbreviation: MBA, mean break-up area.
Dovepress Effect of the controlled adverse environment on tear film stability
Clinical Ophthalmology downloaded from https://www.dovepress.com/ by 118.70.13.36 on 21-Aug-2020
included video-based measurements (including IBI and palpebral fissure width), as well as TFBUT, collected at all three time points.
Statistical analysis
Thirty-three subjects were enrolled in the study. Of the 66 eyes under study, 65 provided readable videos, and data from these 65 eyes comprised the complete analysis sample. All 33 subjects in the intent-to-treat population met the require-ments of the protocol criteria. We also analyzed subgroups that were defined by their baseline MBA measure. The first of these were subjects with an initial MBA (MBAI) . 0.2, a value used to identify those with moderate to severe dry eye. This cutoff was based on previously published studies that showed subjects who reported dry eye signs and symptoms
had a mean MBA score of 0.232.5 Demographic variables
(age, sex, duration of dry eye disease) were summarized by means and standard deviations. An additional measure, ocular discomfort, was provided by the subjects and was collected every 5 minutes during the 90-minute CAE, using a 5-point ordinal scale. Subjects scored their discomfort, and these measurements were used to calculate average discomfort during the CAE, and tearing. We defined tearing as the time at which discomfort either reduced or reached a plateau at a value less than the maximum, based upon previous studies demonstrating that this plateau is associated with a compen-satory tearing response.17
For those variables with long right-tailed distributions (including MBA, OPI2, blink rate, IBI, palpebral fissure, and break-up time) we used a gamma multiplicative model to obtain estimates for pre-CAE and post-CAE means, ratios
of means, 95% confidence intervals, and P-values for tests
of equality. Corneal fluorescein staining and conjunctival redness were analyzed using normal linear models. We used a generalized estimating equation to accommodate the within-subject correlation between eyes for both models. For the latter purpose, a sandwich variance was used in conjunction with a working independence correlation
structure. All models were fit using the Genmod module of
SAS version 9.2 (SAS Institute Inc, Cary, NC).18
For variables measured pre- and post-CAE, bivariate relationships were obtained via correlations between change scores (eg, post-CAE MBA minus pre-CAE MBA versus pre-CAE blink rate minus post-CAE blink rate). These change scores were also correlated with variables collected in the CAE (average discomfort, and tearing [score = 1 if there was tearing
within 90 minutes, score = 0 otherwise]), and demographic
variables of age, duration of dry eye disease, and gender.
Table 2 Study populations: demographics and initial MBA values*
Subjects Age ± SD % male Years with dry eye
MBAI
All eyes (n = 65) 64.1 ± 10.8 34 13.4 ± 12.4 0.55 ± 0.85 MBA . 0.5 (n = 19) 61.9 ± 14.4 21 14.5 ± 14.8 1.51 ± 1.05 MBA . 0.2 (n = 35) 64.5 ± 12.2 40 14.2 ± 14.5 0.96 ± 0.98 MBA , 0.5 (n = 46) 64.9 ± 9.0 39 13.0 ± 11.4 0.15 ± 0.14 MBA , 0.2 (n = 30) 63.6 ± 9.0 27 12.4 ± 9.5 0.06 ± 0.06
Note: Expressed as mean values ± SD.
Abbreviations: MBA, mean break-up area; MBAI, initial mean break-up area.
Results
In this single-visit study, we examined the effect of the CAE on MBA for subjects with confirmed dry eye disease. A total of 33 dry eye subjects completed the study and data from 65 qualified eyes were entered into the analysis algorithm. One video file was corrupted during the course of collection and could not be included in the analysis. No treatment was administered in the course of the study.
The demographics of the study populations were gener-ally representative of the larger population of all dry eye
patients.1 The study population was 34% male, had a mean
age of 64 years, and had experienced dry eye disease for an average of 13.4 years; a similar demographic profile also described all of the subpopulations analyzed in this study, as summarized in Table 2.
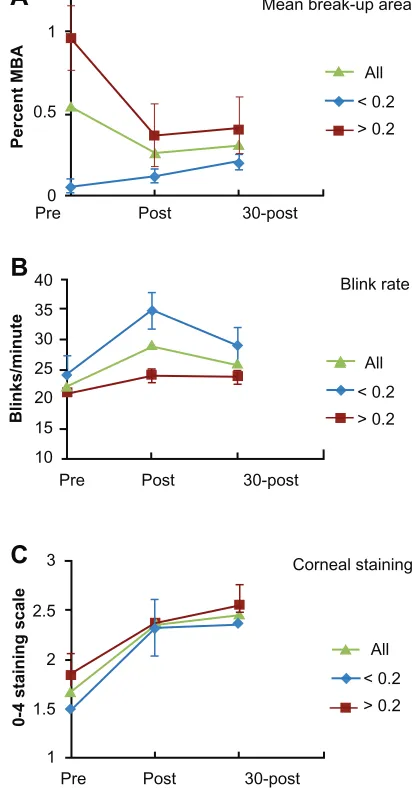
The primary endpoint was the change in MBA measured at baseline, immediately following CAE, and 30 minutes after
exposure to the CAE, for subjects with MBAI measures of
0.2 or greater. The change in MBA for three subject popula-tions (all subjects, MBAI scores , 0.2, MBAI scores . 0.2) is shown in Figure 1A. Subjects with higher MBAI are
those with more severe dry eye,7 and we found that in this
population, as well as in the entire subject population, exposure to the CAESM caused a significant decrease in MBA.
This figure also shows that for those subjects with less severe
dry eye (MBAI, 0.2), there was a trend toward increased
MBA which was not statistically significant.
Figure 1B and C show comparisons of two additional met-rics in these three populations: blink rate and corneal staining. The change in blink rate that was observed over the course of the study is interesting in that while the population as a
whole increased significantly, the group with MBAI. 0.2
did not exhibit this increase (Figure 1B and Table 2). Corneal fluorescein staining was noteworthy for two reasons. First,
the difference between those with MBAI. 0.2 and those
with MBAI , 0.2 was significant (P ,0.001), consistent with our premise that those with higher MBA scores have more severe dry eye (Table 2). Second, all subjects showed
Dovepress
Abelson et al
Clinical Ophthalmology downloaded from https://www.dovepress.com/ by 118.70.13.36 on 21-Aug-2020
significant increases in staining over the course of the visit, as expected for exposure to the CAE (Figure 1C, Table 3). Of note, this increase in corneal staining occurred regardless of the change in MBA observed for all subjects.
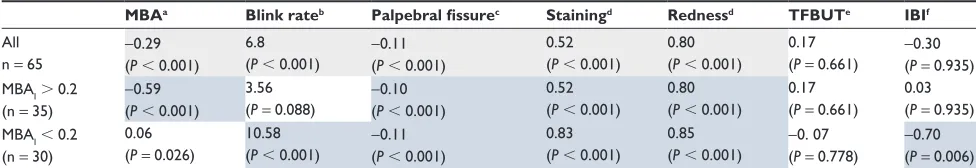
Secondary endpoints included blink rate, palpebral fissure size, corneal staining, conjunctival redness, TFBUT, and IBI. The mean values for these parameters are shown in
Table 3; differences and P-values between pre-CAESM and
post-CAESM values are shown in Table 4.
The major finding was the statistically significant decrease in the MBA immediately following CAE exposure. MBA values 30 minutes post-CAE were also significantly lower
than baseline, although there was some recovery between the two post-CAE time points. As expected, both fluorescein staining and redness increased with CAE exposure (Tables 3 and 4). Blink rate and palpebral fissure width also decreased significantly across the population, at both post-CAESM times.
In contrast, mean IBI and TFBUT changed only minimally, and not significantly. Table 4 summarizes the difference scores for all endpoints, and shows the same pattern of sig-nificance for primary and secondary endpoints seen in mean value comparisons.
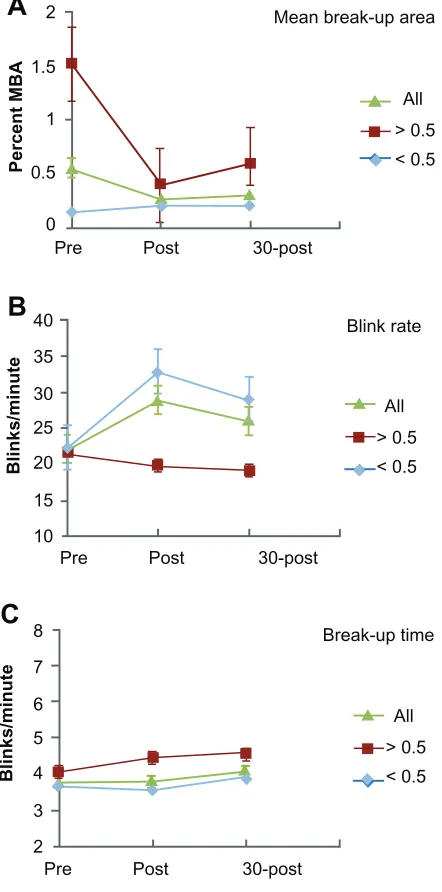
Based upon the pattern of decreased MBA and increased blink rates, we examined a second set of subpopulations
that were defined using a higher threshold of MBAI (.0.5;
n = 19). Even at this higher threshold, all subjects who dis-played a decrease in MBA were included. These subjects had a higher initial corneal staining score, and exhibited a pronounced decrease in MBA in response to CAE exposure (Table 4, Figure 2A). Analysis of these subpopulations
(initial MBA . 0.2 or . 0.5) suggests that the MBA metric
may provide the means to distinguish between individuals
who respond in the CAESM with differing compensatory
mechanisms. Comparison of subjects with either high or low MBA showed that there was a clear, statistically significant difference in the way these two groups responded to the
CAESM. Figures 1A and 2A show that the decrease in MBA
observed in the full study population was entirely due to the decrease observed in the subpopulation with the higher
MBAI, and that for the two lower MBAI groups, the mean
value increased slightly over the course of the CAESM
expo-sure (Table 4). A second distinction between those with low versus high initial MBA values is shown in Figures 1B and
2B; despite a decrease in MBA during the CAESM, subjects
with high MBA values showed no change in blink rate, while those with low initial MBA values increased their blink rate in
the CAESM by almost 50% (Table 4). Reduction in palpebral
fissure accompanied this increase in blink rate. While it is reasonable to point out that the largest decrease in MBA may simply be due to a high MBAI, the differences in blink rates clearly represent a difference in compensatory responses.
TFBUT has been used as a standard metric in dry eye studies for many years, but in this study did not reflect the
changes in dry eye signs and symptoms resulting from CAESM
exposure. Figure 2C and Tables 3 and 4, show that none of the populations examined in this study showed a significant change in TFBUT, despite the fact that other metrics associ-ated with dry eye, including corneal staining, ocular redness, and discomfort (not shown) increased over the time course of the CAESM.
1
0 0.5
40 35 30 25 20 15 10
3
2.5
1.5
1 2
Post
0-4 staining scale
Percent MB
A
30-post Pre
Blinks/minut
e
Post 30-post Pre
Post 30-post
Corneal staining Blink rate Mean break-up area
A
B
C
All < 0.2 > 0.2 All < 0.2 > 0.2 All < 0.2 > 0.2
Pre �
� �
�
� �
�
�
�
� �
� � �
� �
�
� �
�
� �
�
�
�
Figure 1 A Comparison of endpoints before and after CAESM exposure.
Notes: Graphsshow mean values (±SD) for the three endpoints in the total population, as well as for subjects with MBAI. 0.2 (severe dry eye), and MBAI
, 0.2 (moderate dry eye). (A) Decrease in MBA was limited to subjects with MBAI
. 0.2. (B) Compensatory increases in blink rates were primarily seen in subjects with MBAI,0.2. (C) All subjects experienced similar increases in corneal staining.
Abbreviations: CAESM, controlled adverse environment; MBA, mean break-up
area; MBAI, initial mean break-up area.
Dovepress Effect of the controlled adverse environment on tear film stability
Clinical Ophthalmology downloaded from https://www.dovepress.com/ by 118.70.13.36 on 21-Aug-2020
We next did a correlation analysis to test whether specific endpoints might show an association with MBA changes; these data are summarized in Table 5 for the population as a whole, and for the subpopulation of subjects with MBAI. 0.2. Of the endpoints analyzed, only tearing and blink rate (and the related parameter, IBI) were significantly correlated with MBA measures. In addition, all endpoints except IBI showed a positive correlation with MBA in the full study population. When this same analysis was applied to the high and low MBA subpopulations, the correlation between blink rate and MBA was restricted to the high MBA population, while subjects in the low MBA population exhibited an inverse correlation with these two parameters. This distinction indicates that the
two subpopulations may be responding to the CAESM with
different compensatory mechanisms. Collectively our results suggest that subjects in the low MBA group respond to the effects of the CAESM, at least in part, by increasing their blink
rate, while the high MBA group does not. Despite this lack of change in compensatory metrics, subjects in the high MBA group exhibited a significant decrease in MBA and therefore
are clearly responding to the CAESM in some way.
Throughout the course of CAESM exposure, subjects were
asked to rate their ocular discomfort (not shown). The values for all groups displayed a slow, consistent increase in scores over the time course of the CAESM, but none of the differences
between group scores were statistically significant at any time point (that is, discomfort could not explain the differences in responses seen in the two groups).
Discussion
Dry eye disease is an exceedingly complex disease because of its variety of etiologies and the overlapping, interacting sensory elements and response mechanisms required for an optimally-tuned tear film. The identification of endpoints that are both meaningful and measurable has been problematic. The study presented here represents one step in the process of establishing robust quantitative metrics for clinical studies. Our goal was to identify measures that would be responsive in clinical models designed to replicate the disease process, and that could distinguish between the subpopulations that are characteristic of this disease. The data presented here demonstrated that the OPI 2.0 system and the measure of
Table 3 CAESM effects on measures of dry eye
MBAa Blink rateb Palpebral fissurec
Corneal stainingd
Rednessd TFBUTe IBIf
All eyes (n =65)
Pre-CAESM 0.55 ± 0.85 22.21 ± 10.3 1.34 ± 0.19 1.68 ± 0.53 1.53 ± 0.47 3.77 ± 1.89 3.6 ± 1.8
Post-CAESM 0.26 ± 0.35g 29.01 ± 16.0 1.24 ± 0.18g 2.34 ± 0.45g 2.35 ± 0.56g 3.82 ± 1.56 3.29 ± 2.0
30 min post-CAESM
0.31 ± 0.52h 26.15 ± 12.6h 1.28 ± 0.21g 2.46 ± 0.39g 2.22 ± 0.65g 4.09 ± 2.22 3.35 ± 2.2
MBAI. 0.2 (n = 35)
Pre-CAESM 0.96 ± 0.98 20.56 ± 9.1 1.35 ± 0.21 1.85 ± 0.54 1.67 ± 0.48 3.89 ± 1.99 3.82 ± 1.91
Post-CAESM 0.37 ± 0.41g 24.12 ± 12.9 1.25 ± 0.20g 2.37 ± 0.49g 2.47 ± 0.54g 4.05 ± 1.78 3.85 ± 2.23
30 min post-CAESM
0.41 ± 0.51g 23.73 ± 10.9 1.33 ± 0.22 2.55 ± 0.40* 2.41 ± 0.60g 4.21 ± 2.47 3.61 ± 2.4
Notes: Mean values ± standard deviation. a% of corneal surface; bblinks/sec; ccentimeters; dOra 0–4 scale; eseconds; f1/seconds; gP,0.001; hP,0.01 as compared with
pre-CAE value.
Abbreviations: MBAI, initial mean break-up area; MBA, mean break-up area; TFBUT, tear film break-up time; IBI, interblink interval; CAESM, controlled adverse
environment.
Table 4 Difference values for primary and secondary endpoints in different subpopulations
MBAa Blink rateb Palpebral fissurec Stainingd Rednessd TFBUTe IBIf All
n = 65
-0.29 (P , 0.001)
6.8 (P , 0.001)
-0.11 (P , 0.001)
0.52 (P , 0.001)
0.80 (P , 0.001)
0.17 (P = 0.661)
-0.30 (P = 0.935) MBAI. 0.2
(n = 35)
-0.59 (P , 0.001)
3.56 (P = 0.088)
-0.10 (P , 0.001)
0.52 (P , 0.001)
0.80 (P , 0.001)
0.17 (P = 0.661)
0.03 (P = 0.935) MBAI, 0.2
(n = 30)
0.06 (P = 0.026)
10.58
(P , 0.001) -0.11 (P , 0.001)
0.83 (P , 0.001)
0.85
(P , 0.001) -0. 07 (P = 0.778)
-0.70 (P = 0.006)
Notes: Values represent the change from pre- to post-Controlled Adverse Environment measures. a% of corneal surface; bblinks/sec; ccentimeters; dOra 0–4 scale; eseconds; f1/seconds. Subpopulations are based upon the initial mean break-up area measure. Shaded areas highlight statistically significant changes in subpopulations.
Abbreviations: MBA, mean break-up area; TFBUT, tear film break-up time; IBI, interblink interval; MBAI, initial mean break-up area.
Dovepress
Abelson et al
Clinical Ophthalmology downloaded from https://www.dovepress.com/ by 118.70.13.36 on 21-Aug-2020
40
35
30 25
20
15
10
Post 30-post
Pre
Post 30-post
Pre
Blinks/minute
Break-up time Blink rate Mean break-up area
B
A
8
7
6 5 4
3
2
Blinks/minute
C
All > 0.5 < 0.5 All > 0.5 < 0.5
All > 0.5 < 0.5 2
1.5
0.5
0 1
Percent MBA
Post 30-post
Pre
� � �
� �
� �
� �
� �
�
�
�
�
�
� � �
�
�
�
�
� �
� �
�
Figure 2 Subpopulation comparisons.
Notes: Graphsshow mean values (±SD) pre, immediately post and 30 min post CAESM for two alternative subpopulations of subjects with MBA
I. 0.5 (n = 19) and
MBAI, 0.5 (n = 46). (A) and (B) show that the decrease in MBA in the “severe”
subpopulation was primarily seen in subjects with the highest MBAI (.0.5) who did
not respond to the CAE with increased blink rates (seen in subjects with milder dry eye). Panel (C) shows that forced stare TFBUT was not altered in the total population, nor in these subgroups.
Abbreviations: MBA, mean break-up area; MBAI, initial mean break-up area;
CAESM, controlled adverse environment; TFBUT, tear film break-up time.
Table 5 Pearson correlation coefficients between MBA and secondary endpoint measures
Tearing Blink rate Fissure Staining Redness TFBUT IBI
MBAI. 0.2 (n = 35)
0.336 (P = 0.048)
0.399 (P = 0.0174)
0.203 (P = 0.242)
-0.194 (P = 0.234)
0.263 (P = 0.127)
-0.162 (P = 0.353)
-0.344 (P = 0.043) All subjects
(n = 65)
0.177 (P = 0.159)
0.338 (P = 0.0059)
0.141 (P = 0.260)
0.0169 (P = 0.894)
0.183 (P = 0.145)
-0.151 (P = 0.230)
-0.341 (P = 0.005)
Note: Significant values (P,0.05) are shaded.
Abbreviations: MBA, mean break-up area; TFBUT, tear film break-up time; IBI, interblink interval; MBAI, initial mean break-up area.
MBA can provide the assessment tools necessary to meet this goal.
The key finding of this study was that the metric of MBA was shown to identify subpopulations of dry eye subjects who displayed distinct compensatory mechanisms when challenged with an adverse environment. In contrast, the traditional metric of tear film stability, TFBUT, was not sig-nificantly altered by CAESM exposure. Patients also exhibited
significant increases in corneal staining, ocular redness, and decreases in palpebral fissure width, which are all characteris-tic of dry eye disease. Thus, in a clinical model which reliably elicits signs and symptoms of dry eye disease, MBA provided a useful new metric that was superior to TFBUT.
Patients completing the CAESM exposure fell into two
groups. The first group, which comprised about 70% of all subjects, was distinguished by a relatively stable MBA that was maintained in part, by an increase in blink rate and a decrease in palpebral fissure width. These changes indicated they were able to respond to the environmental challenge with these (and perhaps other) mechanisms in order to maintain a relatively constant corneal surface exposure, as measured by MBA. The remaining 30% of subjects began the study with levels of corneal staining similar to the low MBA group despite a baseline MBA that was 10-fold higher. Subjects in this group responded to the CAE by lowering their MBA more than 3-fold during the course of the CAE exposure. While we speculate that this response employed some com-bination of increased tearing, mucin secretion, or meibum expression, our study did not examine these specific tear film parameters. The net effect of their response however was evidenced by the fact that corneal staining between the two groups was comparable. Future studies will benefit from inclusion of techniques that can monitor changes in these tear film components during the course of CAE exposure.
Our study has direct impact on the design of therapeutic development strategies going forward. First, we provided direct evidence that break-up area, and not break-up time, is the more valuable parameter in studies of induced dry eye disease. Second, we established that the metrics of the
Dovepress Effect of the controlled adverse environment on tear film stability
Clinical Ophthalmology downloaded from https://www.dovepress.com/ by 118.70.13.36 on 21-Aug-2020
Clinical Ophthalmology
Publish your work in this journal
Submit your manuscript here: http://www.dovepress.com/clinical-ophthalmology-journal Clinical Ophthalmology is an international, peer-reviewed journal covering all subspecialties within ophthalmology. Key topics include: Optometry; Visual science; Pharmacology and drug therapy in eye diseases; Basic Sciences; Primary and Secondary eye care; Patient Safety and Quality of Care Improvements. This journal is indexed on
PubMed Central and CAS, and is the official journal of The Society of Clinical Ophthalmology (SCO). The manuscript management system is completely online and includes a very quick and fair peer-review system, which is all easy to use. Visit http://www.dovepress.com/ testimonials.php to read real quotes from published authors. OPI 2.0 system can distinguish subpopulations of subjects
who are likely to require different therapeutic strategies for successful amelioration of their dry eye signs and symptoms. An important next step in the refinement of the OPI 2.0 sys-tem will be to associate the subgroups identified using metrics such as MBA, with clinically relevant patient populations.
Disclosure
The authors reported no conflicts of interest in this work.
References
1. The definition and classification of dry eye disease: report of the Definition and Classification Subcommittee of the International Dry Eye WorkShop (2007). Ocul Surf. 2007;5(2):75–92.
2. Pflugfelder SC. Prevalence, burden, and pharmacoeconomics of dry eye disease. Am J Manag Care. 2008;14(3 Suppl):S102–S106.
3. Stevenson W, Chauhan SK, Dana R. Dry eye disease: an immune-mediated ocular surface disorder. Arch Ophthalmol. 2012;30(1): 90–100.
4. Ousler GW, Gomes PJ, Welch D, Abelson MB. Methodologies for the study of ocular surface disease. Ocul. Surf. 2005;3(3):143–154. 5. Abelson MB, Ousler GW, Nally LA, Welch D, Krenzer K. Alternative
reference values for tear film break up time in normal and dry eye populations. In: Sullivan DA, Stern ME, Tsubota K, et al. editors.
Lacrimal Gland, Tear Film, and Dry Eye Syndromes 3, Part B: Basic Science and Clinical Relevance. New York: Kluwer Academic/Plenum P; 2002:1121–1125.
6. Abelson R, Lane KJ, Angjeli E, Johnston P, Ousler G, Montgomery D. Measurement of ocular surface protection under natural blink conditions.
Clin Ophthalmol. 2011;5:1349–1357.
7. Abelson R, Lane KJ, Rodriguez J, et al. Validation and verification of the OPI 2.0 System. Clin Opthalmol. 2012;6:613–622.
8. Methodologies to diagnose and monitor dry eye disease: report of the Diagnostic Methodology Subcommittee of the International Dry Eye Workshop (2007). Ocul Surf. 2007;5(2):108–152.
9. Ousler GW 3rd, Hagberg KW, Schindelar M, Welch D, Abelson MB. The Ocular Protection Index. Cornea. 2008;27(5):509–513. 10. Ousler GW, Michaelson C, Christensen MT. An evaluation of tear film
breakup time extension and ocular protection index scores among three marketed lubricant eye drops. Cornea. 2007;26(8):949–952. 11. Simmons PA, Vehige JG. Clinical performance of a mid-viscosity
artificial tear for dry eye treatment. Cornea. 2007;26(3):294–302. 12. Torkildsen GL, Ousler GW 3rd, Gomes P. Ocular comfort and drying
effects of three topical antihistamine/mast cell stabilizers in adults with allergic conjunctivitis: a randomized, double-masked crossover study.
Clin. Ther. 2008;30(7):1264–1271.
13. Rolando M, Autori S, Badino F, Barabino S. Protecting the ocular surface and improving the quality of life of dry eye patients: a study of the efficacy of an HP-guar containing ocular lubricant in a population of dry eye patients. J Ocul Pharmacol Ther. 2009;25(3):271–278. 14. Cruz AA, Garcia DM, Pinto CT, Cechetti SP. Spontaneous eyeblink
activity. Ocul Surf. 2011;9(1):29–41.
15. Semba CP, Torkildsen GL, Lonsdale JD, et al. A phase 2 random-ized, double-masked, placebo-controlled study of a novel integrin antagonist (SAR 1118) for the treatment of dry eye. Am J Ophthalmol. 2012;153(6):1050–1060.
16. Patane MA, Cohen A, From S, Torkildsen G, Welch D, Ousler GW 3rd. Ocular iontophoresis of EGP-437 (dexamethasone phosphate) in dry eye patients: results of a randomized clinical trial. Clin Ophthalmol. 2011;5:633–643.
17. Ousler GW, Abelson MB, Nally LA, et al. Evaluation of the time to “natural compensation” in normal and dry eye subject populations during exposure to a controlled adverse environment. In: Sullivan DA, Stern ME, Tsubota K, et al, editors. Lacrimal Gland, Tear Film, and Dry Eye Syndromes 3, Part B: Basic Science and Clinical Relevance. New York: Kluwer Academic/Plenum P; 2002:1057–1063.
18. SAS Institute Inc. 2009. SAS OnlineDoc® 9.2. Cary, NC: SAS Institute Inc.
Dovepress
Dove
press
Abelson et al
Clinical Ophthalmology downloaded from https://www.dovepress.com/ by 118.70.13.36 on 21-Aug-2020