The influence of distance between vehicles in platoon on
aerodynamic parameters
Renata Gnatowska1*, Marcin Sosnowski2
1Czestochowa University of Technology, Faculty of Mechanical Engineering and Computer Science, 21 Armii Krajowej Av, 42-200 Czestochowa, Poland
2Jan Dlugosz University in Czestochowa, Faculty of Mathematics and Natural Sciences, 13/15 Armii Krajowej Av, 42-200 Czestochowa, Poland
Abstract. The paper presents the results of experimental and numerical research focused on the reduction of fuel consumption of vehicles driving one after another in a so-called platoon arrangement. The aerodynamic parameters and safety issues were analyzed in order to determine the optimal distance between the vehicles in traffic conditions. The experimental research delivered the results concerning the drag and was performed for simplified model of two vehicles positioned in wind tunnel equipped with aerodynamic balance. The additional numerical analysis allowed investigating the pressure and velocity fields as well as other aerodynamics parameters of the test case.
1 Introduction
The basic role of platooning in driving at a short intermediate distance between the vehicles in tandem arrangement results in a considerable reduction in drag coefficient and finally fuel consumption for the cars. Results of other researches showed also that 20% of emission reduction, 10% reduction in death rate and a smoother traffic flow with potential increase in traffic flow can be achieved through vehicle platooning. On the other hand, by growing the traffic complexity, the action of one vehicle may affect all the others vehicles in a group. Therefore, safety limits of distance of one car to another vehicle become a challenge. Aerodynamic parameters of two objects (cubes, cylinders, other shapes) in platooning arrangement were investigated previous by many researchers [1-5]. From these research the drag coe�cient of the follower body was bigger than that of the leading one at near inter-vehicle distances. Research on the effect of vehicles spacing on the drag coefficient with vehicles in platooning was published by Zabat et al. [1]. For all cases, the drag coefficient of the follower object was bigger than that of the leader one at close inter-vehicle distances (x/L < 0.35). Browand, Hammache et al. [4, 5] have investigated the interaction of two truck vehicles with various combinations of bodies geometry. They observed, that for the cases with sharp corners in front of the leading vehicle, the drag coefficient of the leading body is higher than that of the one in isolation. Watkins and Vino [6] have studied the e�ect of distances between two vehicles on the lift and drag coe�cients. Their experiment showed that the drag force of the follower body increases for spacing of 0.1-1.0, compared to the corresponding drag value of a single body in isolation. Mirzaei et. al. [7, 8]
numerically analysed the e�ect of inter-vehicle distance on the ow structure of two vehicles in platoon. Large Eddy Simulations were made for two Ahmed bodies for three inter-vehicle distances, x/L = 0.3, 0.5 and 1 at Re = 30000. A sudden increase of the drag coe�cient was observed for the follower with x/L = 0.5, compared to the drag value of a single body in isolation.
The objective of this paper is to provide a detailed experimental and numerical analysis of the flow interactions of vehicles driving one after another in a so-called platoon arrangement. The main aim is to clarify the increase of the drag force of the follower vehicle at some particular close distances, found in the experiment part of the present investigation. Accurate numerical simulations at three different distances are performed to describe the flow structures around the body and to hopefully obtain more information about the reasons causing the change of the drag coefficient.
2 Description of the work
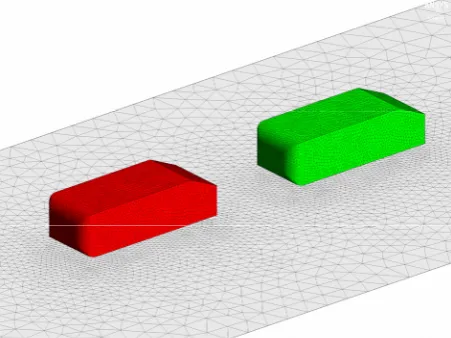
The research concerns numerical and experimental investigations of the pressure and velocity fields as well as other aerodynamics parameters between two vehicles in platoon arrangement. The vehicles are represented by Ahmed bodies [9]. Two identical bodies are used as the test models. The Ahmed body is one of the most popular models employed as a simplified vehicle shape to predict the fundamental flow physics associated with vehicles’ wake. The original shape of the body and flow structure around it can be found in [9]. The dimension of the analysed bodies used in the research are 261×97,25×72 mm (LxWxH) and the frontal area is 0.007m2. The slant
bodies S is varied in the range of S=0÷1.2L (L is the body length). The investigation of both of the bodies (leading or trailing) are compared to the drag coefficient of a single body in isolation.
2.1 Experimental setup
The experimental measurements are made in the open-circuit wind tunnel facility of the Institute of Thermal Machinery, Czestochowa University of Technology. The test section of the wind tunnel is characterized by cross-section of 1m2 and 10m length. The maximum inlet
velocity of air in the wind tunnel is 8m/s resulting in the Reynolds number of 1,4 × 10⁵, based on the length of the
body. Air pressure and temperature are measured continuously during wind tunnel operation. Schematic view of the test section is presented in Figure 1. The vehicle models (Ahmed bodies) are made of wood and are aligned with the direction of the wind in the tunnel. The loads on the bodies are measured with an aerodynamic balance, which is located under the tunnel floor and is attached to the body through a holder.
One car is attached to the balance and the other one can move longitudinally (through traversing system) along the wind tunnel axis to achieve different vehicle spacing configurations.
Fig. 1. Schematic side view of the test section
2.2 Numerical simulations
The simulations were performed with the commercial CFD code ANSYS Fluent 18.1. Two identical computational models (except for the distance between the vehicles and the inlet velocity) were used for all analysed cases. The size of the computation domain is 2.0m long, 0.75m wide and 0.75m high. The distance of the inlet plane to the single or leading car was set to 0.5m.
The bottom surface of the Ahmed bodies are located at 0.02m above the ground. The solver was configured as pressure-based and the analysis were performed for steady state. The 3D steady RANS equations were solved with the standard k– ε model. The choice of the standard k– ε model was made based on a previous extensive validation study for the aerodynamics of vehicles [10 - 12].
Pressure–velocity coupling was taken care of by the SIMPLEC algorithm based on the relation between velocity and pressure to enforce mass conservation and to obtain the pressure field. Pressure interpolation was
second order and second-order discretisation schemes were used for both the convection terms and the viscous terms of the governing equations. Convergence was monitored carefully and the iterations were terminated when all residuals showed no further reduction with increasing number of iterations.
Air at normal conditions was the fluid medium. Velocity-inlet boundary condition type was assigned to the inlet with velocity magnitude normal to the boundary equal 8 m/s (corresponding to experiment) and 88 m/s (representing the real traffic situation for ReL=1,4×10⁶).
The outlet of the computational domain was defined as pressure-outlet with ambient static pressure. Wall with no slip shear condition and no roughness was assigned to the remaining surfaces (car models and wind tunnel walls).
The meshing process was performed using ANSYS Meshing 18.1. Tetrahedral (TET) elements were used to discretize the computational domain. Figure 2 shows part of the grid distribution in the vicinity and on the Ahmed bodies. The size function was set to UNIFORM in order to obtain the most regular mesh. Moreover the maximal face size as well as maximal TET size constrains were set to the value of 50mm. Additional face sizing on surfaces representing car models was defined as 5mm with 1.1 growth rate in order to refine the mesh in the vicinity of the analysed Ahmed bodies. Such meshing procedure was previously validated in [13]. The above mentioned meshing settings resulted in the final mesh consisting of approx. 600 thousand elements. The mesh resolution was based on the mesh sensitivity analysis and generation guidelines [14, 15]. The mesh quality was also taken into consideration. The quality analysis provides a metric that ranges between 0 and 1. A value of 1 indicates a perfect element while a value of 0 indicates that the element has a zero or negative volume. The element of the worst quality generated throughout the entire research (ten meshes) was characterized by the quality index of 0.16 and therefore it was assumed that the mesh did not affect the numerical stability of the computational model. The near-wall region in a turbulent boundary layer was considered by y+ >30.
3
Results and discussions
CFD simulations are performed based on the steady-state Reynolds-Averaged Navier–Stokes equations with the standard k– ε model and standard wall function. The simulations are validated based on a series of wind tunnel measurements. Both CFD simulations and wind tunnel measurements allowed ascertaining and quantifying the upstream effect by a downstream car on the drag of the first one.
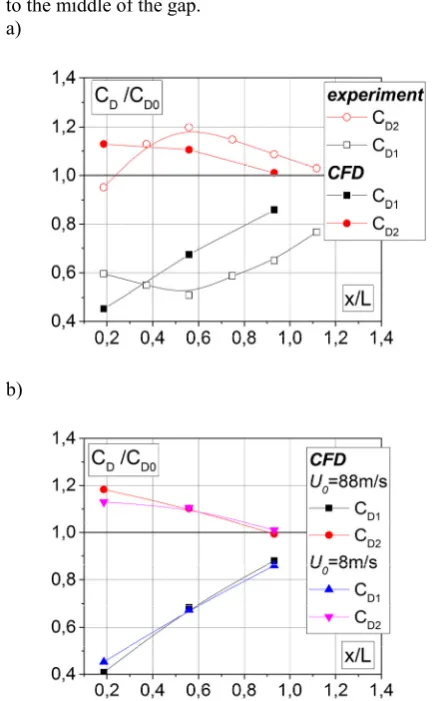
Figure 3 shows the averaged drag coe�cient (CD) of
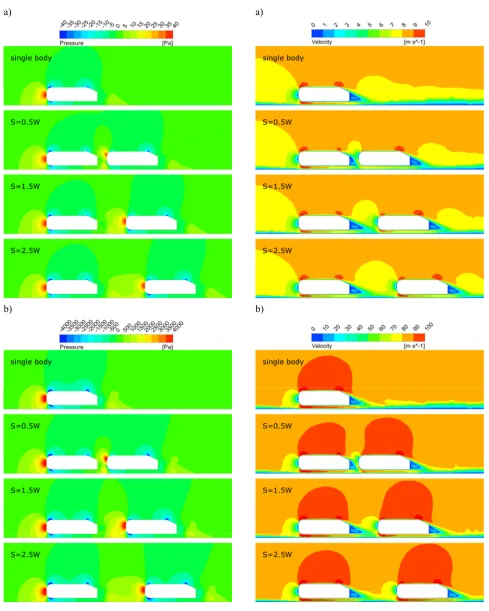
two identical Ahmed bodies measured for various distances of the bodies in the range of 0 < x/L < 1.2, where L is the body length. The drag coefficient values are normalized with the drag of a single body in isolation and are presented for the leader and the downstream vehicle. The experiment is conducted at inlet velocity of 8m/s. CFD simulations are conducted at two inlet velocity of 8m/s and 88m/s (Figure 3b). The comparison of the results (Figure 3a) shows a good agreement between the data and the maximum di�erence is approx. 10%. Only for the configuration when bodies are at the closest distance (x/L = 0.2) differences of results are more significant. As inferred from the gure 3b, the drag coefficient variations show similar trends when the velocity increases from 8m/s to 88m/s. The drag value of the leader decreases about 10% by increasing the distance in the range of x/L = 0.2 − 0.5. Then it starts to increase and approach towards a single body drag. More interesting results can be noticed for the downstream vehicle. In spite of locating the first vehicle in the wake region of the leader in which, the drag force of the downstream body is expected to be reduced compared to the value of the single body in isolation (the concept of the platooning), the drag increases to almost 20% higher value than the drag of a single body. Signicant amount of drag coefficient increase is observed in the range of x/L = 0.2 − 0.5, where the drag value of the downstream vehicle increases from 5% less than for a single body at x/L = 0.2 to 20% more than that at x/L = 0.5. The numerical simulations of the present study performed for three di�erent inter-body distances of S = 0.5W, 1.5W and 2.5W are described. The distances are selected within the regions where the increase or decrease of the drag coefficient starts and reaches the maximum value. The ow characteristics are compared and thoroughly discussed for all three di�erent gaps on the base the static pressure and velocity fields. The similar trend can be found in both numerical and experimental predictions. Figure 4 compares the averaged static pressure distribution on the symmetric plane for single Ahmed body and three di�erent inter-body distances for two inlet velocities 8m/s and 88m/s. The contours present the wake regions in the gap between the bodies, behind the downstream vehicle and also region in front of the objects. The vortical structures, one over the other one, can be noticed in the gap of the bodies for three distances. For S = 0.5W, these vortical regions are small and attached to the downstream body. Increasing the distance to S=1,5W, two vortices are still attached to the downstream vehicle. The vortices are stretched out
towards the leader, move to the leader and become closer to the middle of the gap.
a)
b)
Fig. 3. Averaged normalized drag coefficient CD/CD0 (CD0 drag value of a single body in isolation) of two Ahmed bodies for various inter-vehicle distances. Comparison of numerical simulation results and experimental data (a) and comparison of numerical results for velocities 8m/s and 88m/s (b).
a)
b)
Fig. 4. Averaged static pressure distribution around two Ahmed bodies for various inter-vehicle distances on the symmetric plane. The numerical results at different velocities 8m/s (a) and 88m/s (b).
a)
b)
4 Conclusions
This paper describes the detailed experimental and numerical analysis of the effect of inter-vehicle distance in the platoon arrangement on the mutual ow interactions. The main attention was concerned with the signicant increase of the drag coefficient of the follower at some particular close distances, found in the experiment part of the present investigation. Accurate
numerical simulations at three di�erent inter-body
distances are performed to describe the ow structures around the body and to obtain more information about the reasons causing the increase of the drag coefficient.
The main findings from this study are:
Complex flow fields have been numerically visualized showing various velocity and pressure fields formed at different regions.
The flow structures in the wake region behind the downstream Ahmed vehicle is more or less the same for all the analysed cases (x/L = 0.2-1.2).
The recirculation zone is formed in the gap between two Ahmed vehicles and the interaction between the flow on the top of vehicles and the flow inside the gap region is very weak especially for x/L = 0.2. When the gap size increases further the strong interaction is observed between the flow on top of the two vehicles and the flow inside the gap region.
Comparison of various ow characteristics revealed that a signicant change in ow structure between the vehicles in the platoon with 0.3<x/L<1.2 is the underlying reason for the increase in drag coefficient.
References
1. M. Zabat, N. Stabile, S. Farascaroli, F. Browand, The aerodynamic performance of platoons: A final report. California Partners for Advanced Transit and Highways (PATH, 1995
2. R. Gnatowska, Arch. Mech. 60 (6), 475-490 (2008) 3. R. Gnatowska, Int. J Turbo Jet. Eng. 28 (1) 21-29
(2011)
4. F. Browand, M. Hammache, M. The limits of drag behavior for two bluff bodies in tandem (No. 2004-01-1145). SAE Technical Paper. (2004)
5. M. Hammache, M. Michaelian, F. Browand, F. Aerodynamic forces on truck models, including two trucks in tandem (No. 2002-01-0530). SAE Technical Paper (2002)
6. S. Watkin, G. Vino, J. Wind Eng. Ind. Aerodyn. 96, 1232-1239 (2008)
7. M. Mirzaei, S. Krajnović,. Large Eddy Simulations of Flow Around Two Generic Vehicles in a Platoon. In Proceedings of the 5th International Conference on Jets, Wakes and Separated Flows (ICJWSF2015)
(pp. 283-288). Springer International Publishing, 2016)
8. M. Mirzaei, A. Pavlenko, S. Krajnovic, V.G. Chernoray, Experimental and numerical study of flow structures between two Ahmed bodies with
various inter-body distances. In ICHMT DIGITAL LIBRARY ONLINE. Begel House Inc.. (2015) 9. S.R. Ahmed ATJFE 105, 429-434 (1984)
10. T. Defraeye, B. Blocken, E. Koninckx, P. Hespel, J. Carmeliet, J. Biomech. 43 (12), 2281–2287 (2010) 11. B. Blocken, Build. Environ. 91, 219–245 (2015) 12. R. Gnatowska, M. Sosnowski, V. Uruba, CFD
modelling and PIV experimental validation of flow fields in urban environments, E3S Web of Conferences, 14, 01034 (2017)
13. M. Sosnowski, J. Krzywanski, R. Gnatowska, Polyhedral meshing as an innovative approach to computational domain discretization of a cyclone in a fluidized bed CLC unit. E3S Web of Conferences, 14, 01027 (2017)
14. J. Franke, A. Hellsten, H. Schlünzen, B. Carissimo, Best Practice Guideline for the CFD Simulation of Flows in the Urban Environment, COST Action 732: Quality Assurance and Improvement of Microscale Meteorological Models. (Hamburg, Germany. 2007)