1
Local Scour Mechanism around Dynamically Active
1Marine Structures in Non-cohesive Sediments and
2Unidirectional Current
3M. Al-Hammadi
1; and R. R. Simons
2 41Ph.D., Dept. of Civil, Environmental and Geomatic Engineering, Univ. College London, WC1E 6BT London, U.K. 5
(corresponding author). E-mail: [email protected] 6
2Professor of Fluid Mechanics and Coastal Engineering, Dept. of Civil, Environmental and Geomatic Engineering, Univ. 7
College London, WC1E 6BT London, U.K. E-mail: [email protected] 8
Abstract: This paper sheds light on the mechanism of post equilibrium seabed scour around 9
dynamically active marine structures such as wind turbines. Exposure of a fully developed scour hole 10
(at equilibrium state) around a wind turbine mono-pile to the cyclic movement of the structure leads 11
to the backfilling and deformation of the scour hole. The existing approaches to scour prediction for 12
foundation design of offshore wind turbines generally consider wind turbines as static structures and 13
ignore the physical impact of the cyclic movement of the pile on the supporting soil and hence on the 14
scour process. Through an experimental programme this paper explains the influence of the cyclic 15
movement of the pile on the local scour in non-cohesive sediments. A series of flume tests at two 16
scales were conducted. Simple hydrodynamic conditions and bed sediment configurations were 17
adopted to highlight the effect of pile movement. The results obtained indicate that a mechanism 18
exists by which the scour hole can be significantly deeper and wider in extent than that predicted by 19
conventional methods. This arises through a multi-stage process consisting of periodically alternating 20
cyclically loaded and unloaded stages simulating a sequence of storms. 21
Author keywords: Scour; Backfilling; Cyclic loading; Frequency; Current; Offshore wind turbine. 22
2 Introduction
24
Strong and stable wind conditions and the development of highly efficient and reliable wind energy 25
technology provide the motivations to expand wind farm projects into the offshore areas. However, 26
the cost of the construction and maintenance of such projects in the marine environment is much 27
higher than when constructed on land. Therefore, to achieve cost competitiveness it is necessary to 28
conduct studies providing a better understanding of the unclear aspects in the current design 29
approaches. 30
A key factor in the design of offshore wind turbine foundations is seabed scour. This is the erosion of 31
mobile bed sediment from around a structure in the marine environment, and is caused by the increase 32
in shear stress applied due to changes in the flow pattern. It can lead to problems with structural 33
stability and makes it a challenge to design foundations for such structures. 34
Scour has been studied extensively since the mid-20th century, and the effects of a wide range of 35
parameters on this process have been addressed. For instance, Whitehouse (1998), Melville and 36
Coleman (2000), Sumer et al. (2001) and Sumer and Fredsøe (2002) present summaries of the main 37
findings considering the scour in various sediment types, hydrodynamic conditions and foundation 38
models. However, there is still a high level of uncertainty in the present approach to scour prediction. 39
Jensen et al. (2006) found that even in the most conservative approaches there can still be under-40
prediction of scour depths. 41
A comparison of several scour prediction approaches is provided by Sheppard et al. (2011) using a 42
wide range of experimental and field data. They found that some of the approaches under-predict the 43
depth while others are conservative and noticed an improvement in the accuracy using the more recent 44
approaches to prediction. 45
In another study Matutano et al. (2013) reported both over-prediction and under-prediction when 46
predicted scour depths (using a given approach) were compared to a set of data. This is generally due 47
3
More recently, a comprehensive study on the effects of complex piers on local scour is has been 49
carried out by Baghbadorani et al. (2018) basing their predictive approach on a set of experiments and 50
published data. In another study Tavouktsoglou et al. (2017) investigated local scour around gravity 51
based foundations. They adopted a novel approach based on the depth-averaged Euler number and 52
reported good agreement with a wide range of experimental and field data. 53
A factor that has received little attention is the physical impact of cyclic movement of marine 54
structures on the sea bed and its consequences for the scour process. The cylindrical structures that 55
support wind turbines are dynamically sensitive because of their slenderness and the severe 56
environment in which they are generally located. Wind and waves are the main sources of 57
environmental loading and can induce cyclic movement of wind towers. Field measurements indicate 58
that under storm conditions the nacelle (the top part of the wind tower) can experience a horizontal 59
displacement for up to 1 m for a tower 100 m high and 5 m in diameter (Mostböck and Petryna, 60
2014). Wang et al. (2013) reported a similar value under extreme storm conditions including the rain 61
load. A wide range of field data for amplitudes of cyclic movement at the bed level is provided by 62
Long and Vanneste (1994), who quote values from less than 0.1% to more than 10% of pile diameter. 63
Applied loading in the current test programme produced pile movements within this range of 64
amplitude. 65
The majority, if not all, of the literature on scour consider the seabed around static, rigid structures. 66
However, there have been a relatively large number of studies looking at the cyclic loading effects 67
from structural and geotechnical points of view. Adhikari and Bhattacharya (2010), Harte et al. 68
(2012), Bhattacharya et al. (2013), Damgaard et al. (2014), Yu et al. (2014) and Foglia et al. (2015) 69
studied the influence of cyclic loading on sediment and the dynamic behaviour of wind turbines in the 70
marine environment. 71
In one of the few studies to relate the structural behaviour to scour, Damgaard et al. (2013) 72
investigated the effects of scour and backfilling on the natural frequency of the structure. They 73
suggested a relationship between the variation of the structural natural frequency and the development 74
4
Hz. Recently Prendergast et al. (2015) considered the change in structural natural frequency during 76
the scour process around offshore wind turbines through scaled experiments and numerical models. 77
Their small scale tests showed that the natural frequency could vary from less than 10 Hz to 60 Hz in 78
the case of no scour and extreme scour depths of more than 5 times the pile diameter respectively. In 79
their numerical model of a full scale wind turbine with a design scour depth of 1.3 times the pile 80
diameter they observed a change in natural frequency of about 0.022 Hz. Guan et al. (2019) have 81
carried out laboratory experiments in which they observed a reduction in depth of scour when a 82
monopile foundation was subjected to lateral vibrations. The vibrations continued steadily throughout 83
these tests and did not attempt to replicate the variations caused by periodic storminess. 84
The aim of the present study is to investigate the scour process under the influence of cyclic 85
movement of the structure and to establish a relationship between the characteristics of structural 86
movement and the behaviour of granular sediment. 87
Methodology and Simulation 88
In order to investigate the influence of structural cyclic loading on the scour process a series of tests 89
were performed. The first part of the study was conducted at relatively small scale using two circular 90
pile diameters (D = 25 and 40 mm). Later, to confirm the results obtained from the first part, a larger 91
pile (D = 90 mm) was tested. 92
Small scale experiments 93
The first part of the study was carried out in a current flume of length of 10 m ,width of 0.3 m and 94
depth of 0.3 m. A sediment pit (2 m long, 0.3 m wide and 0.1 m deep) was created at the centre of the 95
flume. The distance from the upstream inlet to the sediment section was 4 m which was enough to 96
achieve a fully developed logarithmic velocity profile at the working section. Velocity profiles were 97
measured using a laser Doppler velocimeter (LDV) system. This device is accurate and appropriate 98
for use in small scale flumes as it takes the measurements from outside and imposes no disturbance on 99
5
Coarse sand with a median grain size of d50 = 0.66 mm,σ = (d85/ d15) 0.5
= 1.2 and natural repose angle 101
φ = 29.6° (measured using direct shear tests and submerged sand piles) was employed in the test 102
programme. The water depth in the experiments was maintained at 165 mm above the sediment 103
section. 104
The pile models were manufactured in two parts. The base of the pile, of length 0.1 m, was embedded 105
vertically in the sand and rigidly fixed to the base of the flume. It was painted with a scale rule as an 106
indication of the scour depth through the tests. The upper part of the pile was attached to the base after 107
preparation and levelling of the sediment section and prior to the initiation of the tests. 108
An electro-magnetic actuator was employed to simulate the cyclic movement of the wind turbine. 109
This was attached rigidly to the frame of the flume and connected to the top of the pile to apply cyclic 110
loading in the direction of flow (see Fig. 1). It was capable of applying cyclic loading up to 5 mm 111
horizontal displacement over a wide range of frequencies. 112
The tests parameters were selected based on the separation of their effects on the scour process. For 113
example, flow depth was chosen to be deep enough to minimize the influence of flow shallowness in 114
which the vortices interact with each other. In addition, unidirectional current and clear water scour 115
were chosen in all tests to simplify the scour so that the impact of the structural cyclic loading could 116
be identified. 117
Dynamic simulation 118
Wind turbines are exposed to a variety of external excitations, as mentioned previously. The rotor, 119
wind and waves are the main dynamic loads on such structures. These act to introduce a range of 120
frequencies and displacements, which had to be scaled in the experiments. 121
The frequency of the cyclic movement is generally scaled on the natural frequency of the structure. 122
This can be estimated by several methods; in the current study, theoretical and experimental 123
approaches were employed. One of the formulas used widely in the estimation of the natural 124
6
𝑓1≈ √(𝑀+0.227 𝑚𝐿)4𝜋3.04𝐸𝐼 2𝐿3 (1) 126
Experimentally, a set of free vibration tests were carried out on a 40 mm diameter model pile to 127
provide an assessment of its natural frequency. The data were recorded using an accelerometer fitted 128
at the top point of the pile. The pile was embedded in a sand bed and tested for three different free 129
lengths. This was done by applying a small excitation to the system and recording the acceleration. 130
This was then analysed to give its frequency. The results of the theoretical and experimental methods 131
were in agreement, and showed that the natural frequency of the (40 mm diameter) pile with the same 132
length and mounting employed in the flume tests was about 12 Hz. 133
Soil-frequency sensitivity 134
A series of preliminary tests were conducted to investigate the sensitivity of two sands with d50 = 0.24 135
mm and 0.66 mm to a range of frequencies. A pile with a diameter of 40 mm was embedded vertically 136
and fixed rigidly to the bottom of a sediment container. Five frequencies were selected from 10 to 50 137
Hz. All tests were carried out by application of cyclic loading for the same time (30 minutes) and the 138
same horizontal displacement at the mudline (0.5 mm). Following the approach described by Herrick 139
and Jones (2002) a penetrometer was used to measure the soil density at three points along the line of 140
direction of vibration at various depths. The density was measured at 5 points on each side of the pile 141
in the direction of loading over the entire depth. The first point was located 10 mm from the pile face 142
to avoid the loose material in front of the pile and a distance of 50 mm was taken between each point. 143
The results of these tests indicate that in both sands the maximum density was achieved at 30 Hz. 144
Larger scale experiments 145
To confirm the results of the small scale tests a set of larger scale experiments were conducted with a 146
90 mm pile. These were carried out in a flume of length 20 m, 1.2 m wide and 1 m deep. A sediment 147
pit 2.9 m long, 1.2 m wide and 0.25 m deep was constructed in the central part of the flume. Two 148
wooden ramps of slope 1:6 were placed at the upstream and downstream ends of the sediment pit. The 149
7
Fine sand with median grain size d50 = 0.24 mm, σ = (d85/ d15) 0.5
= 1.39 and natural repose angle φ = 151
28.6° was employed in these tests. 152
All the tests were carried out in a unidirectional current and the flow depth was maintained at 450 153
mm. Measurements of the velocity profile through the depth were collected using a three-dimensional 154
acoustic Doppler velocimeter (ADV). For scour monitoring, in addition to the graded pile base, which 155
was monitored visually and by photographs during the scour development, an echo sounder device 156
was employed. This was attached to a programmable traverse which was installed on the flume frame. 157
By this arrangement, in addition to scour monitoring during the tests it was possible to scan the wider 158
bed morphology after each stage of the tests. 159
It is worth noting that currents in the marine environment are time-varying in both direction and 160
magnitude resulting in periods of no scour, clear water scour, and live bed scour. In live bed scour the 161
scour hole is subjected to scouring and backfilling which can limit the development of the scour hole. 162
Maximum depth of scour is expected to develop in the clear water regime at a flow velocity close to 163
the sediment critical velocity, and this condition has been selected for the present study to examine the 164
effect of structural cyclic loading on scour. 165
Scour tests with low frequency cyclic loading 166
In the first set of tests the frequency of cyclic loading was chosen to be 30 Hz, based on the results of 167
the preliminary tests described above. This frequency is considerably higher than the field excitation 168
frequencies. To investigate the scour process under a wider range of loading frequencies, further tests 169
were carried out as described below. 170
These tests were conducted in the small scale current flume with a pile diameter of 25 mm. The same 171
fine sand which was used in the larger scale tests (d50 = 0.24 mm and φ = 28.6°) and similar water 172
depth to the small scale tests (165 mm) were adopted in this programme. The scour was monitored 173
visually using a graded pile base. A point gauge was also used to collect measurements of the scour 174
hole profiles. For this set of tests, to achieve a higher amplitude of cyclic loading the pile base was 175
8
The actuator which was employed in the small scale tests was not able to produce sufficient 177
amplitudes across the range of frequencies required. Instead the mechanism from a shaking table was 178
adapted to apply cyclic loading at the low frequencies required. The device was calibrated for a range 179
of frequencies and displacements. 180
Tests procedures 181
The first tests looked at development of a scour hole under a unidirectional current while at the same 182
time the pile was exposed to cyclic loading. It was noted that at the same time as scouring there was a 183
continuous backfilling. 184
Based on these results it was decided to carry out a set of tests made up of multiple stages, alternating 185
between periods with and without cyclic loading. The procedure was as follows: 186
1. Equilibrium stage: a normal scour hole was allowed to form around a pile without cyclic 187
loading, under the action of a unidirectional current in an initially flat bed until an equilibrium 188
state was achieved. 189
2. Cyclic loading stage: the pile was then exposed to cyclic loading. The duration of this period 190
was scaled based on the model size. During this stage the previously developed scour hole 191
became partially backfilled. 192
3. Second equilibrium stage: in this stage the cyclic loading was removed and the scour was 193
allowed to continue until a second equilibrium depth was achieved. 194
4. The cyclic loading stage was repeated after the second equilibrium. This was then followed 195
by third equilibrium and third cyclic loading stages. 196
As part of the overall study, tests were also carried out to investigate the effect of soil compaction on 197
scour. In these tests the soil was compacted by application of cyclic loading for a period of 30 198
minutes. The compacted bed was then tested for scour in a unidirectional current. 199
In addition to the cases described above, low band frequencies of cyclic loading that are more 200
reflective of the field conditions were examined. For this purpose, tests were carried out in three 201
9
hole in the absence of cyclic loading. After reaching equilibrium scour depth, the pile was exposed to 203
cyclic loading. This was then followed by an un-vibrated stage during which a new scour hole was 204
generated. For these tests the number of loading cycles was the same for each frequency; hence, 205
depending on the frequency of cyclic loading, the time of the exposure to cyclic loading was different 206
for each test. 207
Test conditions 208
Tables 1, 2 and 3 present the test conditions adopted in this study: 209
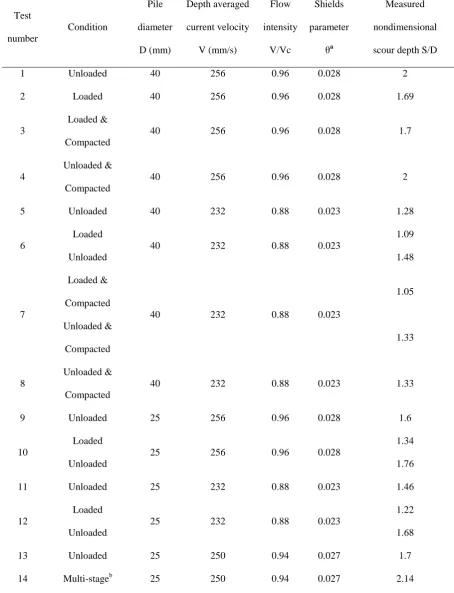
Table 1 summarises the initial small scale test programme in addition to the compacted bed tests. In 210
Tables 2 and 3 the larger scale test and the low frequency tests are presented. In Table 1 the second 211
column presents the conditions under which the scour was developed. The term “unloaded” refers to 212
scour development in the absence of cyclic loading, while “loaded” indicates that the pile was 213
exposed to cyclic loading during the scouring process. Some of the tests were conducted in compacted 214
beds as indicated “Compacted” (by application of cyclic loading giving an amplitude of 0.05 mm for 215
30 min.); otherwise, the bed material was at the normal density. The maximum scour depths 216
normalised by the pile diameter are presented in the last column. 217
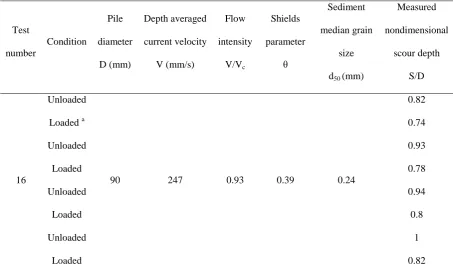
The larger scale test presented in Table 2 consisted of eight stages. The loading condition is indicated 218
in the second column and the nondimensionalised scour depths at the upstream face of the pile are 219
listed in the last column (similar to Table 1). All the parameters (flow depth and velocity, amplitude 220
and frequency of cyclic loading, and duration of cyclic loading stages) were maintained at the same 221
value throughout the multi stage test. 222
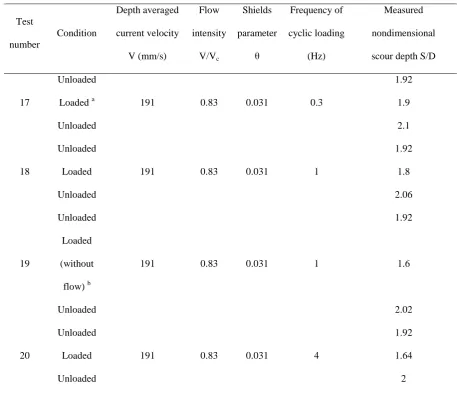
Table 3 summarizes the test conditions for the low frequency tests. As mentioned earlier, these tests 223
were conducted to examine vibrations in the frequency range similar to field excitations. The same 224
flow parameters were adopted throughout this set of tests. In addition, the number of cycles and the 225
amplitude of the cyclic movement at the mudline were maintained at the same values for all tests. 226
10 Scour in compacted sands
228
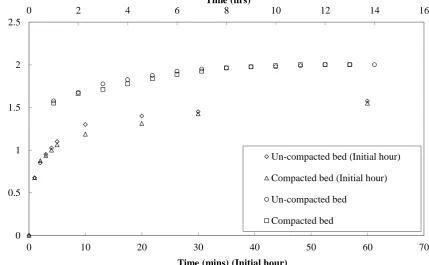
Fig. 2 compares the time evolution of scour in compacted sand (as a result of pile cyclic loading) 229
(Test 4, Table 1) and in normal density sand (Test 1, Table 1). The development of each test is shown 230
in two parts. The first hour of the test is presented on a scale of minutes, while the rest of the test is 231
shown in hours. This is to provide more detail of the scour depths at the initial stage. The results 232
shown in this graph indicate that the rate of scour in the compacted sand at the early stage of the test 233
was slower than that in normal density (uncompacted) sand. However, the equilibrium states were 234
reached in both sands at almost the same depth. 235
Scour under effect of cyclic loading 236
Scour development around the cyclically loaded pile (Test 2, Table 1) is compared to that for an 237
equivalent test in which a normal scour hole was created around a static pile (Test 1, Table 1) in Fig. 238
3. As for the compacted bed results, the initial hour of data was plotted separately from the rest of the 239
data. In the loaded pile test the pile was subjected to cyclic loading once the erosion of the bed 240
material was initiated. At the start of each test, the scour was at the same rate for both cases; however, 241
after a few minutes, the difference in scour depths started to increase. This was due to the backfilling 242
caused by the cyclic movement of the pile. It is worth noting that the term “backfilling” here refers to 243
the adjustment of the steep slope upstream of the pile resulting in a slumping of sand grains to the 244
base of the hole. In the loaded test, at the equilibrium state the scour hole was considerably shallower 245
and wider in extent than the unloaded scour hole. As part of this process it was seen that, with cyclic 246
loading, the slopes of the scour hole changed and formed a uniform conical shape with a slope at the 247
natural repose angle of the sand. 248
Scour in two-stage tests 249
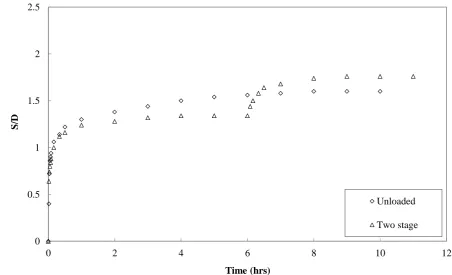
Fig. 4 shows the results of scour depth development in a two-stage test (Test 10, Table 1) and an 250
equivalent test without cyclic loading (Test 9, Table 1). This confirms the results above, namely that 251
under the influence of the cyclic movement the scour hole created is shallower in depth and wider in 252
11
was developed close to the pile. The wider extent of the first stage of scour, during which the pile was 254
subjected to cyclic loading, enabled the horseshoe vortex to reach deeper and to erode more material 255
from the base of the previous hole. It was noted that the upstream slope of the equilibrium hole at the 256
end of the second stage (without cyclic loading) is steeper than that developed in the unloaded test. 257
This is attributable to the compaction of the bed sediment induced during the first (cyclic loading) 258
stage of the test. 259
Scour in multi-stage tests 260
Fig. 5 shows the results of a test involving a sequence of periods of scour with and without cyclic 261
loading (Test 14, Table 1). The test was started by development of a normal scour hole without cyclic 262
loading until equilibrium was reached. This was followed by a stage with cyclic loading, during which 263
the scour hole experienced backfilling and widening. After this stage the cyclic loading was stopped, 264
and a new scour hole was generated. Once the second equilibrium was achieved the pile was exposed 265
to a further period of cyclic loading. This procedure was repeated for seven cyclic loading stages. It 266
was found that the exposure of the pile to periods of cyclic loading, analogous to a sequence of storms 267
in real life, develops a deeper scour hole, in the present case more than 20% deeper than the original 268
equilibrium scour depth. More importantly the mechanism for increasing the scour depth has the 269
potential to continue progressively under such conditions. 270
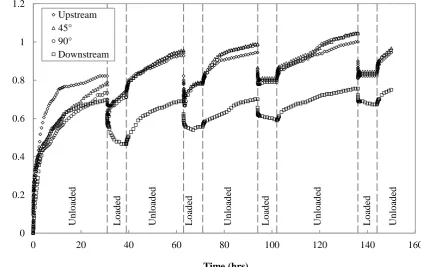
In order to verify the results from this multi-stage test, a similar test was conducted at a larger scale. 271
Fig. 6 provides the time evolution of scour at four positions around the pile. The results indicate that 272
during the second stage, which was eight hours long, with the pile exposed to cyclic loading, the sides 273
of the scour hole slumped into the base of the hole. After a few minutes the scour rate became higher 274
than the backfilling (caused by the cyclic loading). Therefore, the scour depth started to increase 275
upstream and at the sides of the pile. However, a different pattern was observed at the downstream 276
side of the pile and the scour depth continued to decrease. This was due to the deposition of the 277
eroded material from the front face of the pile. This material was continuously dragged under the 278
12
to the downstream side. After seven unloaded and loaded stages the scour depth recorded a significant 280
increase in depth in comparison with the first equilibrium depth (before application of cyclic loading). 281
The morphology of the resulting scour holes was scanned after each stage of the test. Fig. 7 (a) and (b) 282
compare the bed profiles after the first equilibrium (unloaded) stage (after 30 hours) and the final 283
loaded stage (after 140 hours). The contour maps show that the scour depth as well as the area of the 284
hole increased significantly. This was after a sequence of eight periods alternating with and without 285
cyclic loading. 286
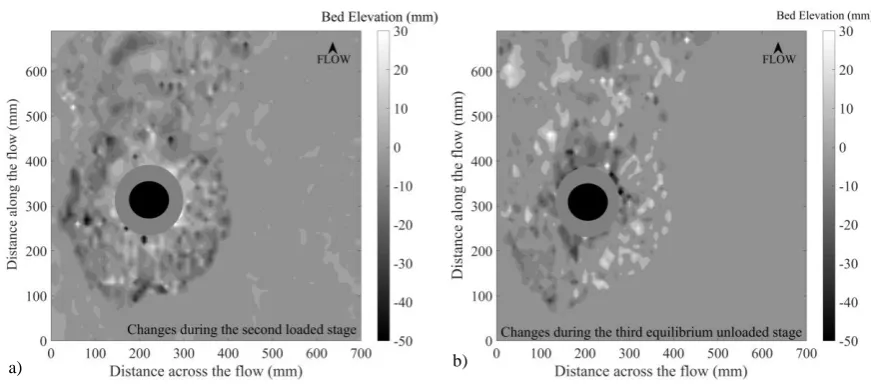
The changes caused to the scour hole during the second period (with cyclic loading) are highlighted in 287
Fig. 8 (a). It is noticeable that the sand particles are drawn from further from the pile and have 288
backfilled close to the structure. Similarly, Fig. 8 (b) presents the changes in scour hole during the 289
third equilibrium stage (without cyclic loading). In this figure the generation of a new scour hole close 290
to the pile can be observed. 291
Low frequency scour tests 292
Results of these tests are plotted in Fig. 9. There are 3 stages during each test: 1) scour development 293
generated by a current over a flat bed without cyclic loading of the pile; 2) combined backfilling and 294
scouring with cyclic loading applied; and 3) development of a new scour hole by the current without 295
cyclic loading of the pile. 296
In such tests, it is important to ensure that the equilibrium state has been reached during the first stage 297
without cyclic loading. To achieve this, after recording the maximum scour depth using the adopted 298
equilibrium criterion, the current was allowed to run for an additional ten hours to ensure no further 299
scour. 300
An equal number of loading cycles was considered in each of the four tests. Therefore, a longer test 301
time was required for the lower frequency tests. In this programme three frequencies were tested. It 302
was also decided to consider an additional case in which the cyclic loading stage was run with no flow 303
taking place. This test was helpful in separating the influences of the cyclic loading and the erosion 304
13
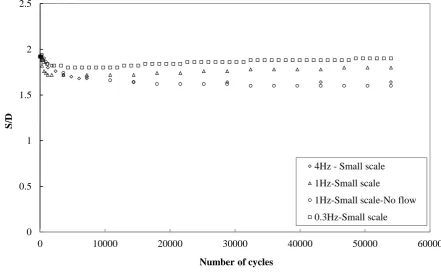
In Fig. 10 the scour depth is plotted against the number of cycles applied during the cyclic loading 306
stages starting after the equilibrium scour hole had been developed without vibration. The graph 307
indicates two aspects of the backfilling process: 1) an initial slump of the upstream slope; 2) 308
continuous sliding of the bed material to the base of the scour hole. 309
The results show that the rate of the backfilling decreases with the frequency of cyclic loading. 310
However, with the lower frequency, a flatter scour hole was developed. This is attributable to the 311
longer time the scour hole was exposed to the combined effects of current and cyclic loading (the 312
longer time was necessary to apply an equal number of cycles). 313
Consequently, in the next period without cyclic loading, the scour depth increased as the frequency 314
decreased (see Fig. 9). This can be explained by the flatter hole which increases the capacity of the 315
vortices to erode more material from the base of the pile and generate a deeper hole. 316
In the case of the test at 1 Hz without flow (Test 3, Table 3) the backfilling recorded the greatest depth 317
and reached an equilibrium state at the end of the cyclic loading stage (Fig. 10). The resulting scour 318
hole was also smaller in extent relative to the equivalent test with flow (Test 2, Table 3). This was 319
reflected in the next stage with flow and no cyclic loading, during which the equilibrium was achieved 320
at a shallower scour depth. 321
322
Discussion 323
It is widely accepted that the slope of the upstream side of the scour hole is steeper than the natural 324
repose angle of a non-cohesive bed sediment. Link et al. (2008) attributed this to the development of a 325
multi-layer vortex system which provides the support and stabilises the upstream slope at a higher 326
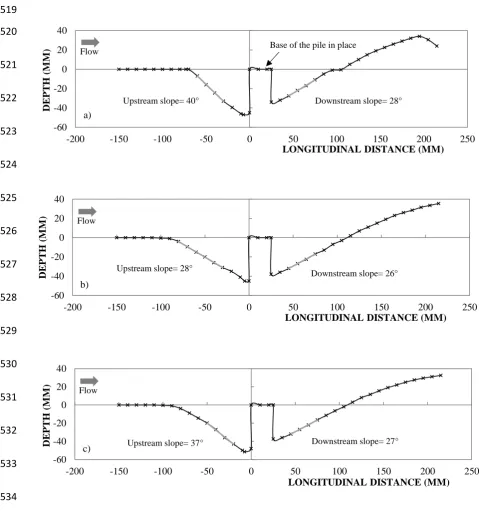
angle. This is in agreement with the shapes of the scour holes observed in this study (see Fig. 11. a). 327
Exposure of an equilibrium scour hole to horizontal movement by the pile destabilises the steep angle 328
14
(see Fig. 12 a). This generates a uniform scour hole with a single slope hole in all directions around 330
the pile. 331
Under the combined effects of the current and cyclic loading the scouring vortices erode the bed 332
material from the base of the pile, while the cyclic loading continues to adjust the slope to maintain a 333
single uniform angle slope (see Fig. 12 b and Fig. 11. b). This process is likely to continue and over 334
time results in a wider scour hole. 335
In the next stage without cyclic loading the current-induced vortices develop a deeper scour hole (see 336
Fig. 11. c). Under a sequence of loaded and unloaded stages the scour hole can reach significantly 337
greater depths and widths, and shows no evidence of reaching an equilibrium. 338
The results show that the rate and magnitude of backfilling are dependent on the frequency and 339
amplitude of the cyclic movement of the pile in addition to the current strength. This is reflected in the 340
shape of the backfilled hole, and consequently, the generation of the second equilibrium scour hole 341
(without cyclic loading). 342
This is an important finding and needs to be considered in the design of foundations for dynamically 343
active structures (wind turbines) in the marine environment to avoid stability issues caused by the 344
uncertainty in the prediction of scour. 345
346
Conclusions 347
Results of the tests described in this paper demonstrate the significance of structural movement on the 348
development of scour. 349
The main conclusions of the study are: 350
1. A pre-existing scour hole around a pile will tend to backfill when the pile is exposed to cyclic 351
15
a) Initial adjustment of the steep upstream slope to the natural repose angle of the sand through a 353
rapid slump. 354
b) The upper layers of the adjusted slope slide continuously to stabilise and maintain a single 355
uniform angle slope under the combined effects on erosion by the current and cyclic 356
movement of the pile. This process is unlimited and scouring of the backfilled material is 357
likely to continue. 358
2. The backfilled scour hole is wider in extent and shallower in depth in comparison with an 359
equivalent equilibrium scour hole without cyclic loading. This increases the capacity of the 360
erosive vortices to generate a new scour hole when the pile movement is stopped. 361
3. The scour hole is likely to grow significantly in both depth and extent as an unlimited process 362
around a pile alternately static and subject to cyclic loading. 363
4. The same mechanism was observed over a range of frequencies of cyclic loading, at two scales 364
and two sand sizes, for a steady current in the clear water regime. 365
5. It was noted that an initially compacted sand reduces the scour rate at the beginning of scour 366
process but has no long term effect on the equilibrium scour depth. 367
6. The scour mechanism that was developed under effect of structural cyclic loading is likely to be 368
observed under reversing flows induced by waves and currents. 369
Acknowledgements 370
This study is a part of a PhD project, funded by the Higher Committee for Education Development in 371
Iraq (HCED-Iraq). 372
16 Notation
374
The following symbols are used in this paper: 375
D = Pile diameter (m) 376
d16 = Particle size at which 16% is finer (m) 377
d50 = Sediment median grain size (m) 378
d84 = Particle size at which 84% is finer (m) 379
E = Young’s modulus (N/m2 ) 380
f1 = Natural frequency of the structure (Hz) 381
g = Gravitational acceleration (m/sec2) 382
h = Flow depth (m) 383
I = Moment of inertia (m4) 384
L = Pile free length (m) 385
m = Pile mass per metre (kg/m) 386
M = Pile top mass (kg) 387
S = Scour depth (m) 388
s = ρs/ρ = ratio of sediment density to water density 389
v* = Friction velocity or shear velocity (m/sec) 390
V = Depth average current velocity (m/sec) 391
Vc = Critical current velocity (m/sec) 392
φ = Natural repose angle of sand (°) 393
18 References
396
Baghbadorani, D. A., Ataie-Ashtiani, B., Beheshti, A., Hadjzaman, M., and Jamali, M. (2018). 397
Prediction of current-induced local scour around complex piers: Review, revisit, and 398
integration. Coastal Engineering, 133, 43-58. 399
Bhattacharya, S., Nikitas, N., Garnsey, J., Alexander, N. A., Cox, J., Lombardi, D., and Nash, D. F. 400
(2013). “Observed dynamic soil–structure interaction in scale testing of offshore wind turbine 401
foundations.” Soil Dynamics and Earthquake Engineering, 54, 47-60. 402
Damgaard, M., Bayat, M., Andersen, L. V., and Ibsen, L. B. (2014). “Assessment of the dynamic 403
behaviour of saturated soil subjected to cyclic loading from offshore monopile wind turbine 404
foundations.” Computers and Geotechnics, 61, 116-126. 405
Damgaard, M., Ibsen, L. B., Andersen, L. V., and Andersen, J. K. (2013). “Cross-wind modal 406
properties of offshore wind turbines identified by full scale testing.” Journal of Wind Engineering and 407
Industrial Aerodynamics, 116, 94-108.
408
Foglia, A., Gottardi, G., Govoni, L., and Ibsen, L. B. (2015). “Modelling the drained response of 409
bucket foundations for offshore wind turbines under general monotonic and cyclic loading.” Applied 410
Ocean Research, 52, 80-91.
411
Guan, D., Chiew, Y-M., Melville, B. and Zheng, J. (2018). “Current-Induced Scour at Monopile 412
Foundations Subjected to Lateral Vibrations.” Coastal Engineering, 144, 15-21. 413
https://doi.org/10.1016/j.coastaleng.2018.10.011 414
Jensen, M. S., Juul Larsen, B., Frigaard, P., DeVos, L., Christensen, E. D., Asp Hansen, E., and Bove, 415
S. (2006). Offshore wind turbines situated in areas with strong currents. Offshore Center Danmark. 416
Herrick, J. E., and Jones, T. L. (2002). “A dynamic cone penetrometer for measuring soil penetration 417
19
Link, O., Gobert, C., Manhart, M., and Zanke, U. (2008). “Effect of the horseshoe vortex system on 419
the geometry of a developing scour hole at a cylinder.” In4th International Conference on Scour and 420
Erosion, Tokyo (pp. 162-168).
421
Long, J.H. and Vanneste, G. (1994). Effects of cyclic lateral loads on piles in sand. Journal of 422
Geotechnical Engineering, 120(1), pp.225-244. 423
Matutano, C., Negro, V., López-Gutiérrez, J., Esteban, M. D. (2013). Scour prediction and scour 424
protections in offshore wind farms, Renewable Energy, 57, 358-365. 425
Melville, B. W., and Coleman, S. E. (2000). Bridge scour. Water Resources Publication. 426
Mostböck, A., and Petryna, Y. (2014). “Structural vibration monitoring of wind turbines.” In9th 427
International Conference on Structural Dynamics, EURODYN.
428
Prendergast, L. J., Gavin, K., and Doherty, P. (2015). “An investigation into the effect of scour on the 429
natural frequency of an offshore wind turbine.” Ocean Engineering, 101, 1-11. 430
Sheppard, D. M., Melville, B. W. and Demir, H. (2011). Evaluation of existing equations for local 431
scour at bridge piers, J. Hydraul. Eng., 140:1, 14-23. 432
Soulsby, R. (1997). Dynamics of marine sands: a manual for practical applications. Thomas Telford. 433
Sumer, B. M., and Fredsøe, J. (2002). The mechanics of scour in the marine environment. World 434
Scientific. 435
Sumer, B. M., Whitehouse, R. J., and Tørum, A. (2001). “Scour around coastal structures: a summary 436
of recent research.” Coastal Engineering, 44(2), 153-190. 437
Tavouktsoglou, N.S., Harris, J.M., Simons, R.R., and Whitehouse, R.J.S. (2017) “Equilibrium Scour-438
Depth Prediction around Cylindrical Structures.” Journal of Waterway, Port, Coastal, and Ocean 439
Engineering , 143(5), Article 04017017. 10.1061/(ASCE)WW.1943-5460.0000401
440
van der Tempel, J., and Molenaar, D. P. (2002). “Wind turbine structural dynamics–a review of the 441
20
Wang, Z., Zhao, Y., Li, F. and Jiang, J. (2013). Extreme dynamic responses of mw-level wind turbine 443
tower in the strong typhoon considering wind-rain loads. Mathematical Problems in Engineering, 444
2013. 445
Whitehouse, R. (1998). Scour at marine structures: A manual for practical applications. Thomas 446
Telford. 447
Yu, L., Zhou, Q., and Liu, J. (2015). “Experimental study on the stability of plate anchors in clay 448
under cyclic loading.” Theoretical and Applied Mechanics Letters, 5(2), 93-96. 449
21 List of figure captions:
451
Fig. 1. Definition sketch of the experimental arrangement. 452
Fig. 2. Scour depth development in a compacted sand compared to the uncompacted case; d = 40 mm, 453
V/Vc = 0.96, d50 = 0.66 mm. 454
Fig. 3. Scour depth development around static and cyclically loaded piles; D = 40 mm, V/Vc = 0.96, 455
d50 = 0.66 mm. 456
Fig. 4. Scour depth development in a two-stage test and an equivalent normal test (without vibration); 457
D = 25 mm, V/Vc = 0.96, d50 = 0.66 mm. 458
Fig. 5. Scour depth development in multi-stage test; D = 25 mm, V/Vc = 0.94, d50 = 0.66 mm. 459
Fig. 6. Scour depth development in the multi-stage test; D = 90 mm, V/Vc = 0.93, d50 = 0.24 mm. 460
Fig. 7. Contour maps of scour hole: a) first equilibrium (unloaded) stage (hour 31), b) fourth loaded 461
stage (hour 144). 462
Fig. 8. Contour maps of changes in scour depth: a) during second loaded stage (hours 63 to 71), b) 463
during third unloaded stage (hours 71 to 94). 464
Fig. 9. Scour depth development in low frequency tests; D = 25 mm, V/Vc = 0.83, d50 = 0.24 mm. 465
Fig. 10. Scour depth during backfilling and recovery caused by vibration: variation plotted against the 466
number of load cycles applied at 3 different frequencies. 467
Fig. 11. Scour hole profiles of (Test 2 Table 3); a) after first equilibrium (unloaded) stage; b) after 468
cyclic loading stage; c) after second equilibrium (unloaded) stage. 469
Fig. 12. Definition sketch of the changes of a scour hole profile subjected to cyclic movement of the 470
pile through; a) changes to a fully developed equilibrium scour hole by application of the first few 471
cycles, b) simultaneous backfilling and scouring after initial slump. 472
22 Table 1. Small scale test programme
474 Test number Condition Pile diameter D (mm) Depth averaged current velocity V (mm/s) Flow intensity V/Vc Shields parameter θa Measured nondimensional
scour depth S/D
1 Unloaded 40 256 0.96 0.028 2
2 Loaded 40 256 0.96 0.028 1.69
3
Loaded &
Compacted
40 256 0.96 0.028 1.7
4
Unloaded &
Compacted
40 256 0.96 0.028 2
5 Unloaded 40 232 0.88 0.023 1.28
6
Loaded
40 232 0.88 0.023
1.09
Unloaded 1.48
7
Loaded &
Compacted
40 232 0.88 0.023
1.05 Unloaded & Compacted 1.33 8 Unloaded & Compacted
40 232 0.88 0.023 1.33
9 Unloaded 25 256 0.96 0.028 1.6
10
Loaded
25 256 0.96 0.028
1.34
Unloaded 1.76
11 Unloaded 25 232 0.88 0.023 1.46
12
Loaded
25 232 0.88 0.023
1.22
Unloaded 1.68
13 Unloaded 25 250 0.94 0.027 1.7
14 Multi-stageb 25 250 0.94 0.027 2.14
Note: Flow depth h = 165 mm, Sediment median grain size d50 = 0.66 mm, Frequency of cyclic loading = 30 Hz, 475
Amplitude of the cyclic movement at the mudline = 0.1 mm, a Shields parameters calculated using Soulsby
476
(1997) approach θ = v*2/g(s-1)d50, v*/V = 1/7(d50/h)1/7, b Time of application of cyclic loading = 270 mins (see 477
Fig.5).
23 Table 2. Larger scale test programme
480
Test
number
Condition
Pile
diameter
D (mm)
Depth averaged
current velocity
V (mm/s)
Flow
intensity
V/Vc
Shields
parameter
θ
Sediment
median grain
size
d50 (mm)
Measured
nondimensional
scour depth
S/D
16
Unloaded
90 247 0.93 0.39 0.24
0.82
Loaded a 0.74
Unloaded 0.93
Loaded 0.78
Unloaded 0.94
Loaded 0.8
Unloaded 1
Loaded 0.82
Note: Flow depth h = 450 mm, Frequency of cyclic loading = 30 Hz, Amplitude of the cyclic movement at the
481
mudline = 0.1 mm, a Time of application of cyclic loading = 8 hrs.
24 Table 3. Small scale low frequency test programme 483
Test
number
Condition
Depth averaged
current velocity
V (mm/s)
Flow
intensity
V/Vc
Shields
parameter
θ
Frequency of
cyclic loading
(Hz)
Measured
nondimensional
scour depth S/D
17
Unloaded
191 0.83 0.031 0.3
1.92
Loaded a 1.9
Unloaded 2.1
18
Unloaded
191 0.83 0.031 1
1.92
Loaded 1.8
Unloaded 2.06
19
Unloaded
191 0.83 0.031 1
1.92
Loaded
(without
flow) b
1.6
Unloaded 2.02
20
Unloaded
191 0.83 0.031 4
1.92
Loaded 1.64
Unloaded 2
Note: Flow depth h = 165 mm, Sediment median grain size d50 = 0.24 mm, Pile diameter D = 25 mm, Amplitude
484
of the cyclic movement at the mudline = 1 mm, a Applied number of cycle = 54000 cycles, b The current was
485
switched off during the application of cyclic loading.
25 488
Fig. 1. Definition sketch of the experimental arrangement. 489
490
Fig. 2. Scour depth development in a compacted sand compared to the uncompacted case; d = 40 mm, 491
V/Vc = 0.96, d50 = 0.66 mm. 492
0 2 4 6 8 10 12 14 16
0 0.5 1 1.5 2 2.5
0 10 20 30 40 50 60 70
Time (mins) (Initial hour)
S/D
Time (hrs)
Un-compacted bed (Initial hour)
Compacted bed (Initial hour)
Un-compacted bed
26 493
Fig. 3. Scour depth development around static and cyclically loaded piles; D = 40 mm, V/Vc = 0.96, 494
d50 = 0.66 mm. 495
496
Fig. 4. Scour depth development in a two-stage test and an equivalent normal test (without vibration); 497
D = 25 mm, V/Vc = 0.96, d50 = 0.66 mm. 498
0 2 4 6 8 10 12 14 16
0 0.5 1 1.5 2 2.5
0 10 20 30 40 50 60 70
Time (mins) (Initial hour)
S/D
Time (hrs)
Unloaded (Initial hour)
Loaded (Initial hour)
Unloaded
Loaded
0 0.5 1 1.5 2 2.5
0 2 4 6 8 10 12
S/D
Time (hrs)
Unloaded
27 499
500
Fig. 5. Scour depth development in multi-stage test; D = 25 mm, V/Vc = 0.94, d50 = 0.66 mm. 501
502
Fig. 6. Scour depth development in the multi-stage test; D = 90 mm, V/Vc = 0.93, d50 = 0.24 mm. 503
504
0 0.5 1 1.5 2 2.5
0 10 20 30 40 50 60 70 80 90 100
S/D
Time (hrs)
Unloaded
Multi stage
0 0.2 0.4 0.6 0.8 1 1.2
0 20 40 60 80 100 120 140 160
S/D
Time (hrs)
Upstream 45° 90°
Downstream
Un
lo
ad
ed
L
o
ad
ed
Un
lo
ad
ed
L
o
ad
ed
Un
lo
ad
ed
L
o
ad
ed
Un
lo
ad
ed
L
o
ad
ed
Un
lo
ad
28 505
506
Fig. 7. Contour maps of scour hole: a) first equilibrium (unloaded) stage (hour 31), b) fourth loaded 507
stage (hour 144). 508
509
Fig. 8. Contour maps of changes in scour depth: a) during second loaded stage (hours 63 to 71), b) 510
during third unloaded stage (hours 71 to 94). 511
512
29 513
514
Fig. 9. Scour depth development in low frequency tests; D = 25 mm, V/Vc = 0.83, d50 = 0.24 mm. 515
516
Fig. 10. Scour depth during backfilling and recovery caused by vibration: variation plotted against the 517
number of load cycles applied at 3 different frequencies. 518
0 0.5 1 1.5 2 2.5
0 10 20 30 40 50 60 70 80 90 100
S/D
Time (hrs)
4Hz-Small scale
1Hz-Small scale
1 Hz-small scale-No flow
0.3Hz-Small scale
Cyclic loading stage
0 0.5 1 1.5 2 2.5
0 10000 20000 30000 40000 50000 60000
S/D
Number of cycles
4Hz - Small scale
1Hz-Small scale
1Hz-Small scale-No flow
30 519 520 521 522 523 524 525 526 527 528 529 530 531 532 533 534
Fig. 11. Scour hole profiles of (Test 2 Table 3); a) after first equilibrium (unloaded) stage; b) after 535
cyclic loading stage; c) after second equilibrium (unloaded) stage. 536 537 -60 -40 -20 0 20 40
-200 -150 -100 -50 0 50 100 150 200 250
DE P T H ( M M )
LONGITUDINAL DISTANCE (MM)
-50 -40 -30 -20 -10 0 10
-150 -100 -50 0 50 100 150
DEPT
H
(M
M)
TRAVERSE DISTANCE (MM)
-60 -50 -40 -30 -20 -10 0 10
-150 -100 -50 0 50 100 150
DE
PT
H
(MM)
TRAVERSE DISTANCE (MM) -50 -40 -30 -20 -10 0 10
-150 -100 -50 0 50 100 150
DE
PT
H
(MM)
TRAVERSE DISTANCE (MM) -100
-50 0 50
-200 -150 -100 -50 0 50 100 150 200 250
DEPT
H
(M
M)
LONGITUDINAL DISTANCE (MM) -60 -40 -20 0 20 40
-200 -150 -100 -50 0 50 100 150 200 250
DE P T H ( M M )
LONGITUDINAL DISTANCE (MM)
Downstream slope= 26° Upstream slope= 28°
Flow b) -60 -40 -20 0 20 40
-200 -150 -100 -50 0 50 100 150 200 250
DE P T H ( M M )
LONGITUDINAL DISTANCE (MM)
Upstream slope= 37° Downstream slope= 27°
Flow
c)
Upstream slope= 40° Downstream slope= 28°
Flow Base of the pile in place
31 538
539
540
541
Fig. 12. Definition sketch of the changes of a scour hole profile subjected to cyclic movement of the 542
pile through; a) changes to a fully developed equilibrium scour hole by application of the first few 543
cycles, b) simultaneous backfilling and scouring after initial slump. 544