Performance and impact of dynamic data placement in
ATLAS
Thomas Maier1,∗, Thomas Beermann2, Günter Duckeck1, Mario Lassnig3, Federica Legger1,4,MatteoMagoni5, andIlijaVukotic6, on behalf of the ATLAS Collaboration
1Ludwig-Maximilians-Universität München, Germany 2Universität Innsbruck, Austria
3CERN, Geneva, Switzerland 4INFN Turin, Italy
5Politecnico di Torino, Italy 6University of Chicago, USA
Abstract. For high-throughput computing the efficient use of distributed com-puting resources relies on an evenly distributed workload, which in turn re-quires wide availability of input data that is used in physics analysis. In ATLAS, the dynamic data placement agent C3PO was implemented in the ATLAS dis-tributed data management system Rucio which identifies popular data and cre-ates additional, transient replicas to make data more widely and more reliably available. This proceedings presents studies on the performance of C3PO and the impact it has on throughput rates of distributed computing in ATLAS. Fur-thermore, results of a study on popularity prediction using machine learning techniques are presented.
1 Introduction
ATLAS [1] is a general-purpose particle detector located at one of the four interaction points of the Large Hadron Collider (LHC) at CERN. The ATLAS experiment is part of the World-wide LHC Computing Grid [2], which provides the computing resources to distribute and process the vast amount of data created by the detector and events generated by Monte Carlo simulation. The usage of ATLAS physics data can heavily depend on various factors such as the data type or format and the current time period of data processing. However, the number of dataset copies across the Grid is statically set for newly created datasets. For DAOD [3] datasets, which is the relevant data type for the studies presented in this proceedings, this means that they are only available for processing on the storage elements of two computing sites. This can lead to high waiting times for physics analyses due to temporary high demand of datasets or downtime of sites. A dynamic mechanism to identify popular data and dis-tribute additional copies of that data can help to mitigate these issues and overall increase the efficient use of computing resources in the Grid.
This proceedings presents studies on dynamic data placement in ATLAS and data popu-larity prediction, based on accumulated data from various resources, such as historic meta-data of Grid jobs or file access traces. First, a short introduction to the ATLAS distributed
data and workload management systems is given in Section 2. Section 3 introduces the dy-namic data placement tool C3PO, which was developed during the Run-2 phase of the LHC. In Section 4 the analysis of performance and impact of C3PO operations in ATLAS is shown. Finally, the results of a study on data popularity prediction with machine learning techniques are presented in Section 5.
2 ATLAS distributed data and workload management
Recorded ATLAS physics data are managed by the ATLAS distributed data management (DDM) system Rucio [4], which extends its predecessor Don Quijote 2 (DQ2) [5] in terms of scalability, expandability with new technologies and use cases, and lower maintenance effort.
Simulated and detector data are organised in datasets, which are collections of files sharing common properties, such as the simulated physics process or the identification number of the ATLAS data taking run. The copy of a file or dataset at the storage element of a computing site is called a replica. The creation and distribution of new replicas is managed by replica-tion rules, which define the minimum number of replicas to be available on a list of storage elements. Rucio processes replication rules, which creates replica locks for storage elements and issues file transfers until the rules are satisfied.
Grid data processing is orchestrated by the ATLAS workload management system PanDA [6]. Analysis and data production tasks are submitted manually by users or automatically by the ATLAS production system [7] to the PanDA server. With the information from Rucio about the dataset content and location of replicas, PanDA jobs are generated and distributed across available computing resources in the Grid. Jobs are processed at worker nodes via the PanDA pilot system [8]. PanDA sends out pilot wrappers to computing sites where they are further distributed to the worker nodes of the local batch system. The wrappers download and execute the PanDA pilot code, which fetches jobs from the PanDA server suitable for the worker node, stages in input files if needed, executes the job payload, and stages out output files. This is the most common operational scenario for the pilot, which is altered for special computing resources like High Performance Computing facilities.
The ATLAS DDM tracer system [9] collects data of each file access operation executed by PanDA. This provides file access traces with additional information such as the corresponding dataset, the storage element that was accessed and the user associated to the respective PanDA job. The file access data is used by C3PO as well as the analysis of C3PO operations presented in this proceedings to get a measure for dataset accesses.
3 Dynamic data placement tool C3PO
C3PO [10] is a dynamic data placement agent integrated in Rucio which identifies popular datasets from past data accesses for which it creates additional, transient replicas. This helps to inject additional copies of heavily accessed datasets into the Grid and spread the workload more evenly across available computing resources. Currently, C3PO takes into consideration DAOD and NTUP datasets. The latter is the data type used in physics analyses during the Run-1 phase of the LHC. C3PO collects information from different sources to feed a
place-ment algorithm, which employs criteria to decide if new replicas are created and where they are placed. The gathered data contain newly submitted tasks from PanDA and their input dataset(s), network metrics of links between Grid sites, current replica information from Ru-cio, and the datasetpopularity. The latter is a daily aggregation of the file access traces for each dataset, counting the number of PanDA pilot instances that accessed the data.
data and workload management systems is given in Section 2. Section 3 introduces the dy-namic data placement tool C3PO, which was developed during the Run-2 phase of the LHC. In Section 4 the analysis of performance and impact of C3PO operations in ATLAS is shown. Finally, the results of a study on data popularity prediction with machine learning techniques are presented in Section 5.
2 ATLAS distributed data and workload management
Recorded ATLAS physics data are managed by the ATLAS distributed data management (DDM) system Rucio [4], which extends its predecessor Don Quijote 2 (DQ2) [5] in terms of scalability, expandability with new technologies and use cases, and lower maintenance effort. Simulated and detector data are organised in datasets, which are collections of files sharing common properties, such as the simulated physics process or the identification number of the ATLAS data taking run. The copy of a file or dataset at the storage element of a computing site is called a replica. The creation and distribution of new replicas is managed by replica-tion rules, which define the minimum number of replicas to be available on a list of storage elements. Rucio processes replication rules, which creates replica locks for storage elements and issues file transfers until the rules are satisfied.
Grid data processing is orchestrated by the ATLAS workload management system PanDA [6]. Analysis and data production tasks are submitted manually by users or automatically by the ATLAS production system [7] to the PanDA server. With the information from Rucio about the dataset content and location of replicas, PanDA jobs are generated and distributed across available computing resources in the Grid. Jobs are processed at worker nodes via the PanDA pilot system [8]. PanDA sends out pilot wrappers to computing sites where they are further distributed to the worker nodes of the local batch system. The wrappers download and execute the PanDA pilot code, which fetches jobs from the PanDA server suitable for the worker node, stages in input files if needed, executes the job payload, and stages out output files. This is the most common operational scenario for the pilot, which is altered for special computing resources like High Performance Computing facilities.
The ATLAS DDM tracer system [9] collects data of each file access operation executed by PanDA. This provides file access traces with additional information such as the corresponding dataset, the storage element that was accessed and the user associated to the respective PanDA job. The file access data is used by C3PO as well as the analysis of C3PO operations presented in this proceedings to get a measure for dataset accesses.
3 Dynamic data placement tool C3PO
C3PO [10] is a dynamic data placement agent integrated in Rucio which identifies popular datasets from past data accesses for which it creates additional, transient replicas. This helps to inject additional copies of heavily accessed datasets into the Grid and spread the workload more evenly across available computing resources. Currently, C3PO takes into consideration DAOD and NTUP datasets. The latter is the data type used in physics analyses during the Run-1 phase of the LHC. C3PO collects information from different sources to feed a place-ment algorithm, which employs criteria to decide if new replicas are created and where they are placed. The gathered data contain newly submitted tasks from PanDA and their input dataset(s), network metrics of links between Grid sites, current replica information from Ru-cio, and the datasetpopularity. The latter is a daily aggregation of the file access traces for each dataset, counting the number of PanDA pilot instances that accessed the data.
The placement algorithm evaluates the input datasets of tasks submitted to PanDA, for which several requirements must be fulfilled:
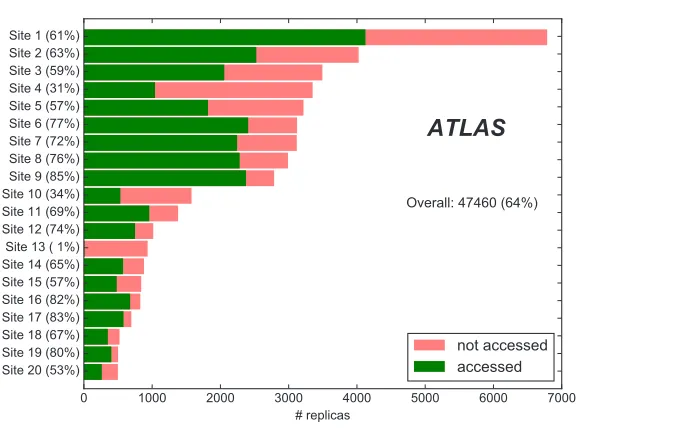
Figure 1.Number ofaccessedandnot accessedreplicas according to the leading 20 sites at which they were created.
• Limit on the number of already existing replicas and whether a replica was created in the past 24 hours.
• Limit on the number of files and bytes C3PO can create per hour, per day, and per destina-tion site.
• Find suitable pair of a site where the replica already exists and a destination site accord-ing to free disk space, network metrics, and past C3PO replica creations to destination candidates.
• Thepopularityof the dataset over the previous seven days is at least eight or at least five tasks have been submitted in the past 24 hours.
When the full selection chain is passed successfully, a new replication rule for the dataset at the selected destination site is issued to Rucio with a lifetime of seven days. After the expiration of the rule, the new replica can be deleted by Rucio when disk space is needed.
4 Performance and impact analysis
The performance of the decision making process of C3PO is measured by the usage of the newly created replicas. The file access traces are used to determine if Grid jobs have accessed a given replica as input or not. This groups the replicas created by C3PO intoaccessedand not accessed, which is used as the main distinction if C3PO made good selection decisions.
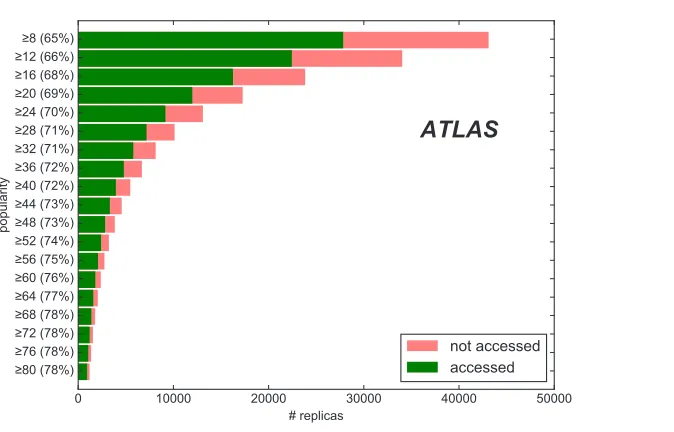
Figure 2.Number ofaccessedandnot accessedreplicas that pass selection on lower thresholds on the
popularityof their associated datasets seven days before the replica creation.
replicas are predominantly placed at a limited number of sites, which leads to an uneven distribution of new dataset copies. Furthermore, thereplica efficiencycan heavily depend on the destination site. This leaves room for improvement for the selection of target replication sites, for example by employing criteria on the currently available computing resources at candidate sites.
As mentioned in Section 3, thepopularityof a dataset in the seven days before the deci-sion evaluation is used by C3PO to identify popular datasets. Thereplica efficiencyprovides a measure for how well this particular metric selects datasets that will be used in the future. Figure 2 shows the C3PO replica distribution according to selection on lower thresholds on thepopularityof their associated datasets seven days before the replica creation. Choosing a high selection threshold decreases the number of replicas that are created by C3PO but in-creases thereplica efficiency, which indicates that thepopularityis a good criterion to select popular datasets. Consequently, increasing or decreasing thepopularitythreshold configura-tion in the placement algorithm can be used to steer the resultingreplica efficiency, at the cost of the number of replicas created.
Various parameters connected to the PanDA tasks or jobs are possible good candidates to use as a gauge for whether the associated datasets are popular or not. Another natural choice as popularity metric is the number of different users that submitted tasks to PanDA, since a bigger pool of users that currently need to process a given dataset increases the probability that any of them will process the dataset again in the future. Figure 3 shows the selection on lower thresholds on the number of users that are associated to the file access traces seven days before the replica creation. While this metric performs worse at low threshold values compared to thepopularity, higherreplica efficiencyvalues with a higher replica yield can be reached.
In order to evaluate the impact of C3PO operations on the performance of Grid job pro-cessing, C3PO was run in an A/B testing mode over the period of 1.5 months. Datasets, which pass the selection criteria of the placement algorithm, are randomly split into Sample
Figure 3.Number ofaccessedandnot accessedreplicas that pass selection on lower thresholds on the number of users that are associated with the file access traces of their associated datasets seven days before the replica creation.
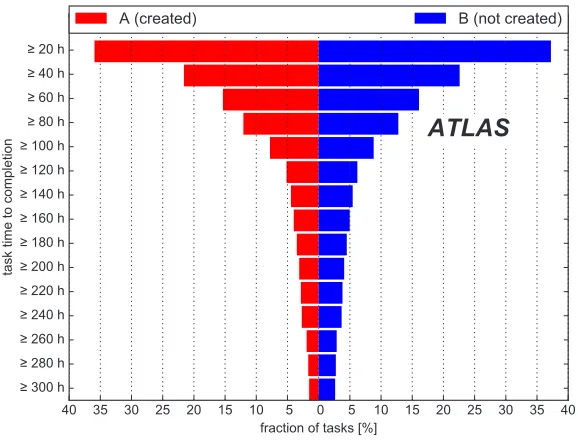
Figure 4.Fraction of tasks associated to Sample A and Sample B that pass selection on lower thresholds on their time to completion.
inac-cessibility of input data or high workload on computing sites, a difference between Sample A
and Sample B is expected to be measured in these metrics.
Figure 4 depicts the distribution of the time to completion (TTC) of tasks that used the datasets of Sample A and Sample B as input. The fraction of tasks that pass selection on lower thresholds on the TTC are shown separately for Sample A and Sample B. A significantly smaller fraction of tasks for Sample A end up in the tails of the TTC distribution, compared to Sample B. This indicates that the additional replicas created by C3PO have a positive effect
on outlier tasks with very long TTC.
5 Popularity prediction with machine learning
C3PO only uses static selections on popularity parameters to select popular datasets for repli-cation. A potential improvement of the decision making process is the inclusion of machine learning techniques to predict the future popularity of datasets according to data usage pat-terns in the past. In the following, results of a study on dataset popularity prediction based on the methodology in Ref. [11] are presented. The machine learning model consists of two steps, the popularity definition evaluation with a selected amount of data and the popularity prediction evaluation of the full considered time period. The AdaBoost algorithm [12] with decision trees is used for the training of both these steps. The input to the training are historic meta-data of Grid jobs that used the evaluated DAOD datasets as input. Four variables, which characterise the dataset, are used as training input:
• The six digit dataset id • The version tag of physics data
• The data period or MC simulation campaign string • The data format string
In order to mark datasets as popular for the prediction training, a popularity definition is constructed using the following strategy:
• Consider Grid job parameters which don’t have a strong dependence on the time period which is evaluated.
• Train four weeks of high statistics data which amount to∼60000 Grid jobs, separately using each parameter for the popularity definition to mark datasets as popular or not popular. • Popularity definition: for a given parameter distribution, the considered dataset falls into
the tailing X% where X is a variable threshold cut.
The considered parameters are the accumulated information of Grid jobs such as the number of associated users or the number of associated tasks. The AdaBoost Decision Tree parameters chosen for the popularity definition training are maximum depth 8, learning rate 0.5, and number of estimators 10. The data is split into 66% training and 33% test data. Applying the training results to the test data, three metrics are considered to identify the most suitable parameter:
• Precision: the fraction of datasets predicted as popular that actually are popular.
• True positive rate (TPR): the fraction of actual popular datasets that have been predicted as popular.
cessibility of input data or high workload on computing sites, a difference between Sample A
and Sample B is expected to be measured in these metrics.
Figure 4 depicts the distribution of the time to completion (TTC) of tasks that used the datasets of Sample A and Sample B as input. The fraction of tasks that pass selection on lower thresholds on the TTC are shown separately for Sample A and Sample B. A significantly smaller fraction of tasks for Sample A end up in the tails of the TTC distribution, compared to Sample B. This indicates that the additional replicas created by C3PO have a positive effect
on outlier tasks with very long TTC.
5 Popularity prediction with machine learning
C3PO only uses static selections on popularity parameters to select popular datasets for repli-cation. A potential improvement of the decision making process is the inclusion of machine learning techniques to predict the future popularity of datasets according to data usage pat-terns in the past. In the following, results of a study on dataset popularity prediction based on the methodology in Ref. [11] are presented. The machine learning model consists of two steps, the popularity definition evaluation with a selected amount of data and the popularity prediction evaluation of the full considered time period. The AdaBoost algorithm [12] with decision trees is used for the training of both these steps. The input to the training are historic meta-data of Grid jobs that used the evaluated DAOD datasets as input. Four variables, which characterise the dataset, are used as training input:
• The six digit dataset id • The version tag of physics data
• The data period or MC simulation campaign string • The data format string
In order to mark datasets as popular for the prediction training, a popularity definition is constructed using the following strategy:
• Consider Grid job parameters which don’t have a strong dependence on the time period which is evaluated.
• Train four weeks of high statistics data which amount to∼60000 Grid jobs, separately using each parameter for the popularity definition to mark datasets as popular or not popular. • Popularity definition: for a given parameter distribution, the considered dataset falls into
the tailing X% where X is a variable threshold cut.
The considered parameters are the accumulated information of Grid jobs such as the number of associated users or the number of associated tasks. The AdaBoost Decision Tree parameters chosen for the popularity definition training are maximum depth 8, learning rate 0.5, and number of estimators 10. The data is split into 66% training and 33% test data. Applying the training results to the test data, three metrics are considered to identify the most suitable parameter:
• Precision: the fraction of datasets predicted as popular that actually are popular.
• True positive rate (TPR): the fraction of actual popular datasets that have been predicted as popular.
• False positive rate (FPR): the fraction of actual unpopular datasets that have been predicted as popular.
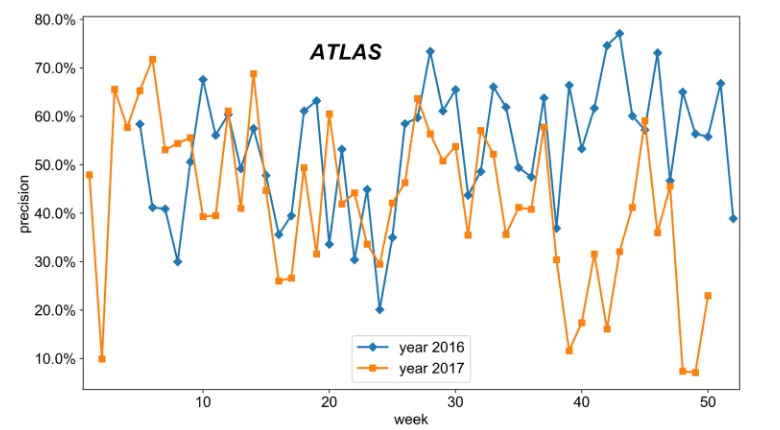
Figure 5.Precision of the popularity prediction for weeks in 2016 and 2017.
The number of users in combination with a 7% threshold cut is chosen as popularity def-inition, since it provides the highest precision and good performance in terms of TPR and FPR.
With this popularity definition the full data of 2016 and 2017 Grid jobs are evaluated. The popularity prediction for a given week is done by training on data of the previous four weeks. In addition to the previously mentioned four training variables, the popularity of the previous three weeks is included in the training input. According to a hyperparameter optimisation, the AdaBoost Decision Tree parameters for the popularity prediction are set to maximum depth 8, learning rate 0.1, and number of estimators 10. Figure 5 shows the precision of the popularity prediction for weeks in 2016 and 2017. In general, the model yields high precision but also large week to week fluctuations. The inconsistency of the resulting precision is an indication that the chosen training period of four weeks is potentially not always sufficient to
get a good popularity prediction.
6 Conclusions
This proceedings presented the analysis of the performance of the C3PO decision making process and the impact that dynamic data placement has on selected metrics related to efficient
Grid data processing in ATLAS. The placement algorithm of C3PO shows good performance in terms of the decisions it makes, as determined by the usage of replicas after their creation. The positive impact of C3PO operations on outlier tasks with a very long time to completion is demonstrated with an A/B testing method applied to the datasets that pass the selection
criteria of C3PO.
Furthermore, the results of a study on popularity prediction with machine learning tech-niques were presented. The prediction model shows promising results with a large array of additional options to explore in order to refine the used methodology.
taking into account available computing resources at computing sites and a more sophisti-cated dataset popularity evaluation, possibly involving machine learning techniques to iden-tify popular datasets.
References
[1] ATLAS Collaboration, "The ATLAS Experiment at the CERN Large Hadron Collider", JINST3, S08003 (2008)
[2] C Eck et al, "LHC computing Grid: Technical Design Report", CERN-LHCC-2005-024 (2005)
[3] J Catmore et al, "A new petabyte-scale data derivation framework for ATLAS", J. Phys.: Conf. Ser.664, 072007 (2015)
[4] V Garonne et al, "Rucio – The next generation of large scale distributed system for ATLAS Data Management", J. Phys.: Conf. Ser.513, 042021 (2014)
[5] V Garonne et al, "The ATLAS Distributed Data Management project: Past and Future", J. Phys.: Conf. Ser.396, 032045 (2012)
[6] T Maeno et al, "Evolution of the ATLAS PanDA workload management system for ex-ascale computational science", J. Phys.: Conf. Ser.513, 032062 (2014)
[7] F H Barreiro et al, "The ATLAS Production System Evolution: New Data Processing and Analysis Paradigm for the LHC Run2 and High-Luminosity", J. Phys.: Conf. Ser.898, 052016 (2017)
[8] P Nilsson et al, "Next Generation PanDA Pilot for ATLAS and Other Experiments", J. Phys.: Conf. Ser.513, 032071 (2014)
[9] D Zang et al, "The ATLAS DDM Tracer monitoring framework", J. Phys.: Conf. Ser.
396, 032119 (2012)
[10] T Beermann et al, "C3PO - A Dynamic Data Placement Agent for ATLAS Distributed Data Management", J. Phys.: Conf. Ser.898, 062012 (2017)
[11] M Magoni, "Development of a model to predict ATLAS data popularity using machine learning techniques", Bachelor thesis University of Pavia (2017)