LETTER
Building damage survey
and microtremor measurements for the source
region of the 2015 Gorkha, Nepal, earthquake
Masumi Yamada
1*, Takumi Hayashida
2, Jim Mori
1and Walter D. Mooney
3Abstract
We performed a damage survey of buildings and carried out microtremor observations in the source region of the 2015 Gorkha earthquake. Our survey area spans the Kathmandu valley and areas to the east and north of the valley. Damage of buildings in the Kathmandu valley was localized, and the percentage of the totally collapsed buildings was less than 5 %. East of the Kathmandu valley, especially in Sindhupalchok district, damage of buildings was more severe. In the center of Chautara and Bahrabise, towns in Sindhupalchok district, the percentage of the totally col‑ lapsed houses exceeded 40 %. North of the Kathmandu valley, the damage was moderate, and 20–30 % of the build‑ ings were totally collapsed in Dhunche. Based on the past studies and our microtremor observations near the strong motion station, the H/V spectrum in Kathmandu has a peak at around 0.3 Hz, which reflects the velocity contrast of the deep sedimentary basin. The H/V spectra in Bahrabise, Chautara, and Dhunche do not show clear peaks, which suggests that the sites have stiff soil conditions. Therefore, the more severe damage outside the Kathmandu valley compared with the relatively light damage levels in the valley is probably due to the source characteristics of the earthquake and/or the seismic performance of buildings, rather than the local site conditions.
Keywords: 2015 Gorkha earthquake, Masonry structure, Earthquake damage, Strong motion, Microtremor survey
© 2016 The Author(s). This article is distributed under the terms of the Creative Commons Attribution 4.0 International License (http://creativecommons.org/licenses/by/4.0/), which permits unrestricted use, distribution, and reproduction in any medium, provided you give appropriate credit to the original author(s) and the source, provide a link to the Creative Commons license, and indicate if changes were made.
Introduction
The 2015 Gorkha earthquake on April 25 killed about 9000 people and injured more than 22,000 in across a broad region of Nepal including the capital city of Kath-mandu (The Ministry of Home Affairs, Government of Nepal 2015). It was the worst natural disaster to strike this country since the 1934 Bihar–Nepal earthquake (Piya 2004). There were only a few strong motion instru-ments operating in the region at the time of the earth-quake (e.g., Center for Engineering Strong Motion Data 2015; Bhattarai et al. 2015; Dixit et al. 2015), so it is diffi-cult to understand the intensity and damage distribution of the earthquake from instrumental records.
We performed a building damage survey in and around the Kathmandu valley to study the distribution of build-ing damage in the source region. We also carried out
microtremor observations at various locations to under-stand the effect of the site amplification on the damage.
Earthquake and strong motion records
The 2015 Gorkha earthquake occurred at 6:11:25 UTC (11:56:25 local time) on 25 April, with a moment magni-tude of 7.8 (USGS 2015). The estimated maximum Mer-calli intensity is IX (USGS 2015). The hypocenter of the earthquake is in the Gorkha district, 80 km northwest of the capital city Kathmandu at a depth of approximately 10 km (USGS 2015). The fault rupture extended from west to east, about 150 km. According to several wave-form inversion studies, the location of the largest slip was estimated to be about 80 km east of the hypocenter in the region north of Kathmandu (Galetzka et al. 2015; Yagi and Okuwaki 2015; Fan and Shearer 2015; USGS 2015; Wang and Fialko 2015; He et al. 2015).
The USGS strong motion station KATNP in Kath-mandu city (Center for Engineering Strong Motion Data 2015; Dixit et al. 2015) recorded the mainshock, and the
Open Access
*Correspondence: masumi@eqh.dpri.kyoto‑u.ac.jp 1 DPRI, Kyoto University, Uji, Japan
acceleration and velocity waveforms are shown in Fig. 1. The sensor records acceleration, and the velocity wave-forms are obtained by integration in time domain after applying a baseline correction (Iwan et al. 1985; Boore 2001). The maximum velocity exceeds 100 cm/s on the EW component. The dominant period of the ground motion is about 5 s (see Fig. 2). Similar characteristics were observed in other seismograms recorded in the valley (Takai et al. 2016). As a comparison with ground motions that have produced severe damage in Japan, we show a record from the 1995 Kobe earthquake in Fig. 2. This recording shows predominant periods of ground motion of 1 to 2 s, whereas the KATNP record has a pre-dominant period that is unusually long period (5 s). This long-period ground motion may be due to the response of the Kathmandu basin (Galetzka et al. 2015). Although the long-period component is large, the shorter-period component (1–2 s) is relatively small, resulting in a peak ground acceleration value of 182 cm/s2 on the UD
component.
Field survey
We performed a damage survey of masonry buildings and microtremor measurements on September 18–24, 2015. Our survey area spans the Kathmandu valley and regions east and north of the valley where we selected several major towns and classified the damage level of buildings. Our selected sites are: Kathmandu, Bhaktapur, Patan, Changunarayan, Nagadesh, and Piker inside the valley, Banepa, Chautara, Khadichaur, and Bahrabise to the east of the valley, and Bidur, Betrawati, and Dunche to the north of the valley. Figure 3a shows the location
of the target area and our survey sites are shown with square symbols (Additional file 1).
Damage survey of masonry structures
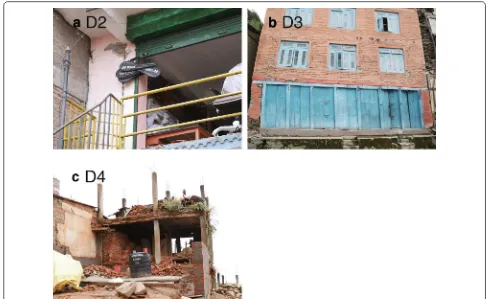
In order to estimate the percentage of totally collapsed buildings in a town, we determined the damage level of the observed masonry structures (both unreinforced and confined reinforced concrete). The damage level is divided into four classes (D1–D4) depending on the integrity of the structural elements (see Fig. 4). D1 build-ings have non-structural damage such as small cracks on walls or fallen plasters, or minor structural damages. These buildings can be used without loss of function. D2 buildings have moderate damage on structural elements, such as failure of walls or cracks on columns, and require additional supports to maintain the seismic performance. D3 buildings have serious damage of structural ele-ments, such as a tilt of the structure, and cannot be used. D4 buildings are totally collapsed or were cleared at the time of the survey. We defined D2 buildings as partially collapsed and D3 and D4 buildings as totally collapsed. Compared with the European Macroseismic Scale (EMS-98), our D2 corresponds to Grade 4 of EMS-98 and D3 and D4 correspond to Grade 5. For the comparison with the ASCE structural performance levels (ASCE41), D1 corresponds to the immediate occupancy (S-1), D2 to the life safety (S-3), and D3 and D4 to the collapse prevention (S-5).
We spent 1–2 h for larger towns and classified 50–100 masonry buildings at each location into the damage cat-egories that are described above. The selected buildings are located in the main business district of each town.
and observations of the damage were shared among the participants in order to obtain a more complete dam-age survey.
Although there were many reports of severe dam-age to older historical structures (e.g., Goda et al. 2015), we focused on the modern houses and shops for consistency. In transit to the various towns, we also recorded the percentage of totally collapsed build-ings with a visual inspection from the vehicle. These records may be less precise and are shown with small circles in Fig. 3a.
Ambient noise measurement
The microtremor survey has been used to evaluate the relationship between the earthquake damage and local site effects (e.g., Chatelain et al. 2008; Hellel et al. 2010; Yamada et al. 2014). We also performed ambient noise measurements to evaluate the near-surface site response characteristics for each town. We used the JU210 instru-ment made by Hakusan Corporation, which includes a three-component accelerometer, data logger, and battery, in a single casing. The sampling frequency was 100 Hz, and the cutoff frequency of the high-cut filter was 30 Hz. We performed these measurements for 5–30 minutes depending on the site condition. Typical 2–3 sites were measured in each town.
0 1000 2000
Acc. Resp. Spec. (cm/s
)
2
0 1 2 3 4 5 6 7 8 9 10
Period (sec)
2015 Gorkha KATNP EW 2015 Gorkha KATNP NS 1995 Kobe JRtakatori NS
Fig. 2 Comparison of acceleration response spectra. The USGS data recorded in Kathmandu KATNP station and the JR Takatori record for the 1995 Kobe earthquake (all measurements have a 5 % damping coefficient)
The towns outside of Kathmandu that were surveyed (Bahrabise, Chautara, and Dhunche) are relatively small, so we were able to see most of the buildings, and we visually confirmed that the damage percentage of buildings selected for a detailed survey is consist-ent with that of the consist-entire town. Four people partici-pated in the survey of each town, and all photographs
a
b
The ratio of the horizontal to vertical spectrum (H/V) at each site is computed from the ambient noise record (Naka-mura 1989), using the following method. First, five segments with 4096 points (40.96 s) were randomly selected from each record and the Fourier amplitude spectrum of each segment was computed. After smoothing the spectra with a filter (Parzen window at 0.05 Hz), each horizontal spectrum is divided by the vertical spectrum. We repeated this selec-tion 100 times, and a set of the five spectra with the smallest variance were selected. In the end, we take the mean of the spectra from the two horizontal components.
Results of the survey Building damage
The percentage of the totally collapsed buildings in each site is shown in Fig. 3a. Damage of buildings in the Kath-mandu valley was localized (Bhaktapur, Sanku, and near the bus terminal in Kathmandu city), and the percent-age of the totally collapsed buildings was less than 5 % in the entire valley (personal communication from the Department of Mines and Geology, DMG). East of the Kathmandu valley, especially in Sindhupalchok district, damage of buildings was severe. In the towns of Chau-tara and Bahrabise, the percentage of the totally collapsed
houses exceeds 40 %. There were also totally destroyed small villages observed on the way to those towns. North of the Kathmandu valley, the damage was moderate, with 20–30 % of the buildings totally collapsed in the towns of Betrawati and Dhunche.
Figure 3a also shows the fatalities in each district with the background color (The Ministry of Home Affairs, Government of Nepal 2015). The distribution of the heav-ily damaged villages was consistent with the distribution of fatalities. The most fatalities are in Sindhupalchok dis-trict, where more than 3000 people were killed (The Min-istry of Home Affairs, Government of Nepal 2015). In our damage survey, two towns in the district (Chautara and Bahrabise) were severely damaged with 40 % of the totally collapsed buildings. This suggests that the substantial fatalities were caused by the collapse of the structures.
Next we focus on four major population centers (Kath-mandu, Bahrabise, Chautara, and Dhunche) and describe the city properties, building types, and damage (see Figs. 5, 6).
Kathmandu
Kathmandu is the capital of the country with a popu-lation of about 1 million people. There are modern
Fig. 4 Photograph of buildings with damage levels D2–D4. a D2: plaster on the column was fallen down. b D3: permanent drift was observed. c
high-rise buildings with reinforced concrete structures in the central business district, but the majority of the build-ings are masonry structures. The USGS strong motion station is located inside the old embassy building in the Thamel district, in the center of the city. There are almost no totally collapsed structures around the station.
Bahrabise
Bahrabise is a village located 60 km east–northeast of Kathmandu, in Sindhupalchowk district. It is located on the Araniko Highway which connects Kathmandu to the Chinese border in the north. The village is developed along this main highway, running along the Sunkoshi River. There are quite a few stone structures in this vil-lage. These are made by piled rubble stones and the sur-face is covered by plaster, with an added decoration of brick pattern on top (EERI and IAEE 2015b). In our field survey, 42 % of buildings were totally collapsed and 11 % were partially collapsed.
Chautara
Chautara is a municipality located 40 km east–northeast of Kathmandu and headquarters of Sindhupalchowk dis-trict. It is a city in a mountainous region with an eleva-tion of approximately 1600 m above sea level. Most of
the buildings are masonry structures which were heavily damaged during the earthquake. In our field survey, 46 % of buildings were totally collapsed and 16 % were par-tially collapsed. Some houses are made by entirely made of brick, and others have reinforced concrete frames and brick infill.
Dhunche
Dhunche is a village located 50 km north of Kathmandu and headquarters of Rasuwa district. It is a village within the Langtang National Park and was popular among hikers before the earthquake. The altitude of the village is about 2000 m. The Pasang Lhamu Highway, connect-ing Kathmandu and Dhunche, was heavily damaged by landslides induced by the earthquake. In our field survey, 27 % of buildings were totally collapsed and 25 % were partially collapsed. Most of the structures are made of brick, with or without reinforced concrete frames (EERI and IAEE 2015a).
Microtremor survey
Figure 6 shows the H/V spectra of the ambient noise measured in Kathmandu, Bahrabise, Chautara, and Dhunche. The location of the measurement in Kath-mandu is near the USGS strong motion station, and
Fig. 5 Photograph of the areas where damage surveys and microtremor measurements were carried out. a Kathmandu, b Bahrabise, c Chautara, d
C1 C2
C3 K1 K2
K3
D1 D2 B1 B2
B3
C4 C5
a Kathmandu
c Chautara
b Bahrabise
d Dhunche
0.1 1 10 100
H/V
1 10
Frequency (Hz)
0.1 0.2
0.2
0.2
0.2 1 10 100
H/V
1 10
Frequency (Hz)
0.1 1 10 100
H/V
1 10
Frequency (Hz)
0.1 1 10 100
H/V
1 10
Frequency (Hz)
200m
200m
B3
200m
B2 B1
C3 C2
C1 C4
C5
200m
D2 D1 K3
K2
K1
others are close to the centers of the towns. We per-formed multiple measurements within the damage sur-vey area and confirmed that the major characteristics of the spectra were consistent among the measurements.
The H/V spectrum in Kathmandu has a single peak at around 0.3 Hz. The frequency of this peak is consistent with the past studies (Paudyal et al. 2012, 2013) and reflects the velocity contrast of the deep sedimentary basin (Paud-yal et al. 2012, 2013; Sakai et al. 2002). This low-frequency basin response is generally consistent with the long-period (0.2 Hz) transient waves that were excited by the Gorkha earthquake, as seen on the strong motion record (Galetzka et al. 2015). The frequency is somewhat different; however, we note that the predominant period of the soil structure tends to become longer under strong shaking.
The H/V spectra in Bahrabise, Chautara, and Dhunche do not show clear peaks, which suggests that there is no strong contrast in the velocity structure. Since these areas located mountainous areas, we think the site conditions are rather stiff and effect of the near-surface amplifica-tion is probably not large (Bonnefoy-Claudet et al. 2009).
Discussion
Our field survey shows relatively less damage in the Kath-mandu valley and more significant damage east of the val-ley. The source models generated by near-source GPS and teleseismic waveform inversions suggest that the maxi-mum slip is 20–30 km north of Kathmandu. The long-period pulse originating from this large slip caused the transient response in the Kathmandu valley and generated long-period ground motions with a predominant period of 5 s. However, this period is probably too long to cause severe damage to the low-rise masonry structures. We measured the natural period of several masonry structures in Kathmandu during the field survey and found they were 3–4 Hz for two story buildings. The recorded long-period ground motion may have caused more serious damage if there had been many high-rise buildings in the city.
The cause of the significant damage east of Kathmandu valley is more difficult to explain. Since the structure types are low-rise masonry buildings, the natural period of buildings is about a few Hz. Therefore, the ground motion should have included more high-frequency con-tent to cause the serious damage in structures that we observed. Since the earthquake rupture propagated from west to east (Galetzka et al. 2015) and the towns are located in the direction of propagation from the large slip (see Fig. 3b), seismic directivity may contribute to the strong shaking in the eastern region.
Difference in the seismic performance of structures is also one of the possible reasons of the damage. Although majority of construction was a masonry structure, there are various forms of masonry, consisting of solid brick,
concrete block, or stone, with either cement or mud mor-tar connection (Bhatmor-tarai and Conway 2010; Shrestha et al. 2012). Reinforcement of concrete frame also some-time exists. The percentage of reinforced buildings affects on the damage ratio of buildings. Our microtremor sur-vey in Bahrabise and Chautara showed the effect of near-surface soil amplification is probably minor and at least that is not the cause of the severe damage.
Note that since our survey was performed after the M 7.3 aftershock of May 12, 2015, it is difficult to definitively separate the damage due to the mainshock from that caused by the aftershock. However, at most of the sites the USGS ShakeMap predicts that the strong motion of the mainshock was larger than that of aftershock. On-site interviews with local residents confirmed that most damage was due to the April 25, 2015, mainshock. However, some of the observed damage at easternmost sites close to the May 12 aftershock, such as Bahrabise, may have been caused by the aftershock.
Conclusions
We performed a damage survey of buildings and carried out microtremor observations in and around the Kath-mandu valley to estimate distribution of damage and ground motions of the 2015 Gorkha earthquake.
Damage of buildings in the Kathmandu valley was het-erogeneous, but overall, the percentage of the totally col-lapsed buildings was less than 5 % in the Kathmandu valley. On the other hand, outside of the Kathmandu valley, espe-cially to the east, damage to buildings was more severe, exceeding 40 % of totally collapsed buildings in Chautara and Bahrabise. Our preliminary survey was limited in space and resolution, and more complete survey is required to obtain a complete assessment of the damage distribution.
Based on the past studies and our microtremor obser-vations near the strong motion station, the H/V spectrum in Kathmandu has a peak at around 0.3 Hz, which reflects the velocity contrast of the deep sedimentary basin. The H/V spectra in Bahrabise, Chautara, and Dhunche, which are in severely damaged areas, do not show clear peaks, which suggests that the soil conditions have stiff proper-ties. Therefore, the more severe damage outside the Kath-mandu valley compared with the relatively light damage levels in the valley is probably due to the source character-istics of the earthquake and/or the seismic performance of buildings, rather than the local site conditions.
Additional file
Authors’ contributions
MY and TH were involved in study conception and design; MY, TH, JM, and WDM were involved in acquisition of data; MY and JM drafted the manuscript. All authors read and approved the final manuscript.
Author details
1 DPRI, Kyoto University, Uji, Japan. 2 Building Research Institute, Tsukuba, Japan. 3 USGS, Menlo Park, CA, USA.
Acknowledgements
We thank Dr. Amod Mani Dixit of the National Society for Earthquake Technol‑ ogy—Nepal for providing useful data. We also acknowledge Dr. Soma Nath Sapkota, Lok Bijaya Adhikari, and Mukunda Bhattarai in DMG for meaningful discussions. The field survey was funded by the J‑RAPID program of the Japan Science and Technology Agency. The strong motion data are provided by the Center for Engineering Strong Motion Data. We would like to thank reviewers (Drs. Brad Aagaard, Erol Kalkan, and others) for their insightful comments on the paper.
Competing interests
The authors declare that they have no competing interests.
Received: 17 January 2016 Accepted: 7 June 2016
References
Bhattarai K, Conway D (2010) Urban vulnerabilities in the Kathmandu valley, Nepal: visualizations of human/hazard interactions. J Geogr Inf Syst 2(02):63
Bhattarai M, Adhikari LB, Gautam UP, Laurendeau A, Labonne C, Hoste‑ Colomer R, Sbe O, Hernandez B (2015) Overview of the large 25 April 2015 Gorkha, Nepal, earthquake from accelerometric perspectives. Seismol Res Lett 86(6):1540–1548
Bonnefoy‑Claudet S, Baize S, Bonilla LF, Berge‑Thierry C, Pasten C, Cam‑ pos J, Volant P, Verdugo R (2009) Site effect evaluation in the basin of Santiago de Chile using ambient noise measurements. Geophys J Int 176(3):925–937
Boore DM (2001) Effect of baseline corrections on displacements and response spectra for several recordings of the 1999 Chi‑Chi, Taiwan, earthquake. Bull Seismol Soc Am 91(5):1199–1211
Center for Engineering Strong Motion Data (2015). http://strongmotioncenter. org/. Accessed 10 Oct 2015
Chatelain J‑L, Guillier B, Parvez IA (2008) False site effects: the Anjar case, fol‑ lowing the 2001 Bhuj (India) earthquake. Seismol Res Lett 79(6):816–819 Dixit AM, Ringler AT, Sumy DF, Cochran ES, Hough SE, Martin SS, Gibbons S,
Luetgert JH, Galetzka J, Shrestha SN (2015) Strong‑motion observations of the m 7.8 Gorkha, Nepal, earthquake sequence and development of the n‑shake strong‑motion network. Seismol Res Lett 86(6):1533–1539 EERI, IAEE (2015a) World housing encyclopedia, Pillar walaghar (URM infilled
RC frame buildings). http://db.world‑housing.net/building/145. Accessed 1 Dec 2015
EERI, IAEE (2015b) World housing encyclopedia, uncoarsed rubble stone masonry walls with timber floor and roof. http://db.world‑housing.net/ building/74. Accessed 1 Dec 2015
Fan W, Shearer PM (2015) Detailed rupture imaging of the 25 April 2015 Nepal earthquake using teleseismic p waves. Geophys Res Lett 42(14):5744–5752
Galetzka J, Melgar D, Genrich JF, Geng J, Owen S, Lindsey EO, Xu X, Bock Y, Avouac J‑P, Adhikari LB (2015) Slip pulse and resonance of the Kathmandu basin during the 2015 Gorkha earthquake, Nepal. Science 349(6252):1091–1095
Goda K, Kiyota T, Pokhrel RM, Chiaro G, Katagiri T, Sharma K, Wilkinson S (2015) The 2015 Gorkha Nepal earthquake: insights from earthquake damage survey. Front Built Environ 1
He X, Ni S, Ye L, Lay T, Liu Q, Koper KD (2015) Rapid seismological quantifica‑ tion of source parameters of the 25 April 2015 Nepal earthquake. Seismol Res Lett 86(6):1568–1577
Hellel M, Chatelain J‑L, Guillier B, Machane D, Salem RB, Oubaiche EH, Had‑ doum H (2010) Heavier damages without site effects and site effects with lighter damages: Boumerdes city (Algeria) after the May 2003 earthquake. Seismol Res Lett 81(1):37–43
Iwan WD, Moser MA, Peng C‑Y (1985) Some observations on strong‑motion earthquake measurement using a digital accelerograph. Bull Seismol Soc Am 75(5):1225–1246
Nakamura Y (1989) A method for dynamic characteristics estimation of subsurface using microtremor on the ground surface. Railw Tech Res Inst Q Rep 30(1)
Paudyal YR, Yatabe R, Bhandary N, Dahal R (2012) A study of local amplification effect of soil layers on ground motion in the Kathmandu valley using microtremor analysis. Earthq Eng Eng Vib 11(2):257–268
Paudyal YR, Yatabe R, Bhandary NP, Dahal RK (2013) Basement topography of the Kathmandu basin using microtremor observation. J Asian Earth Sci 62:627–637
Piya B (2004) Generation of geological database for liquefaction hazard assess‑ ment in Kathmandu Valley. PhD thesis, International Institute for Geo‑ information Science and Earth Observation, Enschede, Netherlands Sakai H, Fujii R, Kuwahara Y (2002) Changes in the depositional system of the
Paleo‑Kathmandu lake caused by uplift of the Nepal Lesser Himalayas. J Asian Earth Sci 20(3):267–276
Shrestha H, Pradhan S, Guragain R (2012) Experiences on retrofitting of low strength masonry buildings by different retrofitting techniques in Nepal. In: 15th world conference on earthquake engineering, Lisbon, Portugal Takai N, Shigefuji M, Rajaure S, Bijukchhen S, Ichiyanagi M, Dhital MR, Sasatani
T (2016) Strong ground motion in the Kathmandu valley during the 2015 Gorkha, Nepal, earthquake. Earth Planets Space 68:10
The Ministry of Home Affairs, Government of Nepal (2015) Nepal earthquake 2015: disaster recovery and reconstruction information platform. http:// drrportal.gov.np/ndrrip/main.html?id=0. Accessed 10 Oct 2015 USGS (2015) Earthquake Hazards Program, M7.8–36km E of Khudi,
Nepal. http://earthquake.usgs.gov/earthquakes/eventpage/ us20002926#general_summary. Accessed 10 Oct 2015 Wang K, Fialko Y (2015) Slip model of the 2015 Mw 7.8 Gorkha (Nepal)
earthquake from inversions of ALOS‑2 and GPS data. Geophys Res Lett 42(18):7452–7458
Yagi Y, Okuwaki R (2015) Integrated seismic source model of the 2015 Gorkha, Nepal, earthquake. Geophys Res Lett 42(15):6229–6235