R E S E A R C H A R T I C L E
Open Access
Clinical interventions that influence vaginal
birth after cesarean delivery rates:
Systematic Review & Meta-Analysis
Aireen Wingert
1, Lisa Hartling
1,2, Meghan Sebastianski
2, Cydney Johnson
1, Robin Featherstone
1,2,
Ben Vandermeer
1and R. Douglas Wilson
3*Abstract
Background:To systematically review the literature on clinical interventions that influence vaginal birth after cesarean (VBAC) rates.
Methods:We searched Ovid Medline, Ovid Embase, Wiley Cochrane Library, CINAHL via EBSCOhost; and Ovid PsycINFO. Additional studies were identified by searching for clinical trial records, conference proceedings and dissertations. Limits were applied for language (English and French) and year of publication (1985 to present). Two reviewers independently screened comparative studies (randomized or non-randomized controlled trials, and observational designs) according to a priori eligibility criteria: women with prior cesarean sections; any clinical intervention or exposure intended to increase the VBAC rate; any comparator; and, outcomes reporting VBAC, uterine rupture and uterine dehiscence rates. One reviewer extracted data and a second reviewer verified for accuracy. Meta-analysis was conducted using Mantel-Haenszel (random effects model) relative risks (VBAC rate) and risk differences (uterine rupture and dehiscence). Two reviewers independently conducted methodological quality assessments using the Mixed Methods Appraisal Tool (MMAT).
Results:Twenty-nine studies (six trials and 23 cohorts) examined different clinical interventions affecting rates of vaginal deliveries among women with a prior cesarean delivery (CD). Methodological quality was good overall for the trials; however, concerns among the cohort studies regarding selection bias, comparability of groups and outcome measurement resulted in higher risk of bias. Interventions for labor induction, with or without cervical ripening, included pharmacologic (oxytocin, prostaglandins, misoprostol, mifepristone, epidural analgesia), pharmacologic (membrane sweep, amniotomy, balloon devices), and combined (pharmacologic and non-pharmacologic). Single studies with small sample sizes and event rates contributed to most comparisons, with no clear differences between groups on rates of VBAC, uterine rupture and uterine dehiscence.
Conclusions:This systematic review evaluated clinical interventions directed at increasing the rate of vaginal delivery among women with a prior CD and found low to very low certainty in the body of evidence for cervical ripening and/or labor induction techniques. There is insufficient high-quality evidence to inform optimal clinical interventions among women attempting a trial of labor after a prior CD.
Keywords:Vaginal birth after cesarean, Trial of labor after cesarean, Systematic review, Meta-analysis
© The Author(s). 2019Open AccessThis article is distributed under the terms of the Creative Commons Attribution 4.0 International License (http://creativecommons.org/licenses/by/4.0/), which permits unrestricted use, distribution, and reproduction in any medium, provided you give appropriate credit to the original author(s) and the source, provide a link to the Creative Commons license, and indicate if changes were made. The Creative Commons Public Domain Dedication waiver (http://creativecommons.org/publicdomain/zero/1.0/) applies to the data made available in this article, unless otherwise stated.
* Correspondence:doug.wilson@ahs.ca
3Department of Obstetrics and Gynecology, Cumming School of Medicine,
Background
Over 103,000 cesarean deliveries (CDs) occurred in 2017 within Canadian hospitals [1]. In Canada, CDs continue to be the leading inpatient surgery with elective/sched-uled CD as a main contributor. Since 1997, the rate of CD has increased from 18.7 to 28.2% in 2017, and fre-quency of this delivery method continues on an upward trend [1,2]. Globally, rates of cesarean sections are con-sidered high at an estimated 21% of livebirths in 2015, based on data from 169 countries [3].
A number of factors influencing the increase of this surgical delivery method include changes in healthcare practice styles, patient preferences, pressures of malprac-tice and demographic influences (e.g., social, economic, cultural) [4–10]. These influences can affect delivery op-tions/choice and may result in complex pregnancies that ultimately require a CD [11, 12]. Short- and long-term morbidity risks for the infant and mother are further in-fluenced by the etiology or indication of their CD; how-ever, overall risk of morbidity and mortality is more positively associated with CD compared to vaginal deliv-ery [13–16]. This risk warrants careful consideration of potential post-operative complications before scheduled CD, a major abdominal surgery. Recent ‘Early Recovery After Cesarean’ (ERAS) for CD guidelines (Part 1–3) have been published to reduce maternal and neonatal morbidity and mortality [17].
For women who have undergone a prior CD, there is uncertainty regarding the choice of a repeat/scheduled CD or attempting a vaginal delivery for a successive pregnancy as both modes of birth have risks. The Society of Obstetricians and Gynaecologists of Canada (SOGC), the American College of Obstetricians and Gynecolo-gists (ACOG) and the Royal College of Obstetricians and Gynaecologists (RCOG) recommend that a trial of labor be offered to women with one previous transverse low-segment CD [18–20]. Vaginal birth after cesarean (VBAC) may be desired by some women, but the patient-level benefits associated with VBAC including avoiding repeat abdominal surgery and risk of complica-tions in future pregnancies must be considered against the potential risks of a failed trial of labor after cesarean (TOLAC) with subsequent maternal and neonatal mor-bidity, including an unplanned repeat CD [18]. While the risk for uterine rupture of the previous cesarean inci-sion scar is low (single CD 0.72%; double CD 1.59%) there is maternal and neonatal risk [21].
Many studies have examined factors that are associ-ated with a greater likelihood of a successful TOLAC, commonly identifying a history of successful vaginal de-livery [22–24] and women who present in spontaneous labor [19,22] as significant predictors.
Due to high global cesarean rates, the promotion of VBAC may be one option to reduce the overall number
of cesarean deliveries. Clinical interventions that posi-tively impact the rate of vaginal deliveries for women choosing a VBAC need to be examined. This systematic review aimed to synthesize and evaluate the research on clinical interventions that could be directed at or used by patients, families, healthcare providers, and hospitals/ health systems to influence the success of VBAC. A sys-tematic review of‘adjunct’ clinical interventions that in-fluence the uptake and success of VBAC has been completed and published [4].
Methods
This study followed standardized methods and guide-lines for systematic reviews [25,26], and used an a priori protocol (available from authors).
Literature search
A research librarian searched the following databases in May 2017: Ovid Medline (1946-), Ovid Embase (1980-), Wiley Cochrane Library (inception-), CINAHL via EBS-Cohost (1937-) and Ovid PsycINFO (1806-). Limits were applied for language (English and French) and publica-tion year (1985). Update searches were done in Novem-ber 2018 only in databases from which the included studies were found (Medline and Embase). The search strategy used the Cochrane Proceeding Citation Indexes (Clarivate Analytics) and hand-searched meeting ab-stracts (2015–2017) from the following associations: The Society for Maternal-Fetal Medicine (SMFM), the Society of Obstetricians and Gynaecologists of Canada (SOGC), and the American Congress of Obstetricians and Gynecol-ogists. Finally, we searched ClinicalTrials.gov and Pro-Quest Dissertations & Theses Global (1861-). Reference lists of relevant systematic reviews were reviewed for po-tentially eligible studies. The detailed search strategy is in Additional file1: Appendix 1.
Eligibility criteria
home births) were eligible. All study designs (random-ized [RCT] and non-randomized controlled trials [NRCT], and observational studies) with a comparison group were eligible for inclusion. Studies were not con-sidered eligible if: all women had three or more prior ce-sareans; multiple births of three or more fetuses were explicitly included; there was an absence of an exposure or intervention, or an inappropriate exposure/interven-tion was used (e.g., predicexposure/interven-tion models, pelvimetry, non-clinical interventions such as guidelines for providers); there was absence of a comparator, or an inappropriate comparator was used (e.g., no data for comparison groups in before-after study designs, women without a previous CD); VBAC rates were not reported; or, they were not primary research (e.g., letter, editorial, com-mentary). Systematic reviews were not included; refer-ence lists therein were screened for potentially relevant studies.
Study selection
Two reviewers (CJ and AW) independently screened ti-tles and abstracts using a priori eligibility criteria. Full texts of potentially relevant publications were retrieved and independently reviewed in duplicate for inclusion; disagreements were resolved through discussion or third-reviewer (MS) consultation.
Data extraction
One reviewer extracted data and another verified data from each included study using a pre-specified and piloted form. Data were extracted for relevant study characteristics (design features), population (number of previous cesarean deliveries, parity), intervention, com-parator, outcome (VBAC rate [the number of women with a previous CD who undergo a successful vaginal delivery]; uterine rupture rate [the number of women who experience a uterine rupture among those who at-tempt a vaginal delivery]; and, uterine dehiscence rate [the number of women who experience a uterine dehis-cence among those who attempt a vaginal delivery]), funding source, and setting.
Intention-to-treat results were extracted from individ-ual studies whenever possible. For dichotomous data (rates of VBAC, uterine rupture and uterine dehiscence), we reported counts or proportions, and sample size, by study arm. Results of statistical tests (e.g., p-values) or summary statistics (e.g., odds ratio [OR], risk ratio [RR], with confidence intervals [CI]) were extracted whenever these were reported within the studies.
Assessment of methodological quality
Two reviewers (CJ and AW) independently assessed the methodological quality of included studies; disagree-ments were resolved via consensus. All studies were
assessed using the Mixed Methods Appraisal Tool (MMAT) [27].
Data synthesis
For rates of VBAC, we reported a relative risk and statis-tically pooled these using the DerSimonian and Laird random effects model with Mantel-Haenszel weights and corresponding 95% CIs. Risk difference (RD) was used for rare outcomes with small event rates (uterine rupture and uterine dehiscence). Statistical heterogeneity was quantified using the I-squared statistic.
Decisions to pool studies were based on comparability of clinical (e.g., treatment) and methodological (i.e., study design) characteristics across studies.
Analyses were performed using Review Manager Ver-sion 5.3 [28].
Assessment of overall certainty of evidence
Two reviewers (MS and AW) assessed the certainty of the body of evidence for each outcome using the Grad-ing of Recommendations Assessment, Development and Evaluation (GRADE) [29], with disagreements resolved through discussion or consultation with a third reviewer (LH). Certainty was assigned initially as high for evi-dence from trials and low for evievi-dence from observa-tional studies. Each of five domains was then assessed for potential downgrading: study limitations/risk of bias, inconsistency, indirectness, imprecision, and publication bias. An overall score was determined for each outcome using the GRADE certainty of evidence categories: high, moderate, low or very low.
Results
The literature search yielded 5833 unique records. After screening titles and abstracts, 339 potentially relevant ar-ticles were identified. Full text screening identified 29 relevant studies [30–58]. The screening process is illus-trated in Fig. 1. Table 1 provides a summary of the in-cluded studies; detailed study characteristics are in Additional file1: Appendix 2.
All studies included patients who delivered in a health-care setting.
Studies included a range of 32 to 12,676 women (me-dian 237 women), aged 17 to 45 (among 24 studies). Nine studies (31%) reported parity (range 1 to 12). Among three studies [35, 40, 53] (10%) that reported women with a prior CD, women with a single cesarean comprised the highest proportion of the study popula-tion (> 80%), while those with two prior cesarean births (two studies [35, 40]; 650 women) represented approxi-mately 14 to 20%. Eight studies [31, 39, 40, 42, 43, 49,
53, 57] (28%) reported a range of 12 to 64% of women
experienced both a cesarean and vaginal delivery [37]. Two studies (7%) reported women with (6% versus 31%, balloon catheter versus oxytocin, respectively) [53], and without (greater than 90%) [49], a history of VBAC. Three studies (10%) reported women with a Bishop’s score at study entry or just prior to labor induction (range 0 to 6) [46,49,52]. Six studies [33,34,38,41,44, 55] (21%) did not report any baseline demographic in-formation for the study population.
Induction of labor is the artificial stimulation of labor be-fore its spontaneous onset to achieve vaginal delivery, taking into account the status/readiness of the cervix (termed“ fa-vorable”or“ripe”) prior to initiating the labor process [59]. Cervical ripening or induction of labor can be achieved using non-pharmacologic methods, pharmacologic agents, or some combination of both techniques, each with advan-tages and disadvanadvan-tages. Mechanical and surgical methods are forms of non-pharmacologic induction, including mem-brane stripping, balloon catheters, or amniotomy (artificial rupture of membranes) [60]. Pharmacologic agents com-monly used for cervical ripening or induction of labor in-clude prostaglandin (PGE2 analog, in gel or pessary form), misoprostol (PGE1 analog), or mifepristone [60].
All studies examined some manner of cervical ripening and/or labor induction in the intervention group, usually compared to a group of women undergoing spontaneous labor or expectant pregnancy management.
Many cervical ripening and labor induction methods were represented by the included studies.
Twenty-six studies [30–45,48,50–58] (90%) examined the effects of at least one pharmacologic agent on VBAC rates, including prostaglandins, oxytocin, mifepristone and epidural analgesia. Ten studies [31, 33, 43, 46–49,
53,54,57] (34%) examined non-pharmacologic or
mech-anical methods (membrane sweeping, amniotomy, bal-loon devices) in at least one intervention arm.
Studies reported adverse maternal/neonatal outcomes, in addition to VBAC rates, including uterine rupture (10 studies [31,35,37,39,43,47,48,53,56,57]; 34%), uterine dehiscence (four studies [40–42,55]; 14%), and both uter-ine rupture and dehiscence (13 studies [30,32,34,36,38,
44–46, 49–52, 54]; 45%). Eleven (38%) studies provided
definitions of uterine rupture, with indications of“ disrup-tion of previous scar”,“separation”, “tear” or“rupture” of the uterine wall or peritoneum, and/or extrusion of fetal parts [30,36,37,39,46,48,51,53,54,57,58].
[image:4.595.57.544.87.430.2]Table 1Summary of included studies
Publication year median 2003 (range 1984–2017)
Country N (%)
France, Germany, Hong Kong, Kazakhstan, Morocco, Mozambique, Oman, Poland, Saudi Arabia 1, each (31%)
India, UK 2, each (14%)
Israel 3 (10%)
US 13 (45%)
Funding N (%)
Non-industry funded 4 (14%)
Industry-funded 1 (3%)
No funding 2 (7%)
NR 22 (76%)
Study design N (%)
RCT 6 (21%)
Cohort, prospective 12 (41%)
Cohort, retrospective 11 (38%)
Study sample size Median 237 (range 32–12,676)
Maternal agea Range 17-45y
Proportion of women with any prior vaginal deliveryb Range 12–64%
Interventions - pharmacologic N (%)
Pharmacologic (all) 19 (66%)
PGE2 vs. no PGE2 1 (3%)
PGE1 vs. spontaneous labor 2 (6%)
PGE2 vs. spontaneous labor 3 (10%)
PGE2 vs. expectant management 1 (3%)
Oxytocin vs. no oxytocin 2 (7%)
Oxytocin (AUG) vs. expectant management 1 (3%)
Oxytocin vs. PGE2 1 (3%)
Oxytocin vs. PGE2 vs. spontaneous labor 1 (3%)
Oxytocin (IND) vs. oxytocin (AUG) vs. no oxytocin 3 (10%)
Oxytocin vs. (PGE1 + oxytocin [AUG]) vs. (PGE2 + oxytocin [AUG]) vs. spontaneous labor 1 (3%)
Oxytocin vs. prostanglandin (NS) vs. (oxytocin+prostaglandin [NS]) vs. amniotomy vs. spontaneous labor 1 (3%)
Mifepristone +/−prostaglandin (NS) +/−(amniotomy+oxytocin+epidural) vs. placebo 1 (3%)
Epidural analgesia vs. no epidural analgesia 1 (3%)
Interventions–non-pharmacologic N (%)
Non-pharmacologic (all) 3 (10%)
Membrane sweep vs. spontaneous labor/no intervention 2 (6%)
Foley catheter 30 mL vs. Foley catheter 80 mL 1 (3%)
Interventions–pharmacologic +/−non-pharmacologic N (%)
Pharmacologic +/−non-pharmacologic (all) 7 (24%)
Oxytocin vs. (PGE1 +/−amniotomy [IND/AUG]) vs. spontaneous labor 1 (3%)
Foley catheter vs. oxytocin vs. (Foley+oxytocin) vs. PGE2 vs. spontaneous labor 1 (3%)
Foley catheter +/−oxytocin +/−PGE2 +/−amniotomy vs. spontaneous labor 1 (3%)
Oxytocin +/−PGE1 +/−Foley catheter vs. expectant management 1 (3%)
PGE2 vs. PGE2 + balloon catheter 1 (3%)
Of the studies reporting rupture or dehiscence, three
[32, 45, 50] (10%) also reported uterine
hyper-stimulation and three [41, 42, 44] (10%) also reported uterine atony; these outcomes were not included in ana-lyses as they were considered clinically-related but dis-tinct from the review’s outcomes of interest.
Methodological quality of included studies (Table2and Additional file1: Appendix 3)
All of the studies reported a clear research question or objective and collected data that addressed the intended research question.
Of the six RCTs: five [40, 45, 46, 49, 50] (83%) re-ported a clear description of randomization and of allo-cation concealment; all reported adequate outcome data (i.e., outcome data available for at least 80% of women) and had low withdrawals or drop-outs (i.e., fewer than 20% of women dropped out of the study) [40,45,46,49,
50,56].
Of the 23 cohort studies: 17 [31,33,35,38,39,41–44,
47,48,51–55,58] (74%) recruited participants in a
man-ner that minimized selection bias; 11 [31, 32, 34, 36, 38,
41, 42, 44, 48, 51, 54] (48%) used appropriate
measure-ments for intervention(s) and outcomes; and, nine [30–
32,37,38,42,43,57,58] (39%) ensured that participants
were comparable between groups at the beginning of the study or accounted for differences. All studies reported adequate data for the primary outcome of VBAC rates.
VBAC rates
Effect estimates for VBAC rates are summarized in Table3. There was low to very low certainty of evidence for all comparisons involving pharmacologic, pharmacologic, and combined (pharmacologic and non-pharmacologic) induction methods.
Pharmacologic induction
Nineteen (66%) studies compared a pharmacologic inter-vention to spontaneous labor, no interinter-vention, or
another pharmacologic agent. Many comparators were reported by a single study. Four cohort studies compar-ing PGE1 to spontaneous labor showed no significant differences between groups on VBAC rates (three pro-spective cohorts [30, 34, 57], RR 1.08, 95% CI 0.67 to 1.75; I2 = 92%; and, one retrospective cohort [33], RR 0.75, 95% CI 0.59 to 0.95). One RCT of PGE2 compared to spontaneous labor found no significant differences be-tween groups (RR 1.04, 95% CI 0.85 to 1.28) [50]. One study found increased rates of VBAC among women not induced versus induction using PGE2 (RR 0.67, 95% CI 0.61 to 0.73) [35]. Four prospective cohort studies found no significant differences between PGE2 and spontan-eous labor on rates of VBAC (RR 0.98, 95% CI 0.87 to 1.10; I2= 32) [32, 37, 38, 58]. One retrospective cohort comparing an PGE2 with spontaneous labor found no significant differences in VBAC rates (RR 0.94, 95% CI 0.78 to 1.13) [54]. Increased VBACs among women with spontaneous labor compared with oxytocin were found in two studies (RR 0.80, 95% CI 0.76 to 0.85; I2 = 0%)
[36,41] but no significant differences were reported
be-tween oxytocin and spontaneous labor from six retro-spective cohorts [33,38,42,51,54,57] (RR 0.88, 95% CI 0.72 to 1.07, I2= 91%).
[image:6.595.57.539.98.195.2]One retrospective cohort found increased rates of VBAC among women undergoing spontaneous labor versus women induced with PGE1 and oxytocin (RR 0.69, 95% CI 0.60 to 0.80) [33]. Two studies showed con-flicting results comparing oxytocin for induction to oxy-tocin for augmentation (one prospective cohort [41], RR 1.04, 95% CI 0.83 to 1.32; one retrospective cohort [51], RR 0.66, 95% CI 0.50 to 0.88). No significant differences were found for oxytocin compared to PGE1 (one retro-spective cohort [33], RR 0.90, 95% CI 0.67 to 1.19). No significant differences in VBAC rates between oxytocin and PGE2 were found in one RCT [56] (RR 0.88, 95% CI 0.63 to 1.24), one prospective cohort [38] (RR 0.90, 95% CI 0.78 to 1.04) and one retrospective cohort [54] (RR 1.05, 95% CI 0.86 to 1.28). One RCT of mifepristone
Table 1Summary of included studies(Continued)
Amniotomy vs. oxytocin vs. PGE1 vs. spontaneous labor 1 (3%)
Outcomes N (%)
Studies reporting spontaneous onset of labor in addition to VBAC 4 (14%)
Studies reporting assisted vaginal delivery 8 (28%)
Studies reporting uterine dehiscenceconly 4 (14%)
Studies reporting uterine dehiscencecand uterine rupture 13 (45%)
Studies reporting uterine rupture 22 (76%)
NRnot reported,NSnot specified,PGE1prostaglandin E1 (e.g., misoprostol),PGE2prostaglandin E2 (e.g., dinoprostone gel, dinoprostone inserts),RCTrandomized controlled trial,UKUnited Kingdom,USUnited States,vsversus,yyear(s)
a
based on studies that provided data on maternal age (n= 21) b
based on studies that provided data on prior vaginal delivery (proportion of women in each study arm,n= 8) c
Table 2 Summary of methodological quality of included studies MMAT a criteria Scre ening questions Quant itative/ contro l group Quantit ative non-random ized Total Study
Clear research questions or objec
[image:7.595.73.519.88.736.2]Table 2 Summary of methodological quality of included studies (Continued) MMAT a criteria Scre ening questions Quant itative/ contro l group Quantit ative non-random ized Total Study
Clear research questions or objec
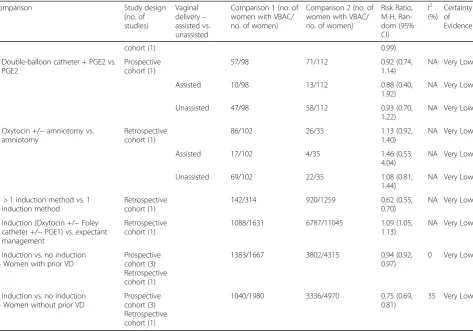
Table 3Effect estimates and certainty of evidence for clinical interventions that influence VBAC rates
Comparison Study design
(no. of studies)
Vaginal delivery– assisted vs. unassisted
Comparison 1 (no. of women with VBAC/ no. of women)
Comparison 2 (no. of women with VBAC/ no. of women)
Risk Ratio, M-H, Ran-dom (95% CI)
I2 (%)
Certainty of Evidence
Pharmacologic induction
PGE1 vs. spontaneous labor Prospective cohort (3)
150/206 343/453 1.08 (0.67,
1.75)
92 Very Low
Retrospective cohort (1)
21/30 156/167 0.75 (0.59,
0.95)
NA Very Low
PGE2 vs. spontaneous labor RCT (1) 82/143 83/151 1.04 (0.85,
1.28)
NA Low
Assisted 12/143 9/151 1.41 (0.61,
3.24)
NA Low
Unassisted 70/143 74/151 1.00 (0.79,
1.26)
NA Low
Prospective cohort (4)
215/314 820/1253 0.98 (0.87,
1.10)
32 Very Low
Assisted 4/97 60/931 0.64 (0.24,
1.72)
NA Very Low
Unassisted 58/97 524/931 1.06 (0.89,
1.26)
NA Very Low
Retrospective cohort (1)
37/54 3111/4263 0.94 (0.78,
1.13)
NA Very Low
Oxytocin vs. spontaneous labor/no oxytocin
Prospective cohort (2)
509/774 1400/1734 0.80 (0.76,
0.85)
0 Very Low
Retrospective cohort (6)
539/771 3785/5090 0.88 (0.72,
1.07)
91 Very Low
PGE1 + oxytocin vs. spontaneous labor
Retrospective cohort (1)
73/113 156/167 0.69 (0.60,
0.80)
NA Very Low
Mifepristone vs. placebo RCT (1) 11/16 8/16 1.38 (0.76,
2.48)
NA Very Low
Assisted 5/16 4/16 1.25 (0.41,
3.82)
NA Very Low
Unassisted 6/16 4/16 1.50 (0.52,
4.32)
NA Very Low
Epidural analgesia vs. no epidural Retrospective cohort (1)
77/87 125/150 1.06 (0.96,
1.18)
NA Very Low
Oxytocin (induction) vs. oxytocin (augmentation)
Prospective cohort (1)
23/32 177/257 1.04 (0.83,
1.32)
NA Very Low
Retrospective cohort (1)
28/48 22/25 0.66 (0.50,
0.88)
NA Very Low
Active inpatient management (+/− oxytocin) vs. expectant outpatient management (+/−oxytocin)
RCT (1) 80/95 77/93 1.02 (0.90,
1.15)
NA Very Low
Assisted 17/95 19/93 0.88 (0.49,
1.58)
NA Very Low
Unassisted 63/95 58/93 1.06 (0.86,
1.32)
NA Very Low
Oxytocin vs. PGE1 Retrospective
cohort (1)
52/83 21/30 0.90 (0.67,
1.19)
NA Very Low
Oxytocin vs. PGE2 RCT (1) 15/21 17/21 0.88 (0.63,
1.24)
NA Very Low
Assisted 4/21 5/21 0.80 (0.25,
2.57)
NA Very Low
Table 3Effect estimates and certainty of evidence for clinical interventions that influence VBAC rates(Continued)
Comparison Study design
(no. of studies)
Vaginal delivery– assisted vs. unassisted
Comparison 1 (no. of women with VBAC/ no. of women)
Comparison 2 (no. of women with VBAC/ no. of women)
Risk Ratio, M-H, Ran-dom (95% CI)
I2 (%)
Certainty of Evidence
1.59)
Prospective cohort (1)
135/208 105/146 0.90 (0.78,
1.04)
NA Very Low
Retrospective cohort (1)
183/254 37/54 1.05 (0.86,
1.28)
NA Very Low
PGE2 vs. no PGE2 Prospective
cohort (1)
233/453 3513/4569 0.67 (0.61,
0.73)
NA Very Low
Induction (oxytocin, misoprostol + oxytocin augmentation, PGE2) vs. spontaneous labor
Retrospective cohort (1)
33/57 138/179 0.75 (0.59,
0.95)
NA Very Low
Non-pharmacologic induction
Foley catheter vs. spontaneous labor
Retrospective cohort (1)
221/375 3111/4263 0.81 (0.74,
0.88)
NA Very Low
Membrane sweep vs. no membrane sweep/spontaneous labor
RCT (1) 13/75 14/75 0.93 (0.47,
1.84)
NA Very Low
Retrospective cohort (1)
31/62 49/79 0.81 (0.60,
1.09)
NA Very Low
Assisted 13/62 19/79 0.87 (0.47,
1.62)
NA Very Low
Unassisted 18/62 30/79 0.76 (0.47,
1.24)
NA Very Low
Amniotomy vs. spontaneous labor Prospective cohort (1)
39/62 65/96 0.93 (0.73,
1.18)
NA Very Low
Retrospective cohort (1)
477/575 3111/4263 1.14 (1.09,
1.18)
NA Very Low
30 mL Foley catheter vs. 80 mL Foley catheter
RCT (1) 18/77 15/77 1.20 (0.65,
2.20)
NA Low
Assisted 12/77 11/77 1.09 (0.51,
2.32)
NA Low
Unassisted 6/77 4/77 1.50 (0.44,
5.11)
NA Low
Foley catheter vs. Amniotomy Retrospective cohort (1)
221/375 477/575 0.71 (0.65,
0.78)
NA Very Low
Pharmacologic vs. Non-pharmacologic or Combined (pharmacologic + non-pharmacologic)
Induction (Foley catheter, PGE2 or oxytocin) vs. spontaneous labor
Prospective cohort (1)
33/52 193/268 0.88 (0.71,
1.10)
NA Very Low
Induction (oxytocin, prostaglandin or amniotomy) vs. spontaneous labor
Prospective cohort (1)
2165/3259 6477/8519 0.87 (0.85,
0.90)
NA Very Low
Induction (oxytocin, prostaglandin, Foley catheter +/−surgical) vs. spontaneous labor
Retrospective cohort (1)
1062/1576 3111/4263 0.92 (0.89,
0.96)
NA Very Low
Oxytocin vs. Foley catheter Retrospective cohort (1)
183/254 221/375 1.22 (1.09,
1.37)
NA Very Low
Oxytocin vs. Amniotomy Retrospective
cohort (1)
183/254 477/575 0.87 (0.80,
0.95)
NA Very Low
Oxytocin vs. Cook balloon + oxytocin
Retrospective cohort (1)
106/150 32/64 1.41 (1.08,
1.84)
NA Very Low
PGE2 vs. Foley catheter Retrospective
cohort (1)
37/54 221/375 1.16 (0.95,
1.42)
NA Very Low
versus placebo found no significant difference in VBAC rates (RR 1.38, 95% CI 0.76 to 2.48) [45]. A retrospective cohort found no significant differences in VBACs for women with versus without epidural analgesia (RR 1.06, 95% CI 0.96 to 1.18) [52]. Increased VBACs were found among women undergoing spontaneous labor compared with women induced with multiple pharmacologic agents (PGE2, misoprostol with oxytocin augmentation, and oxytocin alone) (RR 0.75, 95% CI 0.59 to 0.95) [55]. One RCT of active inpatient management compared to expectant management (both groups had some women with and without oxytocin) found no significant differ-ences in VBAC rates (RR 1.02, 95% CI 0.90 to 1.15) [40].
Non-pharmacologic induction
Five (17%) studies compared a mechanical induction modality to spontaneous labor or no intervention, or compared two different mechanical induction methods
[46,47,49,54,57]. One RCT found no significant
differ-ences in VBAC rates between 30 mL and 80 mL Foley catheters (RR 1.20, 95% CI 0.65 to 2.20) [46]. Another RCT found for no significant differences in VBACs
among women induced with versus without membrane sweeping (RR 0.93, 95% CI 0.47 to 1.84) [49]. Increased rates of VBAC were seen among women undergoing spontaneous labor compared with women induced with a Foley catheter (RR 0.81, 95% CI 0.74 to 0.88) [54]. The same retrospective cohort found higher rates of VBAC among women induced with amniotomy versus Foley catheter (RR 0.71, 95% CI 0.65 to 0.78) [54]. No signifi-cant differences in VBAC rates were found between membrane sweep induction in a retrospective cohort (RR 0.81, 95% CI 0.60 to 1.09) [47], or amniotomy in two cohorts (RR 1.06, 95% CI 0.88 to 1.28) compared with spontaneous labor [54,57].
Pharmacologic and non-pharmacologic (combined)
[image:11.595.63.537.98.429.2]Seven (24%) studies compared one arm of combined pharmacologic and non-pharmacologic induction methods [30, 39, 43, 44, 48, 53, 54]. One cohort study found increased rates of VBAC among women undergo-ing spontaneous labor compared with women induced with any of prostaglandin (unspecified analog), oxytocin or amniotomy (RR 0.87, 95% CI 0.85 to 0.90) [39]. One
Table 3Effect estimates and certainty of evidence for clinical interventions that influence VBAC rates(Continued)
Comparison Study design
(no. of studies)
Vaginal delivery– assisted vs. unassisted
Comparison 1 (no. of women with VBAC/ no. of women)
Comparison 2 (no. of women with VBAC/ no. of women)
Risk Ratio, M-H, Ran-dom (95% CI)
I2 (%)
Certainty of Evidence
cohort (1) 0.99)
Double-balloon catheter + PGE2 vs. PGE2
Prospective cohort (1)
57/98 71/112 0.92 (0.74,
1.14)
NA Very Low
Assisted 10/98 13/112 0.88 (0.40,
1.92)
NA Very Low
Unassisted 47/98 58/112 0.93 (0.70,
1.22)
NA Very Low
Oxytocin +/−amniotomy vs. amniotomy
Retrospective cohort (1)
86/102 26/35 1.13 (0.92,
1.40)
NA Very Low
Assisted 17/102 4/35 1.46 (0.53,
4.04)
NA Very Low
Unassisted 69/102 22/35 1.08 (0.81,
1.44)
NA Very Low
> 1 induction method vs. 1 induction method
Retrospective cohort (1)
142/314 920/1259 0.62 (0.55,
0.70)
NA Very Low
Induction (Oxytocin +/−Foley catheter +/−PGE1) vs. expectant management
Retrospective cohort (1)
1088/1631 6787/11045 1.09 (1.05,
1.13)
NA Very Low
Induction vs. no induction - Women with prior VD
Prospective cohort (3) Retrospective cohort (1)
1383/1667 3802/4315 0.94 (0.92,
0.97)
0 Very Low
Induction vs. no induction - Women without prior VD
Prospective cohort (3) Retrospective cohort (1)
1040/1980 3336/4970 0.75 (0.69,
0.81)
35 Very Low
Risk ratios that are statistically significant have been bolded
cohort study found increased rates of VBAC among women undergoing expectant management compared with women induced with any of oxytocin, Foley cath-eter and/or PGE1 (RR 0.1.09, 95% CI 1.05 to 1.13) [48]. No significant differences in VBAC rates were found be-tween any of PGE2, oxytocin or Foley catheter with spontaneous labor in one cohort study (RR 0.88, 95% CI 0.71 to 1.10) [31]. One cohort study found increased VBACs among women induced with Cook balloon and oxytocin (combined) versus oxytocin only (RR1.41, 95% CI 1.08 to 1.84) [53]. Two cohort studies (n= 3) compar-ing pharmacologic and mechanical (combined) with ei-ther pharmacologic or mechanical induction methods found no significant differences on rates of VBAC: double-balloon catheter and PGE2 versus PGE2 only (RR 0.92, 95% CI 0.74 to 1.14) [43]; and, amniotomy and oxytocin versus amniotomy only (RR 1.13, 95% CI 0.92 to 1.40) [44]. One retrospective cohort comparing mul-tiple with a single induction method found increased VBAC rates for women induced with a single method (RR 0.62, 95% CI 0.55 to 0.70) [54].
Pharmacologic versus non-pharmacologic
One cohort study compared pharmacologic with mech-anical induction methods [54]. No significant differences in VBAC rates were found between PGE2 and Foley catheter (RR 1.16, 95% CI 0.95 to 1.42) [54]. Women in-duced surgically (amniotomy) had increased VBAC rates compared with women induced with PGE2 (RR 0.83, 95% CI 0.69 to 0.99) or with oxytocin (RR 0.87, 95% CI 0.80 to 0.95) but no significant differences were found between oxytocin and Foley catheter (RR 1.22, 95% CI 1.09 to 1.37) [54].
Assisted versus unassisted vaginal deliveries
Several studies stratified VBAC rates according to assisted versus unassisted (spontaneous) vaginal delivery. Among the RCTs, there were no significant differences in one trial [50] comparing PGE2 with spontaneous labor (assisted, RR 1.41, 95% CI 0.61 to 3.24 versus un-assisted, RR 1.00, 95% CI 0.79 to 1.26) and another trial [46] comparing 30 mL Foley catheter with 80 mL Foley catheter (assisted, RR 1.09, 95% CI 0.51 to 2.32 versus unassisted, RR 1.50, 95% CI 0.44 to 5.11). No significant differences between groups were found in other RCTs
[40,45,56] and cohort studies [44,47,58] (various
com-parisons) that stratified vaginal deliveries as assisted or unassisted (very low certainty of evidence).
Among five cohort studies [37, 39, 41–43] reporting VBAC rates for women with and without a prior vaginal delivery, four that compared induction with no induc-tion were pooled. Results showed increased rates of VBAC among women with a prior vaginal delivery whose labor was not induced (RR 0.94, 95% CI 0.92 to
0.97; I2= 0%), and for women without a prior vaginal de-livery whose labor was not induced (RR 0.75, 95% CI 0.69 to 0.81; I2= 35%) [37,39,41,42].
Uterine rupture rates
Of the studies that reported on uterine rupture, most had zero cases among study arms. Effect estimates are summarized in Table4. All comparisons for pharmaco-logic, non-pharmacopharmaco-logic, combined (pharmacologic and non-pharmacologic) induction methods provided low to very low certainty of evidence.
Pharmacologic induction
One RCT reported no cases of uterine rupture in either group comparing PGE2 with no induction (RD 0.00, 95% CI −0.01 to 0.01) [50]. A small RCT (n= 16) com-paring mifepristone with placebo also found no signifi-cant differences between groups (RD 0.00, 95% CI−0.11 to 0.11) [45]. All other pharmacologic induction agents compared with spontaneous labor or no intervention (all cohort studies) on rates of uterine rupture found no sig-nificant differences: PGE1 (two studies [30, 34], RD -0.01, 95% CI−0.10 to 0.08; I2= 83%), PGE2 (six studies
[31, 32, 35, 37, 38, 58], RD 0.00, 95% CI 0.00 to 0.01;
I2 = 0%), and oxytocin (3 studies [36, 38, 51], RD 0.00, 95% CI 0.00 to 0.01; I2= 0%). No significant differences in uterine ruptures were found among single cohort studies comparing epidural analgesia with no interven-tion (zero events; RD 0.00, 95% CI −0.02 to 0.02) [52], and oxytocin with PGE2 (RD 0.00, 95% CI −0.01 to 0.01) [38].
Non-pharmacologic induction
One RCT found no significant differences in uterine ruptures between induction with Foley catheters (30 mL versus 80 mL) (RD 0.00, 95% CI−0.04 to 0.04) [46]. No significant differences between membrane sweeping and spontaneous labor were found from one RCT [49] (RD 0.00, 95% -0.03, 0.03) and one cohort study [47] (RD 0.00, 95% CI−0.03 to 0.03).
Pharmacologic and non-pharmacologic (combined)
compared with women induced with oxytocin and Cook’s balloon (RD 0.01, 95% CI−0.02 to 0.04) [53]. No significant differences were found between PGE2 and PGE2 with double-balloon catheter (combined) in one cohort study (RD -0.01, 95% CI−0.03 to 0.02) [43].
Uterine dehiscence rates
Effect estimates for uterine dehiscence rates are summa-rized in Table 5. All comparisons involving pharmaco-logic, non-pharmacologic and combined (pharmacologic and non-pharmacologic) induction methods provided low to very low certainty of evidence.
Pharmacologic induction
One small RCT found no differences in cases of uterine dehiscence between mifepristone and placebo (n= 32; RD 0.00, 95% CI −0.17 to 0.17) [45]. No differences were found in uterine dehiscence rates comparing in-duction (oxytocin, PGE1 or PGE2) and no inin-duction (RD 0.05, 95% CI −0.02 to 0.12) [55]. No differences were found in rates of uterine dehiscence among women induced with PGE1 (two cohort studies [30, 34], RD 0.02, 95% CI −0.06 to 0.09), PGE2 (two cohort studies
[32, 38], RD 0.01, 95% CI −0.01 to 0.02) or oxytocin
[image:13.595.55.538.99.547.2](five cohort studies [36,38,41,42,51], RD 0.01, 95% CI Table 4Effect estimates and quality of evidence for clinical interventions that influence uterine rupture rates
Comparison No. of studies Comparison 1 (no. of
women with uterine rupture/no. of women)
Comparison 2 (no. of women with uterine rupture/no. of women)
Risk Difference, M-H, Random (95% CI)
I2 (%)
Certainty of Evidence
Pharmacologic induction
PGE1 vs. spontaneous labor Prospective
cohort (2)
3/117 21/357 -0.01 (−0.10,
0.08)
83 Very Low
PGE2 vs. no PGE2/spontaneous labor RCT (1) 0/143 0/151 0.00 (−0.01,
0.01)
NA Low
Prospective cohort (6)
7/819 38/6090 0.00 (0.00, 0.01) 0 Very Low
Oxytocin vs. spontaneous labor/no oxytocin
Prospective cohort (2) Retrospective cohort (1)
2/766 1/1621 0.00 (0.00, 0.01) 0 Very Low
Epidural analgesia vs. no epidural Retrospective cohort (1)
0/87 0/150 0.00 (−0.02,
0.02)
NA Very Low
Mifepristone vs. placebo RCT (1) 0/16 0/16 0.00 (−0.11,
0.11)
NA Low
Oxytocin vs. PGE2 Prospective
cohort (1)
0/208 0/146 0.00 (−0.01,
0.01)
NA Very Low
Non-pharmacologic induction
Membrane sweep vs. spontaneous labor
RCT (1) 0/62 0/61 0.00 (−0.03,
0.03)
NA Very Low
Retrospective cohort (1)
0/62 0/79 0.00 (−0.03,
0.03)
NA Very Low
Pharmacologic vs. Non-pharmacologic or Combined (pharmacologic + non-pharmacologic)
Oxytocin + amniotomy vs. PGE2 + amniotomy
RCT (1) 0/21 1/21 -0.05 (−0.17,
0.07)
NA Very Low
Oxytocin vs. Cook balloon + oxytocin Retrospective cohort (1)
2/150 0/64 0.01 (−0.02,
0.04)
NA Very Low
Double-balloon catheter + PGE2 vs. PGE2
Prospective cohort (1)
0/98 1/112 -0.01 (−0.03,
0.02)
NA Very Low
30 mL Foley catheter vs. 80 mL Foley catheter
RCT (1) 1/77 1/77 0.00 (−0.04,
0.04)
NA Low
Induction (oxytocin, prostaglandin, oxytocin + prostaglandin, or amniotomy) vs. spontaneous labor
Prospective cohort (1)
35/3259 54/8519 0.00 (0.00, 0.01) NA Very Low
Induction (oxytocin +/−PGE1 +/− Foley catheter) vs. expectant management
Retrospective cohort (1)
22/1631 59/11045 0.01 (0.00, 0.01) NA Very Low
0.00 to 0.02), when compared with spontaneous labor. One cohort study found no significant differences in uterine dehiscence rates between women with and with-out epidural analgesia (RD 0.04, 95% CI −0.01 to 0.09) [52]. No significant differences were found for uterine dehiscence cases between induction with oxytocin versus PGE2 (one cohort study [38], RD 0.00, 95% CI−0.02 to 0.01) or amniotomy and oxytocin (combined) versus amniotomy only (one cohort study [44], RD 0.04, 95% CI −0.02 to 0.09). One RCT found increased rates of uterine dehiscence among women managed actively (as inpatients) compared with women managed expectantly (as outpatients), where some women received oxytocin in both groups (RD 0.05, 95% CI 0.00 to 0.10) [40].
Non-pharmacologic induction
One RCT found no differences in uterine dehiscence rates comparing 30 mL and 80 mL Foley catheters (RD -0.06, 95% CI −0.14 to 0.01) [46]. Another RCT found no difference comparing membrane sweeping with
spontaneous labor (one RCT, RD -0.02, 95% CI−0.06 to 0.03) [49].
Pharmacologic and non-pharmacologic (combined)
One cohort study found no significant differences in rates of uterine dehiscence between women with (any of PGE2, oxytocin, amniotomy with or without Foley cath-eter) and without induction (RD 0.00, 95% CI −0.01 to 0.01) [54].
Discussion
[image:14.595.57.535.99.442.2]Overall, there is low to very low certainty of evidence for clinical interventions that influence rates of VBAC, owing to downgrading mainly for the GRADE domains of risk of bias, inconsistency and imprecision. Many of the comparisons were based on single studies with small sample sizes and event rates. The interventions were heterogeneous and focused on pharmacologic and/or mechanical methods of induction. Most of the evidence showed no significant differences between groups on VBAC rates, with very low certainty of evidence. There Table 5Effect estimates and certainty of evidence for clinical interventions that influence uterine dehiscence rates
Comparison No. of studies Comparison 1 (no. of women
with uterine dehiscence/no. of women)
Comparison 2 (no. of women with uterine dehiscence/no. of women)
Risk Difference, M-H, Random (95% CI)
I2
(%) Quality
Pharmacologic induction
PGE1 vs. spontaneous labor Prospective
cohort (2)
5/117 6/357 0.02 (−0.06, 0.09) 65 Very
Low
PGE2 vs. spontaneous labor Prospective
cohort (2)
1/171 0/222 0.01 (−0.01, 0.02) 0 Very
Low
Oxytocin vs. spontaneous labor Prospective
cohort (3) Retrospective cohort (2)
21/1113 16/2298 0.01 (0.00, 0.02) 20 Very
Low
Mifepristone vs. placebo RCT (1) 1/16 1/16 0.00 (−0.17, 0.17) NA Low
Epidural analgesia vs. no epidural Retrospective
cohort (1)
4/87 1/150 0.04 (−0.01, 0.09) NA Very
Low
Oxytocin vs. PGE2 Prospective
cohort (1)
1/208 1/146 0.00 (−0.02, 0.01) NA Very
Low
Active inpatient management (+/−oxytocin)
vs. expectant outpatient management (+/−
oxytocin)
RCT (1) 5/95 0/93 0.05 (0.00, 0.10) NA Very
Low
Non-pharmacologic induction
Membrane sweep vs. spontaneous labor RCT (1) 0/62 1/61 -0.02 (−0.06, 0.03) NA Very
Low
30 mL Foley catheter vs. 80 mL Foley catheter RCT (1) 2/77 7/77 −0.06 (−0.14,
0.01)
NA Low
Pharmacologic vs. Non-pharmacologic or Combined (pharmacologic + non-pharmacologic)
Oxytocin +/−amniotomy vs. amniotomy Retrospective
cohort (1)
4/102 0/35 0.04 (−0.02, 0.09) NA Very
Low
Induction (PGE2, oxytocin, amniotomy and/or Foley catheter) vs. spontaneous labor
Retrospective cohort (1)
13/1576 36/4263 0.00 (−0.01, 0.01) NA Very
Low
Induction (oxytocin, PGE2, misoprostol + oxytocin [augmentation]) vs. spontaneous labor
Retrospective cohort (1)
4/57 3/179 0.05 (−0.02, 0.12) NA Very
Low
was some evidence of higher VBAC rates among women who undergo spontaneous labor, when compared to women whose labors are induced, regardless of method or agent used for induction; however, there was very low certainty in this body of evidence.
Other systematic reviews of clinical interventions have been reported in the literature. Catling-Paull et al exam-ined the effect of clinical interventions on the uptake or success of VBACs and found that inductions of labor by amniotomy, prostaglandins, or oxytocin (or a combin-ation of these methods) were associated with lower rates of vaginal deliveries (six RCTs and 28 cohort studies) [61]. The review also examined prognostic criteria/fac-tors and concluded that pelvimetry may adversely affect women’s chances of a VBAC, scoring systems are not clinically useful, and there is lack of sufficient data to in-form the value of assessing methods of cesarean closures for predicting successful vaginal deliveries [61]. A Cochrane systematic review compared women (with a prior CD) undergoing cervical ripening and/or labor in-duction with placebo, no treatment or other methods, and found overall moderate to low certainty of evidence for the varied interventions represented among the small number of included studies, concluding insufficient availability and high-quality of evidence to determine the optimal method of labor induction [62].
Strengths and limitations of study
This systematic review of clinical interventions for influ-encing VBAC rates encompassed a broad range of study designs and strategies for cervical ripening and/or labor induction. The nature of the labor process and difficulty blinding women or healthcare providers to interventions lends few studies to an RCT design. Unsurprisingly, nearly 80% of the studies were cohort designs. However, observational studies have inherent biases due to con-founding and there were concerns among the included cohorts regarding comparability of population character-istics between groups. Few studies adequately reported maternal characteristics. Some studies included women with only one CD while others enrolled women with multiple cesarean deliveries, a documented risk of in-creased uterine rupture among women attempting a VBAC. Additionally, few studies reported parity, type of previous uterine incision, prior vaginal delivery, prior VBAC, or indication(s) for previous CD. The concept of spontaneous labor among most studies is erroneously represented in that women in a comparator group (as opposed to the intervention group) are often managed expectantly, where they may or may not then progress to spontaneous labor [18]. Further, spontaneous onset of labor is often used synonymously with spontaneous de-livery. One outcome of induction of labor (versus ex-pectant management) is induction success (or failed
induction) distinguished from VBAC success. Ambigu-ous operationalization of these concepts may result in important differences in outcomes. Among women who were induced, studies often did not provide data for the number of women whose labor was augmented. While VBAC was reported by all studies, other perinatal out-comes were unreported or undefined despite following up women to delivery. Four (14%) studies did not report whether there were cases of uterine ruptures in their study population. Among studies that reported on uter-ine ruptures and/or uteruter-ine dehiscence, authors defuter-ined these outcomes inconsistently (and without a cited refer-ence) or they were not explicitly differentiated from each other, or they were undefined altogether. Contextual and mediating factors, such as induction-to-labor interval or co-interventions were sparsely reported for women in all study arms.
Implications for practice
The ability for the maternity care provider to use this evidence to counsel women with a previous CD so they have the information to make the best choice for their situation is a goal of this systematic review. Ananth et al completed a population based study, in the USA, to show the impact of scheduled/repeat CD on the total number of unscheduled/emergency and scheduled/re-peat CD [63]. From 1979 to 2010, unscheduled and scheduled CD increased 68% (95% CI 67–69) and 178% (95% CI 176–179), respectively [63]. For the total num-ber of deliveries in 2010, 18.5 and 14.4% were unsched-uled and schedunsched-uled CDs, respectively [63]. Maternal factors attributed to the unscheduled cesarean increases were increased maternal age, obesity and chronic hyper-tension [63]. Clinical impact for the scheduled CD group of 14.4% (likely higher in 2019) requires better VBAC in-formation for maternal education and choice [63].
study showed that induction of labor is associated with decreased pregnancy-related hypertension and increased time in labor and delivery [66]. A Cochrane review com-pared induction of labor at or beyond term with
expect-ant management in uncomplicated, singleton
pregnancies, with no parity factor identified; they re-ported that induction was associated with lower risk of perinatal death, stillbirth and fewer cesarean section, but more operative vaginal birth and no change for perineal trauma, postpartum hemorrhage, stillbirth, low Apgar score, or neonatal distress [67].
While the studies show heterogeneity and certainty of evidence is low to very low, the uterine rupture and de-hiscence rates among studies are very clinically equiva-lent to rates reported in the literature (ruptures, pharmacological/non-pharmacological/combined for each comparison group 0.56, 0.70%; 0, 0; 1.05, 0.65%, re-spectively and dehiscence, pharmacological/non-pharmacological/combined for each comparison group 2.10, 0.76%; 1.44, 0.72%; 1.21, 0.87%, respectively). These findings can support the safety of oxytocin use for ripen-ing alone and in combination with mechanical methods to allow amniotomy as commented above.
Candidates for TOLAC
Various maternal characteristics, clinical history, and presenting labor indications associated with likelihood of VBAC have been reported in the literature. Factors asso-ciated with increased risk of maternal morbidity from a TOLAC include: prior classical cesarean section or T in-cision as a contraindication [18–20], previous low seg-ment cesarean section where the uterus was closed in a single layer [19], less than 18-month delivery inter-val [19], medical induction or augmentation of labor as compared to spontaneous labor [20], medical induction of labor with misoprostol [18, 19] or PGE2 [19], and in-creasing number of prior CDs [19].
A previous successful trial of vaginal delivery is associ-ated with greater likelihood of successful VBAC; alterna-tively, the history of a failed trial of vaginal delivery requires a CD [15, 20,68,69]. Multiple obstetrical indi-cations for inducing labor or considering CD, also need to be considered (e.g., post-dates, hypertension, macro-somia, intra-uterine growth restriction, unfavorable cer-vix) [20, 70]. Different induction methods may have differential effects on progress of labor, and the impact on mode of delivery. Limited evidence from RCTs on methods of labor induction have not been able to deter-mine which method results in greater benefits and lower risks [62].
Evidence-based guidelines comparison from the US (2010 version), Canada (2005 version) and United King-dom (2007 version) show similarities and differences in recommendations for VBAC process [71]. Uterine
rupture is identified as the most serious complication among women attempting a trial of labor; however, there is recognition that differences in the definition may contribute to the reported incidence rates [71]. With regards to induction of labor, all three guidelines agree that induction and augmentation of labor is an op-tion for women attempting a VBAC, but there is an in-creased risk of uterine rupture with inappropriate use of oxytocin [71]. Both the American College of Obstetri-cians and Gynecologists (ACOG) and SOGC recom-mend against PGE1 for the same outcome, with the SOGC guideline recommending PGE2 only in rare cir-cumstances [71]. All three guidelines agree that women with a history of one or two uncomplicated low-transverse CD and no contraindications to VBAC should be educated, counselled and offered a TOLAC [71]. The SOGC’s updated guidelines (July 2019) continue to sup-port the previous recommendation of offering women (without contraindications) the option of a TOLAC [19]. The new guideline provides details on the likelihood of VBAC (greater among women with spontaneous labor, lower among women with factors that negatively affect this likelihood), the risk of uterine rupture (baseline risk of 0.47% among women with a prior CD; higher relative risk of uterine rupture, but low absolute risks for women attempting TOLAC compared with elective repeat cesarean section; risk greatest for women over 40 weeks of gestation; use of fetal monitoring is recommended as an indicator of the presence of uterine rupture), risk of other outcomes (higher relative risk of maternal and perinatal morbidity, but lower absolute risks for women attempting TOLAC compared with elective repeat cesarean section; higher relative risk of maternal death for elective cesarean section), and recommends against using ultrasonographic measurements of the lower uter-ine segment to counsel patients on the possibility of a TOLAC [19].
Shared decision-making
abnormal placentation secondary to the additional uter-ine surgeries [72]. Unexpected severe adverse maternal and neonatal outcomes (e.g., maternal mortality) are im-portant for patient-level counselling and decision-making.
Each woman should be given the opportunity to be counselled early in pregnancy on her available options, with provision of written or on-line patient information literature (e.g., VBAC clinical care pathway, decision aids) to help inform decision-making throughout her pregnancy for optimal delivery outcomes and patient satisfaction.
Conclusion
This systematic review evaluated clinical interventions for safe practice directed at increasing the rate of vaginal delivery among women with a prior CD but found low to very low certainty in the body of evidence for cervical ripening and/or labor induction techniques. There is in-sufficient high-quality evidence to inform on optimal clinical interventions/protocols for women considering to have a VBAC.
Supplementary information
Supplementary informationaccompanies this paper athttps://doi.org/10. 1186/s12884-019-2689-5.
Additional file 1: Appendix 1.Search strategy.Appendix 2.
Characteristics of included studies.Appendix 3.Methodological quality assessments of included studies.
Abbreviations
ACOG:American College of Obstetrics and Gynecology; CD: Cesarean delivery; CI: Confidence interval; GRADE: Grading of Recommendations Assessment, Development and Evaluation; MMAT: Mixed Methods Appraisal Tool; NRCT: Non-randomized clinical trial; OR: Odds ratio; OR: Odds ratio; PGE1: Prostaglandin E1; PGE2: Prostaglandin E2; RCT: Randomized clinical trial; RR: Risk ratio; SMFM: The Society for Maternal-Fetal Medicine; SOGC: The Society of Obstetricians and Gynaecologists of Canada; TOLAC: Trial of labor after cesarean; VBAC: Vaginal birth after cesarean
Acknowledgements
We would like to thank Tara Landry for peer reviewing the search strategy, Sholeh Rahman for screening records from the update search, and Liza Bialy for assisting with data verification.
Authors’contributions
All authors contributed to the conception and design of the project. RF conducted the literature searches. AW and CJ conducted screening, quality assessments, and data extraction and verification. AW conducted data analyses; BV provided statistical advice. AW drafted the manuscript. AW, LH, MS, CJ, RF, BV, and RDW contributed to interpretation of data and revised the manuscript for important intellectual content. All authors contributed to revisions of the manuscript and approved the final version for submission.
Funding
This study was funded by the Maternal, Newborn, Child and Youth Strategic Clinical Network (MNCY SCN) of Alberta Health Services (AHS) and the Alberta Strategy for Patient-Oriented Research (SPOR) SUPPORT Unit Know-ledge Translation Platform. The funders had no role in the design of the study, the collection, analysis or interpretation of data, the writing of the manuscript, or the decision to submit the article for publication.
Availability of data and materials
All data generated or analyzed during this study are included in this published article (and its supplementary information files).
Ethics approval and consent to participate
This is a systematic review of previously published data and as such does not require ethics approval.
Consent for publication
Not applicable.
Competing interests
LH is funded through a Canada Research Chair in Knowledge Synthesis and Translation; there are no other relationships or activities that could appear to have influenced the submitted work.
Author details
1Department of Pediatrics, Alberta Research Centre for Health Evidence,
University of Alberta, Edmonton, Alberta, Canada.2Alberta Strategy for Patient-Oriented Research (SPOR) SUPPORT Unit Knowledge Translation Platform, University of Alberta, Edmonton, Alberta, Canada.3Department of Obstetrics and Gynecology, Cumming School of Medicine, University of Calgary, 1403–29 Street NW, Calgary, AB T2N 2T9, Canada.
Received: 30 May 2019 Accepted: 19 December 2019
References
1. Canadian Institutes of Health Information. C-section rates continue to increase while birth rates decline. Accessed 28 May 2019.
2. Canadian Institutes of Health Information. Health indicators 2014: Caesarean section 2014.https://yourhealthsystem.cihi.ca/. Accessed 28 May 2019. 3. Boerma T, Ronsmans C, Melesse DY, Barros AJD, Barros FC, Juan L, et al.
Global epidemiology of use of and disparities in caesarean sections. Lancet. 2018;392(10155):1341–8.
4. Wingert A, Johnson C, Featherstone R, Sebastianski M, Hartling L, Douglas WR. Adjunct clinical interventions that influence vaginal birth after cesarean rates: systematic review. BMC Pregnancy Childbirth. 2018;18(1):452. 5. Betrán AP, Ye J, Moller A-B, Zhang J, Gülmezoglu AM, Torloni MR. The
increasing trend in caesarean section rates: global, regional and national estimates: 1990-2014. PLoS One. 2016;11(2):e0148343.
6. Brown HK, Hill J, Natale R. Caesarean section rates in southwestern Ontario: changes over time after adjusting for important medical and social characteristics. J Obst Gynaecol Can. 2014;36(7):578–89.
7. Cox K. Providers' perspectives on the vaginal birth after cesarean guidelines in Florida, United States: a qualitative study. BMC Pregnancy Childbirth. 2011;11(1):72.
8. Johnson J-A, Tough S. SOGC Genetics Committee. Delayed child-bearing. J Obstet Gynaecol Can. 2017;34(1):80–93.
9. Joseph KS, Young DC, Dodds L, O'Connell CM, Allen VM, Chandra S, et al. Changes in maternal characteristics and obstetric practice and recent increases in primary cesarean delivery. Obstet Gynecol. 2003;102(4):791–800. 10. Kawakita T, Reddy UM, Landy HJ, Iqbal SN, Huang CC, Grantz KL. Indications
for primary cesarean delivery relative to body mass index. Am J Obstet Gynecol. 2016;215(4):515 e1–9.
11. Degani N, Sikich N. Caesarean delivery rate review: an evidence-based analysis. Ontario Health Technology Assessment Series. 2015;15(9):1–58. 12. Born K, Konkin J, Tepper J, Okun N. Pulling back the curtain on Canada's
rising c-section rate. Healthy Debate. 2014.
13. Lydon-Rochelle M, Holt VL, Martin DP, Easterling TR. Association between method of delivery and maternal rehospitalization. JAMA. 2000;283(18): 2411–6.
14. Lydon-Rochelle MT, Cahill AG, Spong CY. Birth after previous cesarean delivery: short-term maternal outcomes. Semin Perinatol. 2010;34(4):249–57. 15. Martel M-J, MacKinnon CJ. No. 155: guidelines for vaginal birth after
previous caesarean birth. J Obstet Gynaecol Can. 2018;40(3):e195–207. 16. Sabol B, Denman MA, Guise JM. Vaginal birth after cesarean: an effective
method to reduce cesarean. Clin Obstet Gynecol. 2015;58(2):309–19. 17. Wilson RD, Caughey AB, Wood SL, Macones GA, Wrench IJ, Huang J, et al.
enhanced recovery after surgery society recommendations (part 1). Am J Obstet Gynecol. 2018;219(6):523 e1-e15.
18. American College of Obstetricians and Gynecologists. Practice bulletin no. 205: vaginal birth after cesarean delivery. Obstet Gynecol. 2019; 133(2):e110–27.
19. Dy J, DeMeester S, Lipworth H, Barrett J. No. 382-trial of labour after caesarean. J Obstet Gynaecol Can. 2019;41(7):992–1011.
20. Gupta JK, Smith GCS, Chodankar RR. RCOG Green-top guideline no. 45: Birth after previous caesarean birth. Royal College of Obstetricians and Gynaecologists. 2015.
21. Tanos V, Toney ZA. Uterine scar rupture - prediction, prevention, diagnosis, and management. Best Pract Res Clin Obstet Gynaecol. 2019;59:115–31. 22. Li Y-X, Bai Z, Long D-J, Wang H-B, Wu Y-F, Reilly KH, et al. Predicting the
success of vaginal birth after caesarean delivery: a retrospective cohort study in China. BMJ Open. 2019;9(5):e027807.
23. Macones GA, Hausman N, Edelstein R, Stamilio DM, Marder SJ. Predicting outcomes of trials of labor in women attempting vaginal birth after cesarean delivery: a comparison of multivariate methods with neural networks. Am J Obstet Gynecol. 2001;184(3):409–13.
24. Mardy AH, Ananth CV, Grobman WA, Gyamfi-Bannerman C. A prediction model of vaginal birth after cesarean in the preterm period. Am J Obstet Gynecol. 2016;215(4):513 e1-e7.
25. Moher D, Liberati A, Tetzlaff J, Altman DG. Preferred reporting items for systematic reviews and meta-analyses: the PRISMA statement. J Clin Epidemiol. 2009;62(10):1006–12.
26. Higgins J, Green S (editors). The Cochrane Handbook for Systematic Reviews of Interventions 5.1.0. [updated March 2011]. Cochrane Collaboration; 2011.www.cochrane-handbook.org. Accessed 28 May 2019. 27. Pace R, Pluye P, Bartlett G, Macaulay AC, Salsberg J, Jagosh J, et al.
Testing the reliability and efficiency of the pilot mixed methods appraisal tool (MMAT) for systematic mixed studies review. Int J Nurs Stud. 2012;49(1):47–53.
28. Review Manager (RevMan) [computer program]. Version 5.3. Copenhagen: The Nordic Cochrane Centre, The Cochrane Collaboration, 2014. 29. Guyatt GH, Oxman AD, Akl EA, Kunz R, Vist G, Brozek J, et al. GRADE
guidelines: 1. Introduction-grade evidence profiles and summary of findings tables. J Clin Epidemiol. 2011;64(4):383–94.
30. Aboulfalah A, Chraibi T, el Mouatacim K, Samouh N, Himmi A. Induction of labour with intravaginal misoprostol after prior cesarean delivery. Afr J Reprod Health. 2001;5(2):139–42.
31. Al-Shaikh G, Al-Mandeel H. The outcomes of trial of labour after cesarean section following induction of labour compared to spontaneous labour. Arch Gynecol Obstet. 2013;287(6):1099–103.
32. Blanco JD, Collins M, Willis D, Prien S. Prostaglandin E2 gel induction of patients with a prior low transverse cesarean section. Am J Perinatol. 1992; 9(2):80–3.
33. Cieminski A. Induction and augmentation of labor after prior cesarean delivery. Ginekologia i Poloznictwo. 2012;23(1):18–24.
34. Cunha M, Bulgalho A, Bique C, Bergstrom S. Induction of labor by vaginal misoprostol in patients with previous cesarean delivery. Acta Obstet Gynecol Scand. 1999;78(7):653–4.
35. Flamm BL, Anton D, Goings JR, Newman J. Prostaglandin E2 for cervical ripening: a multicenter study of patients with prior cesarean delivery. Am J Perinatol. 1997;14(3):157–60.
36. Flamm BL, Goings JR, Fuelberth NJ, Fischermann E, Jones C, Hersh E. Oxytocin during labor after previous cesarean section: results of a multicenter study. Obstet Gynecol. 1987;70(5):709–12.
37. Geetha P. Induction of labour with prostaglandin E2 vaginal gel in women with one previous caesarean section. Middle East Fertil Soc J. 2012;17(3): 170–5.
38. Goldman GA, Kaplan B, Rabinerson D, Biran G, Amster R, Ben-Rafael Z. Vaginal delivery following caesarean section-the use of oxytocin and prostaglandins. J Obstet Gynaecol. 1998;18(4):328–30.
39. Grobman WA, Gilbert S, Landon MB, Spong CY, Leveno KJ, Rouse DJ, et al. Outcomes of induction of labor after one prior cesarean. Obstet Gynecol. 2007;109(2 Pt 1):262–9.
40. Grubb DK, Kjos SL, Paul RH. Latent labor with an unknown uterine scar. Obstet Gynecol. 1996;88(3):351–5.
41. Horenstein JM, Phelan JP. Previous cesarean section: the risks and benefits of oxytocin usage in a trial of labor. Am J Obstet Gynecol. 1985;151(5):564–9.
42. Horenstein JM, Eglinton GS, Tahilramaney MP, Boucher M, Phelan JP. Oxytocin use during a trial of labor in patients with previous cesarean section. J Reprod Med. 1984;29(1):26–30.
43. Kehl S, Weiss C, Wamsler M, Beyer J, Dammer U, Heimrich J, et al. Double-balloon catheter and sequential vaginal prostaglandin E2 versus vaginal prostaglandin E2 alone for induction of labor after previous cesarean section. Arch Gynecol Obstet. 2016;293(4):757–65.
44. Lao TT, Leung BFH. Labor induction for planned vaginal delivery in patient with previous cesarean section. Acta Obstet Gynecol Scand. 1987;66(5):413–6.
45. Lelaidier C, Baton C, Benifla JL, Fernandez H, Bourget P, Frydman R. Mifepristone for labour induction after previous caesarean section. Br J Obstet Gynaecol. 1994;101(6):501–3.
46. Manish P, Rathore S, Benjamin SJ, Abraham A, Jeyaseelan V, Mathews JE. A randomised controlled trial comparing 30ml and 80ml in Foley catheter for induction of labour after previous caesarean section. Trop Dr. 2016;46(4): 205–11.
47. Ogbonmwan SE, Miller V, Ogbonmwan DE, Akinsola AA. Review of vaginal birth after primary caesarean section without prostaglandin induction and or syntocinon augmentation in labour. J Matern Fetal Neonatal Med. 2010; 23(4):281–5.
48. Palatnik A, Grobman WA. Induction of labor versus expectant management for women with a prior cesarean delivery. Am J Obstet Gynecol. 2015; 212(3):358 e1-e6.
49. Ramya V, Ghose S, Pallavee P. Membrane sweeping for vaginal birth after caesarean section and its outcome -a comparative study. J Clin Diagn Res. 2015;9(8):QC01–3.
50. Rayburn WF, Gittens LN, Lucas MJ, Gall SA, Martin ME, Prepidil Gel Study group. Weekly administration of prostaglandin E2 gel compared with expectant management in women with previous cesareans. Obstet Gynecol. 1999;94(2):250–4.
51. Sakala EP, Kaye S, Murray RD, Munson LJ. Oxytocin use after previous cesarean: why a higher rate of failed labor trial? Obstet Gynecol. 1990;75(3 Pt 1):356–9.
52. Sakala EP, Kaye S, Murray RD, Munson LJ. Epidural analgesia. Effect on the likelihood of a successful trial of labor after cesarean section. J Reprod Med. 1990;35(9):886–90.
53. Shah U, Bellows P, Drexler K, Hawley L, Davidson C, Sangi-Haghpeykar H, et al. Comparison of induction of labor methods for unfavorable cervices in trial of labor after cesarean delivery. J Matern Fetal Neonatal Med. 2017; 30(9):1010–5.
54. Shatz L, Novack L, Mazor M, Weisel RB, Dukler D, Rafaeli-Yehudai T, et al. Induction of labor after a prior cesarean delivery: lessons from a population-based study. J Perinat Med. 2013;41(2):171–9.
55. Sims EJ, Newman RB, Hulsey TC. Vaginal birth after cesarean: to induce or not to induce. Am J Obstet Gynecol. 2001;184(6):1122–4.
56. Taylor AVG, Sellers S, Ah-moye M, Mackenzie IZ. A prospective random allocation trial to compare vaginal prostaglandin E2 with intravenous oxytocin for labour induction in women previously delivered by caesarean section. J Obstet Gynaecol. 1993;13(5):333–6.
57. Tussupkaliyev A, Fayday A, Karimsakova B, Bermagambetova S, Uteniyazova L, Iztleuova G, et al. Induced vaginal birth after previous caesarean section. Australas Med J. 2016;9(11):412–21.
58. Yogev Y, Ben-Haroush A, Lahav E, Horowitz E, Hod M, Kaplan B. Induction of labor with prostaglandin E2 in women with previous cesarean section and unfavorable cervix. Eur J Obstet Gynecol Reprod Biol. 2004;116(2):173–6. 59. Penfield CA, Wing DA. Labor induction techniques: which is the best?
Obstet Gynecol Clin N Am. 2017;44(4):567–82.
60. Tenore JL. Methods for cervical ripening and induction of labor. Am Fam Physician. 2003;67(10):2123–8.
61. Catling-Paull C, Johnston R, Ryan C, Foureur MJ, Homer CSE. Clinical interventions that increase the uptake and success of vaginal birth after caesarean section: a systematic review. J Adv Nurs. 2011;67(8):1646–61. 62. West HM, Jozwiak M, Dodd JM. Methods of term labour induction for
women with a previous caesarean section. Cochrane Database Syst Rev. 2017;6:CD009792.
63. Ananth CV, Friedman AM, Keyes KM, Lavery JA, Hamilton A, Wright JD. Primary and repeat cesarean deliveries: a population-based study in the United States, 1979-2010. Epidemiology. 2017;28(4):567–74.
65. Lundgren I, Smith V, Nilsson C, Vehvilainen-Julkunen K, Nicoletti J, Devane D, et al. Clinician-centred interventions to increase vaginal birth after caesarean section (VBAC): a systematic review. BMC Pregnancy Childbirth. 2015;15(1):16.
66. Souter V, Painter I, Sitcov K, Caughey AB. Maternal and newborn outcomes with elective induction of labor at term. Am J Obstet Gynecol. 2019;220(3): 273 e1-e11.
67. Middleton P, Shepherd E, Crowther CA. Induction of labour for improving birth outcomes for women at or beyond term. Cochrane Database Syst Rev. 2018;5:CD004945.
68. Landon MB, Leindecker S, Spong CY, Hauth JC, Bloom S, Verner MW, et al. The MFMU cesarean registry: factors affecting the success of trial of labor after previous cesarean delivery. Am J Obstet Gynecol. 2005;193(3, Supplement):1016–23.
69. Weinstein D, Benshushan A, Tanos V, Zilberstein R, Rojansky N. Predictive score for vaginal birth after cesarean section. Am J Obstet Gynecol. 1996; 174(1, Part 1):192–8.
70. Wood S, Cooper S, Ross S. Does induction of labour increase the risk of caesarean section? A systematic review and meta-analysis of trials in women with intact membranes. BJOG. 2014;121(6):674–85. 71. Hill JB, Ammons A, Chauhan SP. Vaginal birth after cesarean delivery:
comparison of ACOG practice bulletin with other national guidelines. Clin Obstet Gynecol. 2012;55(4):969–77.
72. Tahseen S, Griffiths M. Vaginal birth after two caesarean sections (VBAC-2)—a systematic review with meta-analysis of success rate and adverse outcomes of VBAC-2 versus VBAC-1 and repeat (third) caesarean sections. BJOG. 2010;117(1):5–19.
Publisher’s Note