Multiple production up to
√
s
=
13
TeV with the generator
GHOST adapted to cosmic ray simulation
Jean-No¨el Capdevielle1,a, Zbigniew Plebaniak2, Barbara Szabelska2, and Jacek Szabelski2
1 APC Universit´e Paris Diderot, 10 rue A. Domon et V. Duquet, 75013 Paris and Acad´emie des Sciences d’Outre Mer, 15 rue La P´erouse, 75116 Paris, France
2 National Centre for Nuclear Research, Astrophysics Division, Cosmic Ray Laboratory, ul. 28 Pułku Strzelc´ow Kaniowskich 69, 90-558 Ł´od´z, Poland
Abstract. The model HDPM of CORSIKA has been updated and developed on the base of the recent measurements by LHCb, CMS, TOTEM... The new model GHOST involving a 4-source production reproduces correctly the pseudorapidity distributions of charged secondaries and has been testified with the data in the mid and forward rapidity region, especially in the complex case of TOTEM and also with the recent measurements of CMS up to√s=13 TeV (9.2·1016eV).
Special calculations have been devoted to the semi-inclusive data playing an important role in the cosmic ray simulation (fluctuations in the earliest collisions, individual cascades and remarkable events). Taking into account the violation of KNO scaling, the negative binomial distribution has been used pointing out an asymptotic behaviour of total charged multiplicities at primary energies exceeding 40 TeV (7·1017eV). The interpretation of the most recent measurements suggests for EAS generated by primary protons a larger production of muons and a cascade maximum at higher altitude than previously assumed.
1. Introduction
In the sections that follow, we shall discuss the new improvements in cosmic ray simulation suggested by the most recent results of the LHC, especially the data of
ATLAS, CMS, TOTEM, LHCb... up to√s=13 TeV used
as the largest energy now available to elaborate and testify the new Monte Carlo generator suitable for cosmic ray simulations.
Section 2 is devoted to the consequences of the violation of KNO scaling on the semi-inclusive data after considering the limits of the earliest scaling behaviour only valid now in small energy bands.
Section 3 is focused on the basic features of very high energy hadron interactions and guidelines useful for extrapolations of EAS simulations up to primay energies
of 1020 eV. The 4-component model GHOST (Generator
Hadronic Oversteering Secondary Treatment) reproduces general characteristics of p-p collisions up to √s=
13 TeV.
Section 4 evocates some measurements not explained in cosmic ray data above √s=1 TeV, especially in high energy spectra of secondaries measured in EAS, spikes and coplanar emission in Gamma-ray families.
Observing that Extensive Air Showers (EAS) are random individual events, we emphasize here the interest of the semi inclusive data delivered by the LHC at ultra high energy.
ae-mail:[email protected]
2. Consequences of the violation of
KNO scaling and semi inclusive data
Each new step in energy reached by the colliders is an opportunity to evaluate the predictions of the interaction models. The simulation of the hadronic cascade in cosmic ray physics needs at least the parameters describing the different cross sections, the total multiplicity of secon-daries, their energy and transverse momenta distributions, the energy dependence of those parameters and the statistic laws governing their fluctuations. The violation of Koba, Nielsen, Olesen (KNO) scaling observed in UA5 [1], for instance, introduced the negative binomial distribution well adapted to the prediction of multiplicities of secondaries in cosmic ray cascades.
2.1. KNO scaling in central region
Several attempts have been performed to introduce other scaling based on the Feynmann’s scaling [2] describing the rapidity distribution as a central plateau with gaussian wings; the link with the pseudorapidity distribution was treating the central dip with dynamical considerations, whereas the extension from ISR energies up to SPS ener-gies introduced both a rising plateau and a width increase derived from UA5 data on pseudorapidity distributions. The KNO scaling (concerning all the distribution) was rejected in 1983 following the contradiction between ISR and UA5 data; taking into account the wider distributions of multiplicity than KNO predicted also by the Dual Parton Model (DPM) [3] and the “fireball model” [1]. It was decided to explore the multiplicity distributions in limited pseudorapidity intervals.
ch
n
0 50 100 150 200
ch
dn
ev
dN
ev
N
1
6
−
10
5
−
10
4
−
10
3
−
10
2
−
10
1
−
10 1
<|3| c η UA5, 0.546 TeV,
<|1.5| c η UA5, 0.546 TeV,
<|2.5| c η Atlas, 7 TeV,
<|1| c η Alice, 7 TeV,
<|2.5| c η Atlas, GHOST,
<|1| c η Alice, GHOST,
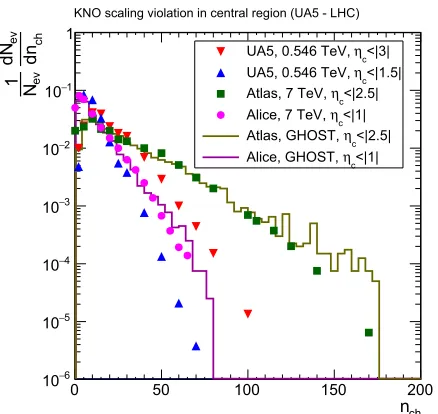
KNO scaling violation in central region (UA5 - LHC)
Figure 1. Charged multiplicities in central regions. Comparison between ATLAS, ALICE at√s=7 TeV, respectively forη≤ 2.5 (squares),η≤1.0 (circles) and UA5 data, η≤3 (triangle down),η≤1.5 (triangle up). The histograms are the respective MC simulation results with GHOST for ATLAS and ALICE.
A tolerable scaling agreement was obtained in central region for η≤1.3 or η≤1.5 in the case of ISR, UA5 and UA1 for instance. However, several uncertainties remain. We have simulated with GHOST such situation for
comparison between LHC data (√s=7 TeV) and UA5
(√s=540 GeV). Important discrepancies (Figure 1) of the distributions are distinguished between ATLAS and UA5 for η≤2.5 and η≤3. as well as in the case of ALICE and UA5 respectively forη≤1.andη≤1.5 [4] [5]. Since LHC measurements of the average multiplicities
¯
nch are not yet very accurate, a strict comparison versus the KNO variable z=nch/n¯chcannot be shown, but there remains poor chance for this scaling in central region. Our histograms calculated with GHOST confirm the large discrepancies with UA5 data when the energy is rising up to√s=7 TeV.
Similarly, the attempts made in the fragmentation region of the inclusive pseudorapidity distributions plotted in the beam frame were not conclusive; the measurements were obtained for ISR up to η−ybeam=−0.75 for 53 GeV in ISR, but only up to η−ybeam=−2.4 for 900 GeV in UA5 [6]. The genuine fragmention region cannot be reached because the range of forward directions at|xf| ≥0.05 is experimentally unavialable.
2.2. Empirical scaling and semi-inclusive data
Fortunately an “empirical scaling” was pointed out in the central region by UA5 as a relation between the normalized central density and the normalized multiplicity [6]. The ratioρ(0)/ρ¯(0)= f (z) (instead of f (z,s) is here
independent of √s), ρ(0) being the central density for a given charged multiplicity n, ρ¯(0) being the average central density (for a more simple legibility n, nch, N and Nchare used interchangeable). The KNO variable z=n/¯n is the normalized multiplicity. The general dependence on z is shown in the Fig. 2. Following our adjustment, we
z = n / <n>
0 1 2 3 4
(0)
ρ
(0) /
ρ
0 1 2 3 4 5
Figure 2. Empirical scaling functionζ = f(z) for√(s) = 200, 546 and 900 GeV for NSD collisions. In this figure ¯ρ(0) is noted asρ(0) whereasρ(0) in text is specified asρ(0)n.
propose for f (z) the numerical representation:
ζ = f (z)=0.11499 z2+1.0231 z−0.1319 (1)
This kind of scaling is not yet confirmed in LHC data as the semi-inclusive measurements are performed only in small windows of pseudorapidity, but it remains present in models extrapolations at larger energies.
Following UA5 and our considerations in CORSIKA user’s guide [7], the fluctuations of <Nch >for a fixed primary energy can be reproduced at very high energy by a more simple relation corresponding to the negative binomial distribution (NBD) at very high energy; this simple function [8] represents in terms of KNO reduced variablesz= n¯n the fluctuations as:
(z,k)= ¯n Pn = kk
(k)z
k−1e−kz
(2)
k−1=a +b ln√s (3)
(a=−0.104,b=0.058) (4)
The values of the parameters correspond here to ¯n= <Nch> for the charged NSD component, Pn being the probability of an incoming multiplicity Nch. The evolution of those fluctuations of Nch is plotted in the Fig. 3 at ISR and UA5 energies, completed by the curve and the histogram illustrating the calculation with
GHOST at √s=8 TeV. The asymptotic form at very
high energy (40 TeV) in the unfulfilled project of the Superconducting Super Collider (SSC 1986) is the most enlarged variation with the simple expression (z)= 4z e−2z. The probability in p-p collision to receive randomly very small Nch or very large Nch increases at very high energy as shown in the Fig.3.
Such contrast changes the statistical treatment of the earliest interactions in hadronic cascades at UHE and we underline the neighbourhood of the histogram at √s=
8 TeV with the asymptotic expression of the SSC. Thanks to the functionζ the semi-inclusive data can be governed by the integro-differential system:
d N d yy=0
=mr d N
dηη=0= mr ζ ρ¯(0) (5)
d N
|z|
0 1 2 3 4
(z)
Ψ
5
− 10
4
− 10
3
− 10
2
− 10
1
− 10
1
63 GeV ISR 900 GeV 8 TeV 8 TeV - simulation 40 TeV - asymptotic
Violation of KNO scaling
Figure 3. Fluctuations of total charged NSD multiplicity. The full line represents the asymptotic behaviour at√s=40 TeV, the histogram and the dashed line correspond both to the calculation of GHOST and the function(z,k) at√s=8 TeV, whereas the dotted and dashed curves correspond respectively to
√
s=900 GeV and√s=53 GeV.
mr is the ratio of central mean rapidity density and mean central pseudorapidity density derived from the “dip” existing in the centre of the pseudorapidity distribution, resulting from the mass m and the transverse mass mT of the secondaries as mr =
1−m2/m2
T. In the case of the 4 gaussian generation (one pair of functions in each hemisphere), symmetrics around the center of mass,
d N d y =
i=2
i=1
ai(e−0.5ui +e−0.5vi) (7)
ui =
(y−yi)
σi 2
, vi =
(y+yi)
σi 2
(8)
it is possible to use the opportunity of the scaling of function ζ in the relation between the center yi and the widthσiof each gaussian function as
yi =σi
2ln
z<n> √
(2π)ζ σi 0.5
After introducing one proportion χ of the multiplicity distributed to the pair of gaussian centered in central region and in mid-rapidity region, it is possible to obtain with a minimal Monte Carlo generation of random deviates the total original rapidity distribution source of the distribution of pseudorapidity shown in the Fig. 4 for various range of multiplicity (respectivelyχ=20% and 80% or for the total NSD multiplicity in the Fig.7). The couples rapidity-transverse momentum (y,pt) are generated using the same pt distribution as in CORSIKA [7]. The total average inelasticity of the NSD collisions calculated with GHOST is 0.71 indicating a larger proportion of the primary energy distributed to the secondaries. The generator GHOST has been used here to appreciate the elements provided by semi-inclusive measurements which will be distributed soon by the LHC.
The NSD behaviour is shown here in the Fig. 4,
corresponding to the histogram of the Fig. 3 for
√
s = 8 TeV.
|
η
|
0 2 4 6 8 10 12
η
dn / d
0 2 4 6 8 10 12 14 16
= 2.0 KNO Z
= 1.5 KNO Z
= 1.0 KNO Z
= 0.5 KNO Z
Figure 4. Semi-inclusive NSD pseudorapidity distribution, z = 0.5, 1., 1.5, 2. correspond respectively to relative intervals of Nch[0.25−0.75],[0.75−1.25],[1.25−1.75],[1.75−2.25].
3. Basic features of VHE interactions
3.1. Theoretical models and phenomenological collision generators
High energy cosmic ray interactions are mainly understood with the “soft physics” data provided by the colliders. Therefore, the approach of microscopic models starts from the parton distribution functions, distinguished for valence quarks and diquarks, sea quarks and gluons. In the case of p-p collisions, there are common features between models used in accelerators or in cosmic rays simulations, respectively models such as Dual Parton Model, Phojet, Pythia on one side, models like QGSJet, Sybill on the other side [9].
The geometrical and statistical models such as the cluster model GENCL of UA5 [10] are more connected with the phenomenological features of the experimental data and built on analogy with quantum optics. Similarly, the Hybrid Dual Parton Model (HDPM) was inspired by the most simple double pomeron structure of DPM. It represents the pair of quark-diquark chains stretched between the valence quark and diquark of the projectile and the target by one pair of gaussian functions with a correct overlap to reproduce the expected rapidity distribution with the profile of one plateau with gaussian-shaped wings [11–13].
Unfortunately, in the interpretation of cosmic ray data, the approach has a limit due to the difficulties of measurement in the very forward region of rapidity and the determination of the properties of the leading cluster. In other words, the role of the pilot particle fundamental in hadronic cosmic ray cascades remains dependent on adequate assumptions.
All the models have been extended to p-A and A-A collisions in order to describe the collision of cosmic ray hadrons with air constituents and how the comparison with the LHC data becomes also possible.
3.2. Guidelines and extrapolations at ultra high energy
(GeV) s 2
10 103 104
o
Y
HW
σ
2 4 6 8
10 CMS-TOTEM
0 Y QGS
0 Available Rapidity Y
HW
σ
FWHM RDM
Pseudorapidity width and available rapidity
Figure 5. Energy dependence of the available rapidity Yo and of the FWHM,σH W, respectively, open squares, solid line and
dashed line from GHOST, dark squares from CMS-TOTEM, triangles from QGSJET01 model, horizontal line from the relativistic diffusion model RDM [14].
produced by colliders and accelerators is the charged Non Single Diffraction (NSD) distribution. The characteristics of this distribution: average central rapidity densityρ(0), total average multiplicity of charged secondaries nch (as far as it can be approached by the integration of the densities collected till the smallest angles of emission), the maximum and the full width at half maximum (FWHM), transverse momentum distribution, are the normal tests of the preliminary validity of the models recognized.
A next step of quality is reached with additive criteria adapted to the same pseudorapidity distribution data considered in small bands of multiplicity i.e. in a semi-inclusive analysis as it was shown in the Fig.4.
3.3. Energy dependence of total charged multiplicity and central pseudorapidity densities at LHC
Up to now the average central pseudorapidity density has been measured up to√s=13 TeV (only for the inelastic component as measured recently by CMS), the other components being limited at√s=8 TeV. For instance the widening of the full pseudorapidity distribution at half maximum (FWHM) can be used as an estimator up to
√
s=8 TeV thanks to TOTEM data giving a part of the pseudorapidity densities near the forward region, but this is not yet the case at√s=13 TeV as shown in the Fig.5.
We can observe also in the Fig. 5 the different
behaviour of the full width at half maximum (FWHM), σH W, on the one hand, and the rise of the available rapidity (or rapidity Y0 of the center of mass in the laboratory
system) on the other hand. Both dependencies on s reflect a logarithmic increase
σH W =0.3182 ln(s)+0.5 (9)
Y0 =0.502 ln(s)+0.3 (10)
We begin however to have new elements in the interval √s=[1.−13.] TeV useful for a lever arms of two guidelines in cosmic ray simulation, the average multiplicity dependence and average central pseudorapidity dependence to describe in better condition
the cosmic ray data up to about 1017 eV. New
extrapolations risked up to 1020eV could be evaluated.
(GeV) s
2
10 103 104
= 0)
η
(
ρ
0 1 2 3 4 5 6 7
Central pseudorapidity density
(GeV) s
2
10 103 104
ch, NSD
N
20 40 60 80 100
Total charged NSD multiplicity
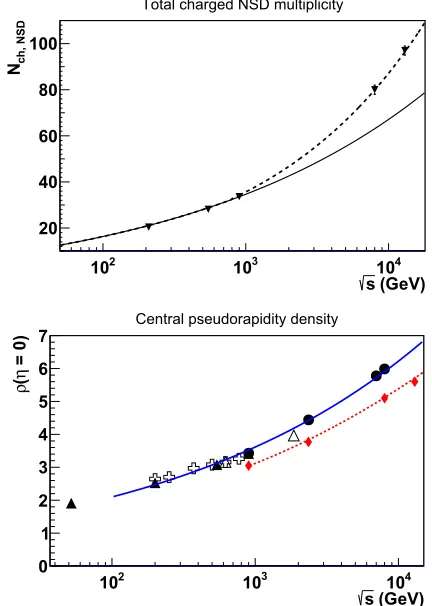
Figure 6. Figure 6a (upper) Total charged multiplicity (NSD) dependence on s for E0=1013−1017eV following UA5 (solid line) and the asymptotic tendency using GHOST (dashed line). 3 lower points are from UA5, the upper point at 13 TeV is estimated with GHOST. Figure 6b (bottom) Central pseudorapidity density dependence on s for E0=1013−1017 eV (solid line for NSD component with one point from GHOST at√s=13 TeV, dashed line with diamonds devoted to the inelastic component is aproximately 0.8695·ρ¯(0) NSD).
The energy dependence in the Fig. 6 of the total
mean charged multiplicity (NSD component) is shown hereafter adding to the S p ¯pS collider measurements
[1] the data of CMS and TOTEM at √s=8 TeV. An
important enhancement is thus appearing when we take into account the multiplicity estimated using GHOST after integration of the density of both rapidity and pseudorapidity in the best agreement with the
pseudorapidity measured at √s=8 TeV by CMS and
TOTEM [15]. We note a large discrepancy of the
asymptotic behaviour (solid line) with the previous tendency (dashed line) expected from UA5 data [1]. The first estimation of the total average multiplicity <Nch−U A5> by a power law has to be updated as we suggest above√s=1 TeV introducing another power law for<Nch>as follows:
<Nch−U A5>=−7.0+7.2 s0.127 (11)
<Nch >=−0.74+2.59 s0.191 (12)
| η |
0 2 4 6 8 10 12
η
dN/d
0 1 2 3 4 5 6
7 CMS 8 TeV NSD Data
TOTEM 8TeV NSD Data GHOST 8 TeV simulation Pseudorapidity Distribution, NSD, 8 TeV with GHOST
Figure 7. Average pseudorapidity density simulated with GHOST at √s=8 TeV compared with CMS and TOTEM measurements taking into account respective limits of Pt.
the logarithmic dependence ¯ρ1(0) of UA5 replaced by ¯ρ(0)
as follows is shown in the Fig.6b
¯
ρ(0)=3.17−0.372ln(s)+0.0291ln(s2) (13) ¯
ρ1(0)=0.24 ln(s)+0.1 (14)
The dependence on energy evaluated in LHC up to
√
s=13 TeV exhibits multiplicity enhancement in central rapidity region as well as in mid-rapidity region and a total charged mean multiplicity close to 100 particles can be expected at√s=15 TeV.
3.4. Average rapidity and pseudorapidity distributions up to√s= 13 TeV
At present the charged density measurements at √s=
8 TeV cover central and mid-rapidity region limited to 7 units of pseudorapidity. A comparison of a profile generated with the double gaussian generator GHOST
is shown in the Fig. 7 and compared with the NSD
measurements of CMS and TOTEM [15].
This result takes into account for both rapidity and pseudorapidity the generation of individual collisions containing for instance the semi-inclusive data shown in the Fig. 4. The simple integration of the simulated distribution in agreement with the data on average densities of pseudorapidity<Nch > =
d N
ch
dη dηgives for √
s=
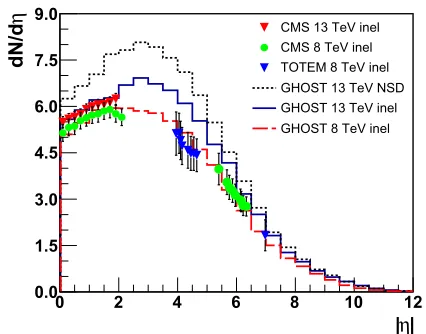
8 TeV an average total multiplicity<Nch> = 80 ±2. The results obtained by GHOST are also compared with the recent data concerning the inelastic pseudora-pidity respectively at√s=8 TeV and√s=13 TeV [16]
as shown in the Fig. 8. There are not measurements
published up to now concerning the NSD component
at √s=13 TeV. An attempt with GHOST generator
(dotted histogram) suggests one possible pseudorapidity distribution among several tendencies; it is only one example taking account the enhancement of total multiplicity suggested by the Fig. 6, a measurement of central NSD pseudorapidity being necessary.
4. Cosmic ray data related with
the LHC energy domain
A large part of cosmic ray remarkable events such as coplanar emission [17] or spikes [9] have been observed
| η |
0 2 4 6 8 10 12
η
dN/d
0.0 1.5 3.0 4.5 6.0 7.5 9.0
CMS 13 TeV inel CMS 8 TeV inel TOTEM 8 TeV inel GHOST 13 TeV NSD GHOST 13 TeV inel GHOST 8 TeV inel
Figure 8. Average pseudorapidity density simulated with GHOST compared with CMS measurements for the inelastic data of CMS at√s=8 TeV (lower histogram) and at√s=13 TeV (middle histogram). The upper histogram (dotted) concerns the NSD data and is just a preliminary attempt.
in different conditions (mountain altitude or stratosphere). They appear mainly between 1 PeV and 100 PeV in laboratory frame being covered now by the LHC data up to√s=13 TeV. Very small emulsion X-ray chambers of 40×50 cm have collected data in the stratosphere with balloons (i.e. JACEE, siberian flights above 30 km altitude), Concorde supersonic flights at 17 km altitude and even with japanese air liners near 10 km altitude). In parallel Emulsion-X-ray chambers or and X-ray chambers were also installed above 4 km altitude in Pamir, Tibet with very large area in order to collect events at energies exceeding 1017eV.
As expected more A-A collisions were collected with balloons, when more p-A collsions were collected during airplane flights with a statistics exhausted above 5·1016eV interesting with “spikes” in pseudorapidity
distribution. This data contains events with local multi-plicity fluctuations which were also observed at lower energy in UA5 data suggesting the examination of different hypothesis such as formation of quark-gluon plasma, but the Monte Carlo simulations of the CERN suggest also that the fluctuations occurred with a frequency similar to the data sample. New comparison of those statistics in LHC and in altitude flights appears necessary.
Similarly near and above√s=5 TeV, the unexpected alignment of secondaries has been observed in 2 independent stratospheric flights, in parallel with the collection of Pamir registrations. Additional simulations are now necessary to understand the coplanar emission in a new context; for instance diquark breaking of valence diquark could generate very large transverse momenta from the extreme string tension between quarks contained in each diquark. There could be also other investigations in relation with the ridges seen in p-p and p-A collisions at the LHC.
5. Conclusion
above the “knee” at 3−5 1015eV. The enhancement
of multiplicity suggests in EAS simulation a larger abundance of muons and a maximum of development at higher altitude than with previous models. Altogether an abundance of heavy primaries lower than with previous models can be expected above the knee. Furthermore, the energy guide lines derived from the complete data of the LHC shall provide new elememts in the polemics on GZK cut-off.
The data collected at √s=7−8 TeV is confirmed and will be completed soon for the NSD, inelastic components at√s=13 TeV and hopefully for cosmic ray data in the leading cluster with LHCf. This could help the interpretation of cosmic ray anomalies in the “knee” region above 2 TeV. The high energy photons in EAS in Tian Shan and the gamma ray families above 5 TeV (near 10 PeV in laboratory frame) exhibit steeper integral energy spectra than at lower energies. Such signal could be in relation with an important part of energy lost in the leading cluster.
This work was performed thanks to the French-Polish Collaboration Agreement IN2P3-COPIN. Part of Z. Plebaniak work was supported by NCN grant UMO-2016/20/T/ST9/00589.
References
[1] G. Alner, K. Alpgard, P. Anderer, R. Ansorge, B. Asman, S. Berglund, K. Berkelman, D. Bertrand, C. Booth, C. Buffam et al., Physics Reports 154, 247 (1987)
[2] R.P. Feynman, Phys. Rev. Lett. 23, 1415 (1969) [3] A. Capella, U. Sukhatme, C.I. Tan, J.T.T. Van,
Physics Reports 236, 225 (1994)
[4] G. Aad et al. (ATLAS), New J. Phys. 13, 053033
(2011),1012.5104
[5] K. Aamodt et al. (ALICE), Eur. Phys. J. C68, 89
(2010),1004.3034
[6] G.J. Alner, R.E. Ansorge, B. ˚Asman, C.N. Booth, L. Burow, P. Carlson, R.S. DeWolf, A. Drees, B. Eckart, G. Ekspong et al., Zeitschrift f¨ur Physik C Particles and Fields 33, 1 (1986)
[7] D. Heck, J. Knapp, J.N. Capdevielle, G. Schatz, T. Thouw, CORSIKA: a Monte Carlo code to
simulate extensive air showers (1998)
[8] P. Carruthers, C. Shih, Physics Letters B 127, 242 (1983)
[9] J.N. Capdevielle, Il Nuovo Cimento C 19, 623 (1996)
[10] G. Alner, K. Alpg˚ard, R. Ansorge, B. ˚Asman,
C. Booth, L. Burow, P. Carlson, R. DeWolf, B. Eckart, G. Ekspong et al., Nuclear Physics B 291, 445 (1987)
[11] J.N. Capdevielle, F. Cohen, B. Szabelska,
J. Szabelski, Journal of Physics G: Nuclear and Particle Physics 36, 075203 (2009)
[12] J.N. Capdevielle, Journal of Physics G: Nuclear Physics 14, 503 (1988)
[13] J.N. Capdevielle, Journal of Physics G: Nuclear and Particle Physics 15, 909 (1989)
[14] G. Wolschin, Physics Letters B 698, 411 (2011) [15] S. Chatrchyan et al. (CMS, TOTEM), Eur. Phys. J.
C74, 3053 (2014),1405.0722
[16] V. Khachatryan, A. Sirunyan, A. Tumasyan,
W. Adam, E. Asilar, T. Bergauer, J. Brandstetter, E. Brondolin, M. Dragicevic, J. Er et al., Physics Letters B 751, 143 (2015)
![Figure 4. Semi-inclusive NSD pseudorapidity distribution,z = 0.5, 1., 1.5, 2. correspond respectively to relative intervalsof Nch [0.25−0.75], [0.75−1.25], [1.25−1.75], [1.75−2.25].](https://thumb-us.123doks.com/thumbv2/123dok_us/8139908.1356816/3.595.315.531.74.206/figure-inclusive-pseudorapidity-distribution-correspond-respectively-relative-intervalsof.webp)