Oil shale, shale oil, shale gas and non-conventional
hydrocarbons
A. Clerici(∗)
WEC World Resources and CESI - Milano, Italy
G. Alimonti(∗∗)
INFN and Universit`a degli Studi - Milano, Italy
Summary.— In recent years there has been a world “revolution” in the field of unconventional hydrocarbon reserves, which goes by the name of “shale gas”, gas contained inside clay sediments micropores. Shale gas finds particular development in the United States, which are now independent of imports and see a price reduction to less than one third of that in Europe. With the high oil prices, in addition to the non-conventional gas also “oil shales” (fine-grained sedimentary rocks that contain a large amount of organic material to be used both to be directly burned or to extract liquid fuels which go under the name of shale oil), extra heavy oils and bitumen are becoming an industrial reality. Both unconventional gas and oil reserves far exceed in the world the conventional oil and gas reserves, subverting the theory of fossil fuels scarcity. Values and location of these new fossil reserves in different countries and their production by comparison with conventional resources are presented. In view of the clear advantages of unconventional fossil resources, the potential environmental risks associated with their extraction and processing are also highlighted.
(∗) Chair of the WEC Study Group on “Global Energy Resources and Technologies” and Senior Advisor CESI.
(∗∗) Member of the EPS Energy Group.
/ / 98
7KLVLVDQ2SHQ$FFHVVDUWLFOHGLVWULEXWHGXQGHUWKHWHUPVRIWKH&UHDWLYH&RPPRQV$WWULEXWLRQ/LFHQVHZKLFKSHUPLWV C
2. – Few definitions for non-conventional hydrocarbons
We define “oil shales” those fine-grained sedimentary rocks that contain a large amount of organic material (kerosen); they can be used to be directly burned as fuel (e.g.Estonia still produces almost all of its electricity from oil shale burned in special boilers) or to extract liquid fuels (oil shale) or partly gaseous. In the oil shale the ratio of organic matter (OM) and mineral material (MM) can vary from 7.1 to 3.1; the organic material decomposes at about 500◦C in shale oil and gas.
The coal differs from oil shale by having a lower hydrogen/carbon ratio but a OM/MM ratio almost equal to 1.
The use of the oil shale can be traced back to 1600 and since 1950 about 20 million to 45 million tons per year have been extracted (see fig. 1) for the most part in Estonia and much smaller quantities in Russia, China and Brazil. Scotland had been the largest and practically single producer until 1935.
Since the shale oil content is about 100 l/ton of oil shale, its low use to derive oil was mainly due to the lower cost of conventional oil.
Extra heavy oils and the bitumen are contained in deposits of oil that have been degraded over time for microbiological action and have reached a density greater than that of the conventional petroleum (1:02 to 1:04 compared to 0.83) and a remarkable viscosity (1000 times higher than that of oil for extra-heavy oils and 30000 times higher for the bitumen). They contain a greater proportion of metals such as nickel and vanadium, sulfur and nitrogen compared to oil.
The extra-heavy oils are found in deposits ranging from hundreds of meters depth (China, Poland, Indonesia) to 1500 meters (Venezuela, Russia, UK, Israel) or up to 3000 meters in Peru.
The bitumen is contained in rocks commonly called “tar sands” or “oil sands” and has been used since antiquity for flooring; the depth of the deposits varies from a few meters (China and Madagascar) to 350 meters (Canada).
Fig. 1. – Oil shale world production. Source: Pierre Allix, Alan K. Burnhanet al.
heat, solvents and different processes are used to increase the hydrogen/carbon ratio (“carbon rejection” or “hydrogen addition”) depending both on the type of available “raw material” and on the finished products to be obtained.
Shale gas is natural gas contained free in clay sediments micropores (fig. 2) or “at-tacked” to their surface; deposits are located between 2000 and 5000 meters deep, and its extraction is carried out with vertical and then horizontal drilling (fig. 3) using high-pressure water (“hydraulic fracturing”) with chemical additives to promote leakage of the gas and “channel it” to the surface.
Only about 25% of the introduced water returns to the surface where, to be recycled, it requires a special treatment.
Fig. 3. – Technology for shale gas extraction.
Another technology under study provides the “gas fracturing” with liquefied propane with water savings and reduced danger of contamination.
The recovery of the gas contained in a reservoir is currently around 30% with the need to drill a large number of wells to obtain an economically viable production.
3. – The reserves of unconventional hydrocarbons
World reserves of oil shale are estimated to be around 660 billion TOE (tons of oil equivalent) content of shale oil and 30% of these are technically extractable; they are therefore superior to the 175 billion TOE of proven reserves of conventional oil.
About 2/3 of the reserves are in the United States, followed by Russia and Brazil, which together have a share of 20%.
The shale oil production from oil shale is now about 1 million tons per year, compared to about 4 billion tons of conventional oil.
The proven reserves ofbitumen are measured with a content of extractable oil of 35 billion TOE, 70% of those are in Canada, followed by Kazakhstan and Russia. The estimated 598 deposits in 23 countries, potentially contain more than 300 billion TOE of oil. The current world production from tar sands/bitumen comes almost solely from Canada and it is about 65 million TOE per year, which corresponds to 45% of the total oil production from Canada.
Fig. 4. – World “risked” recoverable shale gas estimates 2011.
Theshale gas“risked” global resources are approximately 200 trillion m3divided into 48 basins in 32 countries, without counting the Central Africa countries as well as Russia and the Middle East that possess large reserves of natural gas.
Although estimates vary frequently according to new findings, a breakdown by con-tinents would be (see fig. 4):
North America ∼29%,
Asia ∼22%,
South America ∼19%,
North Africa and South Africa ∼15%, Europe (no Russia) ∼9%,
Australia ∼6%.
China is the first country with 18% of the probable reserves followed by United States, Argentina and Mexico.
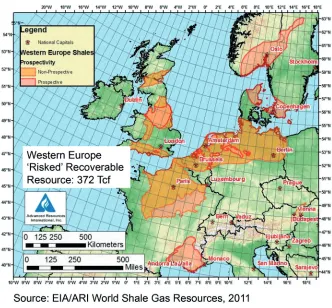
With regard to Europe, Poland is the country with the highest “recovery risked re-sources” equal to 5 trillion m3 closely followed by France, Norway, Ukraine, Sweden, Denmark, UK, Germany and the Netherlands, as shown in figs. 5 and 6.
Shale gas world reserves are estimated to be more than 2.5 times the natural gas reserves, bringing the ratio between reserves and current gas consumption to well over 200 years.
Fig. 5. – Western Europe “risked” recoverable shale gas estimates 2011.
4. – Shale gas: opportunities, risks, and geopolitical aspects
The potentially great shale gas resources mentioned above with the recent years rapid development in the United States, have marked and are strongly influencing the current and future energy scenario.
It is worth mentioning that in the United States (basically today the only large shale gas producers in the world) the production has gone from of 59 billion m3in 2008 to over 175 billion m3 in 2012, with a 25% coverage from shale gas on the total consumption (with more than 30000 wells in operation) and with a projected 46% percentage by 2030. Such a gas supply in the market has brought the natural gas price at about 3 $/MBTU, less than one third of the gas price in Europe and less than one fifth of the price in Japan.
Fig. 6. – Poland “risked” recoverable shale gas estimates 2011.
The reduction of coal consumption in the United States has led to a strong US coal export in the global market, influencing its prices.
In the WEC Energy Leaders Forum in February 2013 in New Delhi, it has been pointed out that the local gas consumption at a low price in the United States is addressed to the substitution of coal for electricity production. The gas has seen its share in the electricity production rising from 16% in 2000 to 32% in 2012 and it was expected at about 33% in 2013 but in reality went down to 28% against a coal share decline from 52% in 2000 to 36% in 2012 but up to 39% in 2013. The possible exporting volumes are not predictable but not such to contribute to a substantial alignment of the world gas prices, considering the costs associated with liquefaction-gasification-shipping. In any case, the United States plan to export not only LNG, but products derived from gas. In 2010 over 800000 jobs were estimated directly and indirectly associated with the development of shale gas which, however, is placing several problems at the political, industrial, economic and environmental level.
price, would create major economic problems to the “ally/enemy” Russia, the main gas supplier to Europe; this would lead Europe to ease its energy bills and bring it back more tied to the United States.
In any case, the energy flows that saw large LNG transfers to the United States stopped and they are foreseen, as mentioned above, to be reversed in the coming years. On the other end, coal that loses its share in the United States, is having an increased outflow.
In any case, the shale gas revolution is bringing substantial benefits to the United States:
– increase in industrial activity and employment;
– improving the balance of payments;
– low costs especially for electricity and resulting increase in competitiveness com-pared to an European Union that is going towards an higher energy cost for end users, also caused by heavy taxes and renewable energy commitments for CO2;
– reduction of environmental impact; the electricity production by gas combined cycles emits 40% of the CO2emitted by coal electricity production and the possible use of gas for transportation would reduce traction emissions compared to gasolin cars.
Despite all of the above, there are potential risks basically related to environmental issues that are here below summarized.
It should be reminded that the shale gas extraction has significant environmental impacts repeatedly stressed by environmental movements. In particular:
– possible micro-earthquakes as a result of fractures in underground layers;
– leakage into the atmosphere of methane gas, which has by far a larger greenhouse effect than CO2;
– large water volumes injected that return to the surface for only 25% with problems coming from particular treatments needed before being re-injected;
– great and “mobile” land surface occupation.
Companies involved in shale gas extraction reply to these objections that:
– the solvents are only 0.5% of the injected water volume and they are not harmful to the aquifers that are located thousands of meters above the shale gas deposits;
– the used hydraulic fracturing cannot cause seismic movements;
– the gas leakage in the atmosphere and in the soil is practically nothing, thanks to the sophisticated used technologies that are in constant evolution;
– the occupation of the surface land is made in full agreement with peoples and institutions.
In any case, a greater transparency of methods and used substances seems essential to arrive at a shared acceptability.
It should be emphasized that just an emotional reaction of the populations acknowl-edged at the political level with restrictive laws, could block the deposits exploitation, as already happened in some countries, or greatly affect the cost of shale gas, then re-sizing the anticipated developments. It is worth mentioning that France and Bulgaria have banned the “hydraulic fracturing” and also Quebec in Canada is imposing severe restrictions.
5. – Concluding remarks on fossil fuels
The proven reserves of conventional fossil fuels (R) compared to the current annual production (P) have aR/P ratio equal to
– 120 years for coal,
– 60 years for conventional natural gas,
– 56 years for conventional oil.
REFERENCES
[1] WEC-World Energy Council,Survey of Energy Resources, 22nd edition, 2010.
[2] WEC-World Energy Council,Survey of Energy Resources: Focus on Shale Gas, 2010.
[3] WEC-World Energy Council, Survey of Energy Resources: Shale Gas-What’s New,