doi:10.1136/jech.54.7.484
2000;54;484-493
J. Epidemiol. Community Health
Jussi Vahtera, Mika Kivimäki, Jaana Pentti and Töres Theorell
follow up of initially healthy employees
environment on sickness absence: a seven year
Effect of change in the psychosocial work
http://jech.bmj.com/cgi/content/full/54/7/484
Updated information and services can be found at:
These include:
References
http://jech.bmj.com/cgi/content/full/54/7/484#otherarticles
31 online articles that cite this article can be accessed at:
http://jech.bmj.com/cgi/content/full/54/7/484#BIBL
This article cites 28 articles, 12 of which can be accessed free at:
Rapid responses
http://jech.bmj.com/cgi/eletter-submit/54/7/484
You can respond to this article at:
service
Email alerting
top right corner of the article
Receive free email alerts when new articles cite this article - sign up in the box at the
Notes
http://journals.bmj.com/cgi/reprintform
To order reprints of this article go to:
http://journals.bmj.com/subscriptions/
go to:
Journal of Epidemiology and Community Health
E
V
ect of change in the psychosocial work
environment on sickness absence: a seven year
follow up of initially healthy employees
Jussi Vahtera, Mika Kivimäki, Jaana Pentti, Töres Theorell
Abstract
Study objective—To investigate the impact of changes in psychosocial work environ-ment on subsequent sickness absence.
Design—Analysis of questionnaire and sickness absence data collected in three time periods: 1990–1991, before the sion; 1993, worst slump during the reces-sion; and 1993–1997, a period after changes.
Setting—Raisio, a town in south western Finland, during and after a period of eco-nomic decline.
Participants—530 municipal employees (138 men, 392 women) working during 1990–1997 who had no medically certified sick leaves in 1991. Mean length of follow up was 6.7 years.
Main results—After adjustment for the pre-recession levels, the changes in the job characteristics of the workers during the recession predicted their subsequent sick leaves. Lowered job control caused a 1.30 (95% CI = 1.19, 1.41) times higher risk of sick leave than an increase in job control. The corresponding figures in relation to decreased social support and increased job demands were 1.30 (95% CI = 1.20, 1.41) and 1.10 (95% CI = 1.03, 1.17), respectively. In some cases there was an interaction with socioeconomic status, changes in the job characteristics being stronger predictors of sick leaves for employees with a high income than for the others. The highest risks of sick leave (ranging from 1.40 to 1.90) were associated with combined eVects related to poor levels of and negative changes in job control, job demands and social sup-port.
Conclusion—Negative changes in psycho-social work environment have adverse eVects on the health of employees. Those working in an unfavourable psychosocial environment before changes are at great-est risk.
(J Epidemiol Community Health2000;54:484–493)
Several studies have demonstrated the associ-ation between the level of job characteristics and various aspects of health (for example, cardiovascular mortality and morbidity, sick-ness absence).1–10
Consequently, policy impli-cations of prior studies have included strategies to change the work environment toward a direction in which the level of job characteris-tics indicates lower health risk.11
To be precise,
however, evidence showing that a change in job characteristics is really followed by a change in health is still sparse.
Exposure to job characteristics, such as job control, job demands and social support at work, has been assessed in the studies of Johnson et al12
and Bosma et al.13
The first investigation showed that workers with low job control had a significantly higher relative risk for cardiovascular mortality than other workers, and that this risk varied slightly depending on the exposure time. However, workers exposed to both low control and low social support for a long period of time had the highest relative risk. By calculating the mean from the levels of job characteristics obtained on two occasions, Bosma et al13
showed that the participants with high levels of control at both phases were at a lower risk of self reported disease than those having low job control on both occasions. The risk of disease in the intermediate exposure group was between those found in the two above mentioned groups. The intermediate group included participants with stable intermediate job control and those who changed from low to high job control, as well as those who changed from high to low job control between the phases.
Instead of exposure, Theorellet al14
focused on changes in the psychosocial work environment by comparing the levels of job characteristics 10 years before and one year before the first myocardial infarction in a case-referent study. A decrease in job control during the 10 years preceding the infarction, as indicated by a transition to a lower job status, was associated with increased risk after adjustments for demographic, biological and behavioural risk factors. Corresponding results were not obtained in relation to job demands.
In addition to these epidemiological studies, some laboratory and field experiments and cross sectional studies have demonstrated physiological responses and changes in self reported well being after implementation of work related interventions or changes in work-ing conditions.15–20
Despite the large number of empirical stud-ies, several open questions remain. Firstly, research on exposure to an adverse work envi-ronment did not specify how changes in job characteristics—either positive or negative— may aVect the development of health. Sec-ondly, in the study of Theorell et al14
the direction of changes was indicated. However,
J Epidemiol Community Health2000;54:484–493 484
Finnish Institute of Occupational Health, Hämeenkatu 10, FIN 20500 Turku, Finland J Vahtera
J Pentti
Department of Psychology, Division of Applied Psychology, University of Helsinki, Helsinki, Finland M Kivimäki
Swedish National Institute for Psychosocial Factors and Health, Stockholm, Sweden T Theorell
Correspondence to: Dr Vahtera
(jussi.vahtera@occuphealth.fi)
the data on these changes were derived from a trajectory of job status that may indicate not only modifications in job characteristics but also in income, socioeconomic status and other health related factors. Thirdly, experiments were restricted in terms of follow up time (not exceeding one year) and health indicators (physiological reactions and self reports) giving therefore only minimal information about changing risks of disease in relation to interventions.
To eliminate some of these limitations, we took advantage of a naturalistic situation that permitted direct comparison of the eVects of diVerent work situations on the health of Finnish municipal employees in 1990–1997. During these years, Finland faced its most severe economic decline since the first world war.21
As a consequence, reductions of personnel, reorganisations and other major changes in work took place in many occupa-tions and workplaces.22
We examined how these variations predicted the development of sickness in a sample of initially healthy employees.
Methods
The participants were 530 full time municipal employees (138 men, 392 women) working during 1990–1997 in the service of the town of Raisio, in south western Finland. We used the employer’s records to identify 981 employees in Raisio who had worked for at least six months in 1991 before major changes, and for at least six months in 1993 when the most extensive reductions in personnel oc-curred. Of these employees, we selected all those (n = 674) who had no medically certified sick leaves in 1991, representing the healthy cohort at the beginning of the study. Alto-gether 530 (79%) of them agreed to partici-pate in the study and responded to the surveys in 1990 and 1993. None of the respondents rated their health as poor in the first survey. After adjusting for demographic characteris-tics, there were no diVerences in sickness absence rates in 1993–1997 between the respondents and the non-respondents. The occupations of the participants ranged from higher grade white collar workers (for exam-ple, managers, physicians, teachers), lower grade white collar workers (for example, tech-nicians, registered nurses, oYce workers) to blue collar workers (for example, cleaners, maintenance workers, institution kitchen as-sistant).
As a consequence of the economic reces-sion, contacted days worked by municipal employees in Raisio fell by 14.5% between 1991 and 1993.22
StaVnumbers were reduced partly through retirement and partly through not filling vacancies. Savings were also gained by not hiring cover for those absent from work. Only employees without permanent contracts of employment lost jobs. The reduction was greater among women (16%) than among men (10%). At the same time, the age profile of employees changed greatly. Contracted days worked by those over 50 years of age rose from
22% to 29% of all contracted days worked. After 1993, contracted days worked gradually increased but were still 5.7% lower in 1997 than in 1991.
The employer’s records from 1 January 1991 to 31 December 1997 relating to medically certified sickness absences and the follow up times of these employees were analysed. For each employee, the number of contracted days worked was calculated by deducting the number of days absent from work between 1991 and 1997 from the total contracted days in those years. All causes of absence were noted except sickness. Thus, contracted days worked represented the peri-ods of time during which sickness absences could emerge. The follow up time was 941 person years for men and 2611 person years for women. To increase comparability to prior research,4
some of the analyses were additionally performed in data including also employees with sick leaves in 1991 (189 men related to a follow up of 1275 person years; 575 women and 3792 person years).
We divided the data into three time periods: 1990, before the major changes (time 1), 1993, the worst point in the downsizing (time 2); and 1993–1997, when the downsizing had slowed down (time 3). Changes in self reported job characteristics were assessed using the information obtained by question-naire surveys at times 1 and 2. Job characteris-tics were measured by sets of questions relating to skill discretion (four items; Cron-bach’s áreliability r= 0.78, range 6.3–100), authority to make decisions (seven items;r= 0.84, range 0–100), opportunities to partici-pate in decision making (three items;r= 0.76, range 0–100) and predictability in relation to work (four items;r= 0.67, range 6.3–100), as elements in job control6 23–26
; psychological demands of work (five items;r= 0.70, range 15–100) and physical demands of work (three items; r = 0.55, range 1.7–5)25 26
; and social support from superiors (nine items;r= 0.90, range 1–5) as well as from workmates (four items;r= 0.83, range 1–5).27
job control and job demands, we aggregated scores for each occupational group, classified according to Statistics Finland28
; for the meas-ures of social support, aggregate scores were calculated for each work place. The respective aggregate score was linked to each participant. The scores were standardised in the same way as the individual scores. The change in each aggregated job characteristic was calculated by subtracting the aggregate score at time 2 from the aggregate score at time 1.
Data on sick leaves were collected from the records kept by the Raisio occupational health care unit. The records list the beginning and end dates of each sick leave for each employee. All certificates relating to sick leaves, irrespec-tive of place of issue, must be forwarded for recording. Employees may fill out their own certificates for absences of three days or less. For absences of over three days, medical certificates are required. We dealt only with the number of long spells of sickness absence. They are strongly associated with other health measures and common predictors of health such as age, socioeconomic status and health-risk behaviours.6 22 26 29 30
Regarding the corre-sponding associations with short spells, the results are mixed.22 26 30
Thus, short spells may reflect more than long spells non-health related absence in addition to that driven by illness.
To identify employees with health problems at the beginning of the study (that is, employees who were excluded from the cohort), we recorded all sick leaves during time 1 (1 Janu-ary to 31 December 1991). To study the eVects of changes in job characteristics between times 1 and 2 on health at time 3, we grouped all 985 sick leaves that occurred after changes from 1 January 1993 to 31 December 1997. We checked the records for inconsistencies, and combined any overlapping or consecutive peri-ods of sickness absence.
The procedures for recording sick leave in Finnish municipalities are reliable. Employees are paid their full salary during periods of sick leave. Employers receive compensation from the Finnish Social Insurance Institution for salaries paid to employees on sick leave after the first 10 days. To receive full compensation, the employers are required to keep strict records of sick leave.
Maternity leaves and absences attributable to caring for a sick child are not included in the sickness absences. Regulations concerning the work contracts made by Finnish municipalities allow an employee to be absent from work without interruptions in salary payment to care for their under 10 year old child with an acute illness. Each such absence spell is fully compensated up to three days, and there are no limitations in the number of the spells per employee per year. Thus, the participants had no reason to wrongly report being ill when staying at home to care for their own sick child.
We also investigated seven other potential predictors of sickness: sex; age; annual income status; behavioural risks such as smoking, alco-hol consumption, and sedentariness; and over-weight as a biological risk factor.6 22 31 32
Annual
incomes were transformed logarithmically to assess diVerences in relative income and because of skewness of the measure. We deter-mined whether the subjects smoked regularly (yes or no), the amount of alcohol consumed (g of alcohol per week; high consumption defined as > 280 g/week in men, > 190 g/week in women), the amount of physical activity (sedentariness was defined as less than half an hour of rapid walking per week), and the body mass index (BMI) of each subject (overweight was defined as BMI > 27 kg/m2
).
DATA ANALYSES
As descriptive statistics, mean levels of job characteristics at times 1 and 2 were calculated, and the diVerence was tested by repeated measures analysis of variance. Interactions with sex, age and income were tested. The extent of the change in job characteristics between times 1 and 2 for each participant was calculated. We calculated the number of periods of sick leave and the follow up period in person years for each employee. Because the number of sick leaves is a form of count data, Poisson regression models were fitted to the data.22 29 33
Use of the Poisson model implies that the between employee variance in the rates of sick leave is equal to the expected rate of sick leave. In this study, the dispersion in the rates of sick leave was close to that predicted from the Pois-son model.
We used hierarchical Poisson regression models to estimate the strength of the relations of the level of job characteristics at time 1, and change in job characteristics between times 1 and 2 to medically certified sick leaves at time 3. The rate of sick leaves per 100 person years and the corresponding rate ratios for predictors at high and low levels were calculated. As regards the job characteristics at time 1, the cut oVpoints for high and low level referred to +1 SD and −1 SD, respectively. Concerning the change in job characteristics, high and low lev-els referred to the magnitude of change in job characteristics +0.5 SD between times 1 and 2. The levels of and changes in job characteristics were treated as continuous variables in all analyses. We adjusted rate ratios and their 95% confidence intervals (CI) for behavioural and biological risk factors. When studying the association between the change in job charac-teristics and sick leave, we additionally adjusted the rate ratios for the level of job characteristics at phase 1. We tested the eVects of demograph-ics (that, sex, age (18–41 years, n = 267, 42–63 years, n = 263) and income (above the mean, n = 279, below the mean, n = 251)) on the rela-tion between levels of changes in job character-istics and periods of sick leave by using a cross product term as recommended by Cohen and Cohen.34
Correspondingly, a set of moderated hierarchical Poisson regression analyses were performed to estimate the joint eVects of the level of job characteristics at time 1 and change in job characteristics between times 1 and 2 on sick leave at time 3 by entering a cross product term “level of job characteristics X change in job characteristics”. Finally, appropriate
second level interactions with sex, age, and income were tested separately.
We used the SAS program package for all analyses. Poisson regression models were calculated using the GENMOD procedure.35
Results
Job characteristics were perceived in a more favourable way in the initially healthy sample than among employees with sick leaves at time 1. For example, the mean of job control was 61.24 in the first sample but only 57.12 in the latter sample (t= 3.76, p<.001).
In the initially healthy sample, a large number of participants was exposed to major changes, both negative and positive, between times 1 and time 2 (table 1). There were several diVerences in the level of job characteristics between the participants. The level of skill dis-cretion and opportunities to participate in decision making decreased, and predictability in relation to work and physical demands (only in employees with a high income) increased between times 1 and 2 (table 2).
Before adjustments, all the job characteris-tics at time 1 predicted sick leave at time 3, except for decision authority and supervisory support (table 3). In no case was their eVect dependent on sex or age. Adjustments for behavioural and biological risk factors did not change these figures significantly.
The analyses performed for the sample con-taining also those employees who had been on sick leave at time 1 showed significantly higher associations between job characteristics and sickness absence (for example, in a fully adjusted Poisson regression model including adjustment for sick leaves before change, the risk of sick leave was 1.37 (1.22, 1.54) times higher in employees with poor job control than in employees with strong job control. The cor-responding risk observed in the initially healthy cohort was 1.24 (1.09, 1.41)).
After adjustment for the level of job charac-teristics at time 1, the change in them between times 1 and 2 significantly predicted sick leaves at time 3 (table 3). Considering self reported measures, a change in every job characteristic
Table 1 Percentage of participants according to degree of change in self reported characteristics of the psychosocial work environment
Number
Change in perceived work characteristics between 1990 and 1993 (% participants)
Major decrease (>0.5 SD)
Minor decrease
(0.1–0.5 SD) No change
Minor increase (0.1–0.5 SD)
Major increase (>0.5 SD)
Job control (total) 528 20.3 26.1 5.3 24.4 23.9
Skill discretion 528 22.3 19.9 23.1 16.7 18.0
Decision authority 525 24.0 19.4 13.4 17.3 25.7
Participation in decision
making 526 32.9 15.0 14.1 11.8 26.2
Predictability 526 14.4 12.3 19.5 18.3 35.0
Social support (coworker) 521 32.2 12.3 12.7 20.3 22.5
Social support (supervisor) 522 26.1 22.9 7.1 21.9 22.0
Job demands (psychological) 529 27.2 11.9 13.5 15.5 31.9
Job demands (physical) 529 16.3 15.8 27.6 18.7 21.6
Table 2 Mean level of psychosocial work characteristics
DiVerence between†
Gender Age group SES group
Time‡ F value (1.530) Men
(n=138) Women (n=392)
F value (1.530)
18–41 (n=267)
42–63 (n=263)
F value (1.530)
Low (n=251)
High (n=279)
F value (1.530)
Job control (total) 0.3 2.4 10.8** 0.3
1990 60.0 61.7 62.0 60.4 59.2 63.0
1993 61.8 61.4 62.4 60.5 59.7 63.1
Skill discretion 1.6 4.3* 22.9*** 4.3*
1990 71.3 73.8 74.5 71.8 70.0 76.0
1993 71.1 72.3 73.3 70.6 68.6 74.9
Decision authority 0.6 2.3 0.1 0.3
1990 54.7 57.5 58.0 55.5 56.6 56.9
1993 57.1 57.2 58.4 55.9 57.8 56.7
Participation in decision making 0.4 0.1 21.2*** 8.2**
1990 48.6 49.7 49.4 49.4 46.0 52.4
1993 49.6 46.1 47.6 46.4 42.6 50.9
Predictability 0.0 0.5 10.5** 42.6***
1990 67.7 67.4 67.8 67.2 65.2 70.0
1993 71.4 71.7 72.0 71.2 70.1 72.9
Social support (coworker) 8.4** 6.5* 1.7 0.1
1990 3.25 3.48 3.32 3.52 3.40 3.44
1993 3.26 3.47 3.35 3.48 3.34 3.47
Social support (supervisor) 0.8 0.2 3.2 1.6
1990 3.40 3.43 3.41 3.44 3.47 3.38
1993 3.31 3.41 3.42 3.34 3.45 3.32
Job demands (psychological) 0.0 0.6 13.3*** 2.1
1990 58.3 58.6 57.7 59.4 57.2 59.7
1993 60.0 59.4 59.5 59.6 56.8 62.0
Job demands (physical)§ 2.4 7.0** 6.1* 3.3
1990 3.11 3.23 3.12 3.27 3.29 3.11
1993 3.21 3.26 3.19 3.30 3.27 3.22
was predictive of sickness absences. In relation to aggregated measures, reductions in job con-trol or in its dimensions, except for decision authority, as well as an increase in physical demands associated with heightened health risk.
We tested whether the sick leaves at phase 3 could be explained by exposure to an adverse work environment between times 1 and 2. The average of the levels of job characteristics at times 1 and 2, indicating exposure, was a significant predictor of forthcoming sick leaves. However, the models including the level of exposure to job control or social support did not predict sickness absence as eVectively as the models including the baseline level and changes in the corresponding job characteris-tics. For example, exposure to poor job control explained a 63% lower variance in sick leaves than the baseline level adjusted changes in job control (explained variance in sick leaves by the exposure model was 2.4% and by the change model 4.0%). For coworker support, the respective diVerence was 39%. Only in one case—that is, participation in decision making—exposure to job stressors explained an equal amount of variance in sickness absences as the change in them.
In relation to the eVects of changes in job characteristics, several interactions with sex, age and income were detected (table 4). For example, decreased job control was a greater health risk for employees at 42–63 years of age and those with a higher than average income and impaired discretion relating to skills and reduced coworker support were greater risks for women than for men.
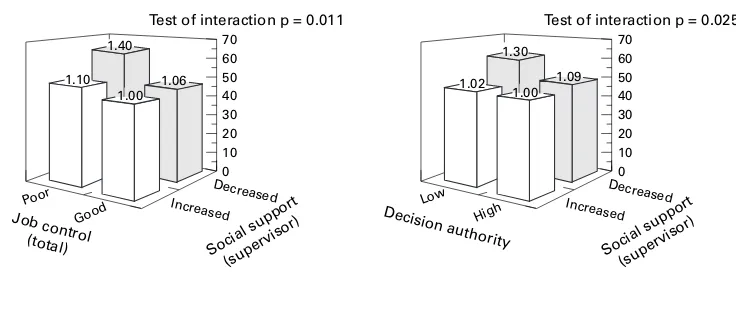
In six cases, the joint eVects of the level of a job characteristic at time 1 and a change in another job characteristic between times 1 and 2 on sick leaves at time 3 were evident (fig 1). Health risk was highest in the following combi-nations of the dimensions of psychosocial work environment: poor job control or decision authority at baseline combined with decreasing supervisory support; high physical demands at baseline, together with decreased coworker or supervisory support; low supervisory support at baseline combined with reduction in skill discretion or decision authority. In no cases was the interaction dependent on sex or age.
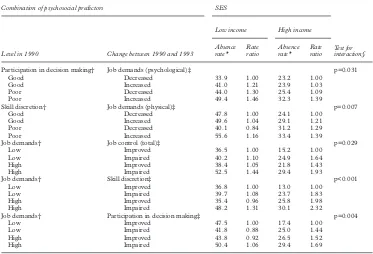
Finally, in five cases the interaction between a job characteristic at time 1 and a change in another job characteristic between times 1 and 2 was dependent on SES (table 5). In general, the joint eVects of job characteristics on sickness absence were stronger for employees with a high income than for those with a low income. In no cases, was the interaction dependent on sex or age.
Discussion
We explored how changes in the psychosocial work environment were associated with the subsequent development of illnesses in an initially healthy sample of employees. We focused on the gap between prior policy impli-cations and the empirical evidence on which these implications are based. Although reduc-tions in adverse psychosocial job characteristics
T able 3 Ra te ra tios of subsequent sic k lea v es by the lev el of and chang e in psychosocial w or k en vironment Lev el of psychosocial w or k char acter istics in 1990 Chang e in psychosocial w or k char acter istics betw een 1990 and 1993 Good P oor Impro v ed Impaired Individual Agg reg a te adjusted ra te ra tio (95% C I)† Individual Agg reg a te a djusted ra te ra tio (95% C I)‡ Unadjusted ra te ra tio (95% CI) Adjusted ra te ra tio (95% CI)† Unadjusted ra te ra tio (95% CI) Adjusted ra te ra tio (95% CI)‡ J ob control* Job c ontrol (total) 1.00 1.25 (1.10, 1.41) 1.24 (1.09, 1.41) 1.56 (1.38, 1.77) 1.00 1.31 (1.21, 1.42) 1.30 (1.19, 1.41) 1.27 (1.08, 1.51) Skill discretion 1.00 1.18 (1.03, 1.34) 1.15 (1.00, 1.32) 1.60 (1.41, 1.82) 1.00 1.34 (1.22, 1.46) 1.34 (1.22, 1.47) 1.71 (1.41, 2.07) Decision a uthor ity 1.00 1.05 (0.92, 1.18) 1.08 (0.95, 1.22) 1.24 (1.09, 1.41) 1.00 1.25 (1.16, 1.35) 1.23 (1.14, 1.34) 1.02 (0.89, 1.16) P a rticipa tion in decision making 1.00 1.46 (1.29, 1.66) 1.42 (1.24, 1.62) 1.58 (1.40, 1.80) 1.00 1.18 (1.08, 1.28) 1.13 (1.04, 1.23) 1.21 (1.04, 1.41) Predictability 1.00 1.14 (1.01, 1.30) 1.15 (1.01, 1.30) 1.65 (1.45, 1.88) 1.00 1.17 (1.08, 1.26) 1.17 (1.09, 1.27) 1.34 (1.16, 1.55) Social inter action* Social suppor t (co w orker) 1.00 1.26 (1.11, 1.43) 1.23 (1.08, 1.40) 1.30 (1.14, 1.47) 1.00 1.29 (1.20, 1.39) 1.30 (1.20, 1.41) 0.96 (0.88, 1.06) Social suppor t (super visor) 1.00 1.10 (0.97, 1.24) 1.12 (0.99, 1.28) 1.05 (0.93, 1.19) 1.00 1.13 (1.04, 1.22) 1.15 (1.06, 1.24) 0.88 (0.80, 0.96) J ob stressors* Psycholog ical demands 1.00 1.21 (1.07, 1.38) 1.21 (1.05, 1.38) 0.89 (0.78, 1.00) 1.00 1.11 (1.04, 1.18) 1.10 (1.03, 1.17) 1.00 (0.95, 1.05) Ph ysical demands 1.00 1.73 (1.52, 1.98) 1.66 (1.45, 1.90) 1.77 (1.56, 2.01) 1.00 1.18 (1.10, 1.26) 1.15 (1.07, 1.24) 1.12 (1.01, 1.24) *Cut o V points for lev el refer to ± 1 SD a nd for c hange to ± 0.5 S D . †Ra te ra tios for sick lea v e associa ted with lev el of predictor s adjusted for poor health habits (high alcohol consumption, smoking and sedent ar y lifestyle) and b iolog ical risk fac-tor s (high body mass index). ‡Ra te ra tios for sick lea v e associa ted with change in job character istics adjusted for lev el of predictor b efore change, poor health habits (high alcohol consumption, smoking and sedentar y lifestyle) and b iolog ical risk factor s (high body mass index).
have often been called for by researchers, there has been a lack of epidemiological data indicating that such alterations indeed are helpful. Our findings suggest that changes in work characteristics, such as job control, job demands and social support at work are important predictors of sickness.
Sickness absence has frequently been used as an indicator of employee health, although the decision to stay away from work is also likely to be influenced by a number of attitudi-nal and social factors (for example, indispensa-bility at work, potential risk of wage reduction, family responsibilities, and informal norms of workmates regarding acceptance levels of absence). To minimise the eVect of these con-founding factors, we considered only medically certified sick leaves. According to Marmot and his colleagues,30
medically certified sickness absences serve as a measure of health in the working population when health is understood as a mixture of social, psychological and physiological functioning. Thus, our data reflect the development of health in general but do not provide information on specific dis-eases.
Consistently with numerous studies,1–10 36
we found that the level of work characteristics was related to health problems. New medically cer-tified sick leaves were more common in people who had a job with low job control, poor
co-worker support, high psychological demands or high physical demands. However, the magnitude of the association between job char-acteristics and sick leave was slightly lower than that reported in previous research on sickness absenteeism.4 29
For example, the rates of long spells of sickness absence in low job control compared with high job control reported by North et al4
were 25% higher than those observed in this study. This may reflect diV er-ences in the samples. By including only people with no medically certified sick leaves at base-line and at least average self rated health status at that time, we applied a more stringent inclu-sion criterion than that in earlier studies of sickness absence. When we performed the analyses for the total sample, using the same inclusion criterion as researchers in the other studies, the ratio for the rates of sick leave in an adverse psychosocial work environment com-pared with a favourable one was similar to those reported previously. Although exclusion of the employees with baseline sickness from the sample increased the validity of our study design, it also significantly constricted the vari-ance in job characteristics and therefore decreased their power to predict sick leaves. It is also possible that employees with poor health are more vulnerable to the eVects of an adverse psychosocial work environment.6 22
For these reasons, the present results may represent an
Table 4 Influence of sex, age and SES on the relation between change in psychosocial work environment and subsequent sick leaves
Men Adjusted rate ratio (95% CI)†
Women Adjusted rate ratio (95% CI)†
Test for interaction
Age 18–41 years Adjusted rate ratio (95% CI)†
Age 42–63 years Adjusted rate ratio (95% CI)†
Test for interaction
Low income Adjusted rate ratio (95% CI)†
High income Adjusted rate ratio (95% CI)†
Test for interaction
Job control (total)* NS p=0.001 p=0.037
Improved 1.00 1.00 1.00 1.00
Impaired 1.17 (1.04,
1.31)
1.54 (1.35, 1.76)
1.20 (1.08, 1.33) 1.48 (1.27, 1.72)
Skill discretion* p=0.024 NS NS
Improved 1.00 1.00 — — — —
Impaired 1.16 (0.93,
1.44)
1.39 (1.26, 1.53)
Decision authority* NS p=0.041 NS
Improved 1.00 1.00 — —
Impaired 1.17 (1.05,
1.30)
1.34 (1.19, 1.51) Possibilities for
participation*
NS p=0.003 p=0.012
Improved 1.00 1.00 1.00 1.00
Impaired 1.09 (0.90,
1.13)
1.31 (1.15, 1.49)
0.99 (0.88, 1.11) 1.25 (1.09, 1.43)
Predictability* NS NS p=0.047
Improved 1.00 1.00
Impaired 1.09 (0.99, 1.21) 1.30 (1.15, 1.47)
Social support (coworker)* p=0.021 NS NS
Improved 1.00 1.00 — — — —
Impaired 1.18 (0.99,
1.41)
1.37 (1.25, 1.49) Social support
(supervisor)*
NS p=0.045 NS
Improved 1.00 1.00 — —
Impaired 1.04 (0.93,
1.17)
1.25 (1.12, 1.40)
Social support (coworker)* p=0.021 NS NS
Improved 1.00 1.00 — — — —
Impaired 1.18 (0.99,
1.41)
1.37 (1.25, 1.49) Job demands
(psychological)*
NS NS NS
Increased — — — — — —
Decreased
Job demands (physical)* NS NS NS
Increased — — — — — —
Decreased
underestimation of the actual extent of the eVect of the levels of psychosocial work charac-teristics on health.
In addition to the level of job characteristics at a certain point of time, prior research has determined the health risks related to various exposures to these characteristics.12 13
Exposure to these characteristics may be identical for people facing a decrease in a job characteristic from a high level to a lower level, for people with a stable intermediate level of a job
charac-teristic and for persons experiencing an in-crease in the same job characteristic from a low level to a higher level. In a recent Whitehall II study by Bosmaet al,13
for example, such cases were collapsed under the same category of intermediate level of exposure. Our findings do not suggest that such a procedure is an ideal one. After adjustment for the baseline level of the psychosocial work environment, a change in it led to diVerent health risks depending on the direction of the change. Health problems
Figure 1 Interaction between level of and change in psychosocial work characteristics on the rates of subsequent sick leave (sick leave per 100 person years adjusted for sex, age, SES, poor health habits (high alcohol consumption, smoking and sedentary lifestyle) and biological risk factors (high body mass index).
70 1.42
1.13
1.00 1.01
Test of interaction p = 0.002
60
40 50
30 20
0 10
Decreased
Skill discretion Social support
(supervisor)
Poor Good
70
1.35 1.40
1.00 1.19
Test of interaction p = 0.042
60
40 50
30 20
0 10
Decreased
Increased Increased
Decision authority Social support
(coworker)
Poor Good 70
1.06 1.00 1.90
1.55
Test of interaction p = 0.049
60
40 50
30 20
0 10
Decreased
Social support (supervisor) Demands
(physical)
High Low
70
1.38 1.80
1.50
Test of interaction p = 0.047
60
40 50
30 20
0 10
Decreased
Increased Increased
Social support (coworker) Demands
(physical)
High Low 70
1.40
1.06 1.00 1.10
Test of interaction p = 0.011
60
40 50
30 20
0 10
Decreased
Social support (supervisor) Job control
(total)
Poor Good
70
1.09 1.00 1.30
1.02
Test of interaction p = 0.025
Effect of level of social support in 1990 and change in job control between 1990 and 1993 on sick leaves between 1993 and 1997
60
40 50
30 20
0 10
Decreased
Increased Increased
Social support (supervisor) Decision authorityLow High
Effect of level of job control in 1990 and change in social support between 1990 and 1993 on sick leaves between 1993 and 1997
Effect of level of job demands in 1990 and change in social support between 1990 and 1993 on sick leaves between 1993 and 1997
1.00
seem to be more precisely predictable by taking into account the direction of change in the psy-chosocial work environment, rather than by simply averaging the levels of the job character-istics at two times as a measure of exposure.
It is possible that changes in job characteris-tics may contribute to the development of health problems indirectly through alteration in a person’s socioeconomic position. While this may be true in studies using occupation related inferred measures of job characteristics,14
it is not a probable explana-tion for our findings. In this study, changes in job characteristics did not associate with job transitions, and only 3% of the participants had a diVerent job within the service of the town of Raisio after the recession.
It may also be questioned whether the negative change in self rated job characteristics was a consequence of the sick leaves rather than its predecessor. Our results, which are derived from a sample of healthy employees before changes, speak against this interpret-ation. Confounding attributable to diVerences in traditional health risks, such as regular smoking, excessive alcohol consumption, a sedentary lifestyle, and overweight are not probable, either. The findings remained similar after statistically controlling the eVects of these behavioural and biological health risks. This implies that the eVects of changes in job characteristics are not likely to be medi-ated by such risks within the seven year follow up.6 37
While the eVects of changes in job character-istics did not significantly diVer between men and women, or across diVerent age groups, they were dependent on socioeconomic posi-tion. The health eVects were greater for
employees with a high income than for the oth-ers. This is an interesting finding because the literature suggests that adverse changes in health are more common among persons of low socioeconomic position.22 38
In addition, earlier studies on the Raisio sample show that the reduction in contracted days worked was greater in employees with a low income. Despite this, major downsizing was associated with higher risk of absence for employees with higher incomes.6 22
This combined with the present finding contradicts the argument that psychosocial job characteristics and their change reflect merely social position or its change.
The joint eVects of psychosocial work features have long been a matter of contro-versy. The majority of the studies have shown an additive eVect pattern of job characteristics on ill health.11
However, theoretical models and some empirical studies suggest an interac-tional eVect pattern.26 39–41
Our observations support the latter hypothesis. We obtained several true multiplicative interactions be-tween the levels of psychosocial characteristics and the changes in them. Their eVects on health were as expected on the basis of theoretical models, such as the job strain model and the iso-strain model.25 39 41
The combination of poor psychosocial work char-acteristics and an adverse change in some other psychosocial factor of the work environ-ment was associated with the greatest risk of subsequent illness. In contrast, an initially favourable work environment in which some job characteristics were further improved was related to the lowest risk of health problems. Compensatory eVects were also found. A favourable change in one feature of the
Table 5 Interaction between level of and change in psychosocial work environment in employees with low and high SES
Combination of psychosocial predictors SES
Test for interaction§
Level in 1990 Change between 1990 and 1993
Low income High income
Absence rate*
Rate ratio
Absence rate*
Rate ratio
Participation in decision making† Job demands (psychological)‡ p=0.031
Good Decreased 33.9 1.00 23.2 1.00
Good Increased 41.0 1.21 23.9 1.03
Poor Decreased 44.0 1.30 25.4 1.09
Poor Increased 49.4 1.46 32.3 1.39
Skill discretion† Job demands (physical)‡ p=0.007
Good Decreased 47.8 1.00 24.1 1.00
Good Increased 49.6 1.04 29.1 1.21
Poor Decreased 40.1 0.84 31.2 1.29
Poor Increased 55.6 1.16 33.4 1.39
Job demands† Job control (total)‡ p=0.029
Low Improved 36.5 1.00 15.2 1.00
Low Impaired 40.2 1.10 24.9 1.64
High Improved 38.4 1.05 21.8 1.43
High Impaired 52.5 1.44 29.4 1.93
Job demands† Skill discretion‡ p<0.001
Low Improved 36.8 1.00 13.0 1.00
Low Impaired 39.7 1.08 23.7 1.83
High Improved 35.4 0.96 25.8 1.98
High Impaired 48.2 1.31 30.1 2.32
Job demands† Participation in decision making‡ p=0.004
Low Improved 47.5 1.00 17.4 1.00
Low Impaired 41.8 0.88 25.0 1.44
High Improved 43.8 0.92 26.5 1.52
High Impaired 50.4 1.06 29.4 1.69
psychosocial work environment partially buV -ered from the adverse consequences of other job characteristics.
The results on joint eVects have practical implications for the management during turbu-lent working conditions. In prior research on work characteristics, job control has been shown to be one of the strongest psychosocial predictors of sickness absence, morbidity and mortality.2 4 6–8 10–14
Our findings suggest that the negative consequences of low job control can eVectively be diminished, not only by increasing job control, but also by developing leadership. High or improving supervisory support seemed to be able to reduce a significant proportion of the excessive health risk associated with low or decreasing job con-trol.
In conclusion, this study gave strong evi-dence on the potential health related eVects of changing the psychosocial work environment. Favourable transitions in job characteristics, such as job control, job demands and social support at work, seem to reduce the risk of sickness among employees. This eVect was relatively independent of age and sex. Finally, improvement in one job characteristic seems to buVer against adverse influences related to other aspects of the psychosocial work envi-ronment. All these conclusions imply that improving the psychosocial work environment or even some of its elements could decrease the risk of illness among the working popula-tion.
We thank Dr Marja Lampio from the occupational health care unit in Raisio for her help in collecting the data on sickness absenteeism.
Funding: the study has been supported by grants from the Finnish Work Environment Fund and Academy of Finland (project no 44968) for the second author.
Conflict of interest: none.
1 Broadhead WE, Kaplan BH, James SA,et al. The epidemio-logic evidence for a relationship between social support and health.Am J Epidemiol1983;117:521–37.
2 Johnson JV, Hall EM, Theorell T. Combined eVects of job strain and social isolation on cardiovascular disease morbidity and mortality in a random sample of the Swed-ish male working population.Scand J Work Environ Health 1989;15:271–9.
3 Melamed S, Ben-Avi I, Luz J,et al. Objective and subjective work monotony: eVects on job satisfaction, psychological distress, and absenteeism in blue-collar workers.J Appl
Psychol1995;80:29–42.
4 North F, Syme SL, Feeney A,et al. Psychosocial work envi-ronment and sickness absence among British civil servants: The Whitehall II study.Am J Public Health1996;86:332– 40.
5 Everson SA, Lynch JW, Chesney MA,et al. Interaction of workplace demands and cardiovascular reactivity in progression of carotid atherosclerosis: population based study.BMJ1997;314:553–8.
6 Kivimäki M, Vahtera J, Thomson J,et al. Psychosocial factors predicting employee sickness absence during economic decline.J Appl Psychol1997;82: 858–72. 7 Marmot MG, Bosma H, Hemingway H,et al. Contribution
of job control and other risk factors to social variations in coronary heart disease incidence.Lancet1997;350:235–9. 8 Lynch J, Krause N, Kaplan GA,et al. Workplace conditions, socioeconomic status, and the risk of mortality and acute myocardial infarcation: the Kuopio ischemic heart disease risk factor study.Am J Public Health1997;87:617–22. 9 Amick BC III, Kawachi I, Coakley EH,et al. Relationship of
job strain and iso-strain to health status in a cohort of women in the United States.Scand J Work Environ Health 1998;24:54–61.
10 Bosma H, Peter R, Siegrist J,et al. Two alternative job stress models and the risk of coronary heart disease.Am J Public
Health1998;88:68–74.
11 Theorell T, Karasek RA. Current issues relating to psycho-social job strain and cardiovascular disease research.J
Occup Health Psychol1996;1:9–26.
12 Johnson JV, Steward W, Hall EM,et al. Long-term psycho-social work environment and cardiovascular mortality among Swedish men.Am J Public Health1996;86:324–31. 13 Bosma H, Marmot MG, Hemingway H,et al. Low job con-trol and risk of coronary heart disease in Whitehall II (pro-spective cohort) study.BMJ1997;314:558–65. 14 Theorell T, Tsutsumi A, Hallquist J,et al, The SHEEP
Study Group. Decision latitude, job strain, and myocardial infarction: a study of working men in Stockholm.Am J
Public Health1998;88:382–8.
15 Jackson SE. Participation in decision making as a strategy for reducing job-related strain.J Appl Psychol1983;68:3– 19.
16 Steptoe A, Fieldman G, Evans O,et al. Control over work pace, jot strain and cardiovascular responses in middle-aged men.J Hypertension1993;11:751–9.
17 Theorell T, Perski, A, Åkerstedt T,et al. Changes in job strain in relation to changes in physiological state.Scand J
Work Environ Health1988;14:189–96.
18 Theorell T, Karasek RA, Eneroth P. Job strain variations in relation to plasma testosterone fluctuations in working men - a longitudinal study.J Intern Med1990;227:31–6. 19 Karasek RA. Lower health risk with increased job control
among white collar workers. Journal of Organizational
Behaviour1990;11:171–85.
20 Grossi G, Theorell T, Jurisoo M,et al. Psychophysiological correlates of organizational change and threat of unem-ployment among police inspectors.Integrative Physiology
and Behavioral Medicine1999;34:30–42.
21Statistical yearbook of Finland 1998. Helsinki, Finland:
Statistics Finland; 1998.
22 Vahtera J, Kivimäki M, Pentti J. EVect of organisational downsizing on health of employees.Lancet1997;350:1124– 8.
23 Aronsson G. Dimensions of control as related to work organization, stress, and health.Int J Health Serv1989;19: 459–68.
24 Frese M. Theoretical models of control and health. In: Sau-ter SL, Hurrell JJ Jr, Cooper CL, eds.Job control and worker
health. New York: Wiley, 1989:107–28.
25 Karasek R, Theorell T.Stress, productivity and reconstruction
of working life. New York: Basic Books, 1990.
26 Vahtera J, Uutela A, Pentti J. The eVects of objective job demands on registered sickness absence spells: do personal, social and job-related resources act as moderators?Work
and Stress1996;19:286–308.
27 Lehto A-M. Quality of working life and equity.Helsinki, Finland: Statistics Finland, 1991.
28Classification of occupations. Handbook no 14. Helsinki,
Finland: Statistics Finland, 1987.
29 North F, Syme SL, Feeney A,et al. Explaining socioeco-nomic diVerences in sickness absence: the Whitehall II study.BMJ1993;306:361–6.
30 Marmot MG, Feeney A, Shipley M,et al. Sickness absence as a measure of health status and functioning: from the UK Whitehall II study. J Epidemiol Community Health1995;49: 124–30.
31 Kaprio J, Koskenvuo M, Langinvainio H,et al. Genetic influences on use and abuse of alcohol: A study of 5638 adult Finnish twin brothers.Alcohol Clin Exp Res1987;11: 349–56.
32 Kujala J, Kaprio J, Sarna S,et al. Relationship of leisure-time physical activity and mortality. The Finnish twin cohort. JAMA1998;279:440–4.
33 McCullagh P, Nelder JA.Generalized linear models. London: Chapman and Hall, 1989.
34 Cohen J, Cohen P. Applied multiple regression/correlation
analysis for the behavioral sciences. 2nd ed. Erlbaum, NJ:
Hillsdale, 1983.
35 SAS Technical Report P-243, SAS/STAT Software:The
genmod procedure, Release 6.09. Cary, NC: SAS Institute Inc,
1993. KEY POINTS
x Negative changes in psychosocial work environment have adverse eVects on the health of employees.
x The combination of poor psychosocial work characteristics and an adverse change in some other psychosocial factor of the work environment was associated with the greatest risk of subsequent illness.
x A favourable change in one feature of the psychosocial work environment partially buVered from the adverse consequences of other job characteristics.
x High or improving supervisory support seemed to be able to reduce a significant proportion of the excessive health risk associated with low or decreasing job control.
36 Pieper C, LaCroix A, Karasek RA. The relation of psycho-social dimensions of work with coronary heart disease risk factors: a meta-analysis of five United States data basesAm
J Epidemiol1989;129:483–94.
37 Johansson G, Johnson JV, Hall EM. Smoking and sedentary behaviour as related to work organization.Soc Sci Med 1991;32:837–46.
38 Hemingway H, StaVord M, Stansfeld S, et al. Is the SF-36 a valid measure of change in population health? Results from the Whitehall II study. BMJ 1997;315: 1273–9.
39 Karasek RA Jr. Job demands, job decision latitude, and mental strain: implications for job redesign.Administrative
Science Quarterly1979;24:285–308.
40 Alfredsson L, Karasek R, Theorell T. Myocardial infarction risk and psychosocial work environment: an analysis of the male Swedish working force. Soc Sci Med 1982;16: 463–7.
41 Johnson JV, Hall EM. Job strain, work place social support, and cardiovascular disease: a cross-sectional study of a ran-dom sample of the Swedish working population.Am J