Analysis of pressure losses in the diffuser of a control valve
Petr Turecký1, Lukáš Mrózek2*, Ladislav Taj2, and Michal Kolovratník3
1
ENVIROS, s.r.o., Dykova 53/10, 101 00 Praha 10-Vinohrady, Czech Republic 2
Univerzity of West Bohemia, Department of Power System Engineering, Univerzitní 22 Pilsen 306 14, Czech Republic 3
Czech Technical University in Prague, Department of Energy Engineering, Technická 4, Prague 6, Czech Republic
Abstract. The pressure loss in the diffuser of a control valve is evaluated by using CFD computations. Pressure ratios and lifts of a cone for the recommended flow characteristics of an experimental turbine are considered. The pressure loss in a valve is compared with the pressure loss in a nozzle, i.e. the embodiment of the valve without a cone. Computations are carried out for the same mass flow. Velocity profiles are evaluated in both versions of computations. Comparison of computed pressure losses, with the loss evaluated by using relations for diffusers with the ideal velocity conditions in the input cross-section, is carried out.
1 Introduction
Control valves of steam turbines are basically nozzles with a variable cross-section. A confuser as well as a diffuser channel is applied here. The change of the mass flow of the steam is enabled by adjustment of the flow area and pressure ratio across the valve. The flow area depends on the lift of a cone and the pressure ratio is determined by the operating parameters of a turbine. A sudden change of the cross-section arises in the valve under the cone. A wake vortex arises under the cone, which distorts the velocity field in the diffuser. At a certain stage of the operation control, i.e. when the turbine approaches the power, apressure loss across the valve is required. In this case the operational reliability is most important. Emphasis is placed on the control of pressure pulsations and thus extreme vibrations are controlled too. However, during nominal conditions of the turbine it is required the minimum pressure loss in the entire flow system before the turbine. In general, the pressure loss is related to friction and shape modifications of the valve. The decisive proportion of the pressure loss is caused by a sudden change of the cross-section. An outlet diffuser is used in the valve, therefore it is impossible to specify clearly for what change of the flow area this loss must be considered. Behind the cone of the valve the wake vortex arises with the flow separation. In the diffuser at small lifts of a cone the backflow arises, which may fill up its substantial part. There is a significant deformation of velocity field in the throat as well as in the entire diffuser. Available literature data for computation of the pressure loss in diffusers are based on the existence of the balanced velocity field at the inlet into the diffuser. The aim of this computation study is to evaluate the impact of the wake vortex on the increase of the pressure loss in the diffuser. Geometry of avalve with a cone and without a
cone is modelled and the pressure losses are computed for the same mass flow.
2 Operational parameters of a control
valve
Model version of a control valve is shown in figure 1.
Fig. 1. Scheme of control valve
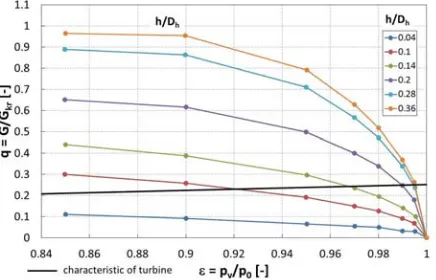
Fig. 2. Flow characteristics of valves
There is also presented expected operational characteristics of the experimental turbine. Relevant pressures and temperatures are shown in table 1. The computation study is carried out for these recommended pressure ratios and cone lifts. In table 2 are shown other characteristic data of the tested valve, respectively of a computational model of the diffuser.
Table 1. Specified parameters for the simulation
h [mm] (pv)v [Pa] p0c[Pa] T0 [K] 4 40968
100000 294 6 51051
8 67717 10 79989 14 91086 20 96067 24 97114 28 97655 36 97792
Table 2. Initial values
Inlet pressure p0c 100 kPa Inlet temperature T0 294 K Heat capacity ratio ț 1.4 - Specific gas constant r 287 J/kgK
Length l 400 mm
Diameter of diffuser throat Dh 100 mm Angle of diffuser opening Ȗ 7 ° Cross section of diffuser throat Sh 7854 mm2
Density ȡ0 1.185 kg/m3
Area ratio n 2.218 -
3 Computational models
A computational model of a valve is presented in figure 3. It is a simplified version of the normal performance of a valve. Instead of the real 3D flow in the valve chamber and in the diffuser, only the rotationally symmetrical arrangement is considered, i.e. only the variant with the 2D flow.
Fig. 3. A computational model of a valve
Fig. 4. A computational model of a nozzle
Extension of the flow channel arises already from the area of the saddle under the cone. In the variant of a nozzle as shown in figure 4, only the diffuser itself is considered with the steady area of the neck Sh. In order to achieve the same mass flow in a nozzle as in a valve, an appropriate back pressure pv behind the diffuser must be present. As a result of the wake vortex formation and a sudden change of thecross-section, the pressure loss in the variant of a valve ǻpz = p0c - pvc is higher than in a nozzle. CFD simulation of the 2D model of a control valve and a nozzle is carried out by using the ANSYS Fluent software. For individual sections of the flow channel the different density of the mesh was chosen. As a result, there are 614000 cells in a valve model and 436000 cells in a nozzle.
4 Results
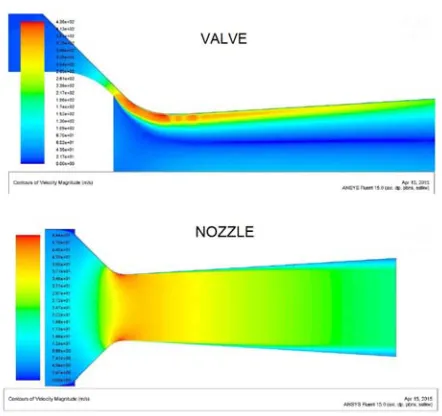
valve were added to it. The demonstration of the velocity distribution in the variant of a valve and a nozzle is shown in figure 5. These are variants corresponding to the cone lift 6 mm (h/Dh = 0.06).
Fig. 5. The velocity field in a variant of a valve and a nozzle at the same mass flow
From the detailed distribution of the velocity vectors in figure 6 the backflow and significant changes of the velocity in a narrow strip by the diffuser wall is clearly seen. The backflow does not occur in a nozzle. Computation also confirms the pressure fluctuation near by the diffuser wall at relative cone lift h/Dh < 0.08.
Fig. 6. The vector velocity distribution
Fig. 7. Section of velocity changes near the wall
Analysis of pressure pulsations and velocity changes for the section of the diffuser behind its throat in the zone 2 mm from the wall is carried out. This is shown in figure 7. Fluctuation of the static pressure and velocity is presented in the graphs in figures 8 and 9. Occurrence of
pressure pulsations is connected to local occurrence of supersonic velocities.
Fig. 8. Fluctuation of the static pressure
Fig. 9. Fluctuation of velocities by the wall
After the transition to higher cone lifts when Mach number in the diffuser throat is already Ma < 1, the pressure pulsation failed to verify by using computations. However, as the result of flushing the vortexes behind the cone the pressure changes
undoubtedly occur.
Due to the wake vortex behind a cone the velocity field in the diffuser throat is significantly distorted. Maximum velocity occurs near the diffuser wall while in its middle section the velocity may have even a negative value. Velocity ratios for a valve with proportional cone lift h/Dh = 0.04 and for a nozzle with the same mass flow are shown in figure 10. Considerably uneven velocity field also occurs at the outlet from the diffuser. Even at the cone lift h/Dh = 0.2 in the diffuser throat a backflow occurs. Velocity ratios of this variant of computation are presented in figure 11. If the nozzle embodiment (a valve without a cone) is considered, then the velocity field is very balanced in individual cross-sections.
Fig. 10. Velocity profile in the cross section of the throat and outlet from the diffuser at the lift h/Dh = 0.04
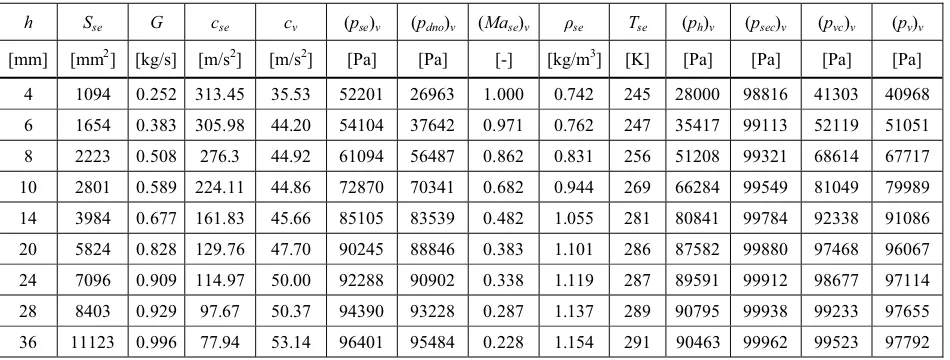
Fig. 11. Velocity profile in the cross section of the throat and from the diffuser outlet at the lift h/Dh = 0.2 Table 3. Table of averaged quantities in the saddle, in the throat and at the outlet from the valve
h Sse G cse cv (pse)v (pdno)v (Mase)v ȡse Tse (ph)v (psec)v (pvc)v (pv)v
[mm] [mm2] [kg/s] [m/s2] [m/s2] [Pa] [Pa] [-] [kg/m3] [K] [Pa] [Pa] [Pa] [Pa] 4 1094 0.252 313.45 35.53 52201 26963 1.000 0.742 245 28000 98816 41303 40968 6 1654 0.383 305.98 44.20 54104 37642 0.971 0.762 247 35417 99113 52119 51051 8 2223 0.508 276.3 44.92 61094 56487 0.862 0.831 256 51208 99321 68614 67717 10 2801 0.589 224.11 44.86 72870 70341 0.682 0.944 269 66284 99549 81049 79989 14 3984 0.677 161.83 45.66 85105 83539 0.482 1.055 281 80841 99784 92338 91086 20 5824 0.828 129.76 47.70 90245 88846 0.383 1.101 286 87582 99880 97468 96067 24 7096 0.909 114.97 50.00 92288 90902 0.338 1.119 287 89591 99912 98677 97114 28 8403 0.929 97.67 50.37 94390 93228 0.287 1.137 289 90795 99938 99233 97655 36 11123 0.996 77.94 53.14 96401 95484 0.228 1.154 291 90463 99962 99523 97792 Table 4. Quantities in the throat and at the outlet from nozzle
h [mm] (phc)d[Pa] (pvc)d[Pa] (pv)d [Pa] (ph)d[Pa]
4 99995 99981 99871 99551
6 99989 99960 99711 98961
8 99981 99933 99498 98157
10 99975 99912 99329 97507 14 99968 99885 99118 96684 20 99952 99830 98679 94932 24 99943 99796 98411 93838 28 99940 99787 98338 93537 36 99931 99755 98085 92481
From the computations it is possible to specify, by using different methods, the value of the loss coefficient for the computation of occurred pressure loss (ǻpz)v = psec pvc. We can consider the dynamic pressure in the valve saddle, in the diffuser throat, at the diffuser outlet or the pressure on the bottom of the cone.
(ǻpz)v = se(psec pse)v (1)
(pz)v = dno(psec pdno)v (2)
(pz)v = h(psec ph)v (3)
(ǻpz)v = v(psec ֙ pv)v (4) Throat
Throat
Outlet
Outlet
Valve
Valve
Valve
Valve
Nozzle Nozzle
Their course depending on the relative lift of a cone is shown in figure 12. The pressure on the bottom of the cone is similar to the pressure in the diffuser throat. The course of loss coefficients corresponds to it.
Fig. 12. The course of loss coefficients
With the gradual opening of the valve the pressure loss decreases and therefore the value of all pressure coefficients decreases too. At themaximum lift of a cone the pressure loss reaches up to 20% of the total pressure differential across the diffuser. At small lifts of a cone the critical pressure ratio is set in the saddle of the valve and the increase of loss coefficient ȗse corresponds to it.
In embodiment of a nozzle it is onthe contrary. The highest pressure loss arises at the maximum flow of the media through a nozzle. The pressure loss at the nozzle is (ǻpz)d = (phc ֙ pvc)d. From comparison of pressure losses for a valve and for a nozzle we can evaluate the relevant loss coefficient ȗd, where (ǻpz)v = ȗd(ǻpz)d. It is the flow for considered relative lifts h/Dh .It is presented in figure 13. The loss coefficient ȗd appears to change from infinity to zero.
Fig. 13. Dependence of the loss coefficient of a nozzle proportional lift
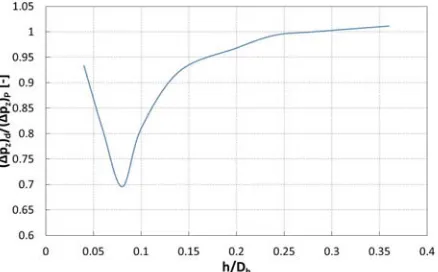
Fig. 14. Dependence of the proportional pressure loss on the proportional lift
Fig. 15. Dependence of the loss pressure coefficient on the proportional pressure at the outlet
Fig. 16. Dependence of the coefficient of pressure increase on the proportional pressure at the outlet
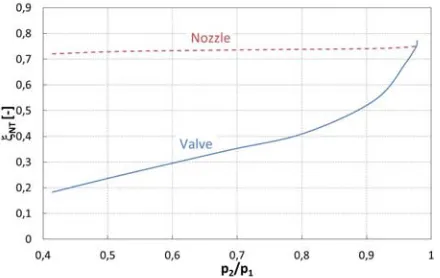
The quality of processes in diffusers may also be evaluated by using the coefficients of the pressure loss or coefficient of pressure increase. The pressure loss is presented in the graphs in figures 15 and 16. They show the differences in embodiment of a valve and a nozzle.
- Valve ߞܼܲݒൌͳ െ ݒ ݏ݁ܿ ͳ െ ݄ ݏ݁ܿ ߞܰܶݒ ൌ ݒ ݏ݁ܿെ ݄ ݏ݁ ͳ െ ݄ ݏ݁ܿ - Nozzle ߞܼܲ݀ ൌ ͳ െ ݒ ݄ܿ ͳ െ ݄ ݄ܿ
ߞܰܶ݀ ൌ ݒ ݄ܿെ ݄ ݄ܿ ͳ െ ݄ ݄ܿ
The pressure loss at the valve decreases gradually, whereas the nozzle is constant. The coefficient of the pressure increase shows asimilar course. When a valve is fully open the data for a valve and a nozzle are
consistent.
In literature [1,2] it is possible to find experimentally evaluated materials for computation of pressure losses in diffusers with ideal velocity ratios at the inlet into the diffuser. Thus for the variant of a nozzle it is possible to compare computed pressure losses with the prediction of the pressure loss according to the literature sources. The loss coefficient according to [2] is considered,
ߞܲൌ ͺ ሺߛȀʹሻߣ ݊ ͳ݊ െ ͳ ͵ǡʹሺሺߛȀʹሻሻͳǡʹͷ൨ ൬ͳ െͳ݊൰ ʹ
where J is the angle of the diffuser opening, n is ratio of the outlet area to the area of the throat and O is the coefficient of friction.
The pressure loss is evaluated as the proportion of inlet dynamic pressure.
ȟݖൌ ߞܲͳʹߩܿʹ
Good conformity with the prediction of the pressure loss is confirmed. Comparison of prediction of the pressure loss with the computed loss is presented in figue 17.
Fig. 17. Comparison of the pressure loss according to literature and from the CFD simulation
Fig. 18. Adjustment of diffuser geometry
In order to estimate the pressure loss in the diffuser of the valve, besides the loss caused by friction and by extension of the channel, the pressure loss due to the wake vortex must be evaluated too. To achieve this, the geometry of the valve must be adjusted and must be close to embodiment of a nozzle, which means the diffuser with the ideal inlet velocity field. Adjustment of valve geometry is shown in figure 18. The area of the throat changes. the nozzle adapts to this adjustment so that it could correspond to the area of the saddle under the cone of the valve and the angle of the diffuser expansion .
The entire pressure loss has three parts
ȟݖ ൌ ȟܶ ȟܴ ȟܷ
The pressure loss caused by friction
ȟܶ ൌ ߞܶ ͳʹߩܿݏ݁ʹ ൌ ߞ
ܶሺݏ݁ܿ െ ݏ݁ሻ
ߞܶ ൌ ߮ܶ൬ͳ െͳ݊൰
ʹ
ൌ ൬ͺ ሺߛȀʹሻߣ ݊ ͳ݊ െ ͳ൰ ൬ͳ െͳ݊൰ʹ
The pressure loss and loss coefficients by channel expansion pR and ȗR is evaluated similarly.
ߞܴൌ ܴ߮൬ͳ െͳ݊൰ʹൌ ͵ǡʹሺሺߛȀʹሻሻͳǡʹͷ൬ͳ െͳ
݊൰
The pressure loss caused by wake vortex pU can be reached when from computed pressure loss in the valve is the loss pT + pR deducted.
ȟܷ ൌ ሺȟܼሻܸെ ሺȟܶ ȟܴሻ ൌ ܷ߮ቀͳ െͳ݊ቁʹ ͳʹߩܿݏ݁ʹ
ߞܷൌ ܷ߮൬ͳ െͳ݊൰
ʹ
In figure 19 the friction loss coefficient T is
presented. With a gradual increase of the flow area through the valve, and with the increase of the mass flow, its value increases. However, compared withother factors impacting the final pressure loss it has the least impact.
Fig. 19. Dependence of the loss coefficient by friction on the proportional lift
Fig. 20. Dependence of the loss coefficient by expansion on the proportional lift
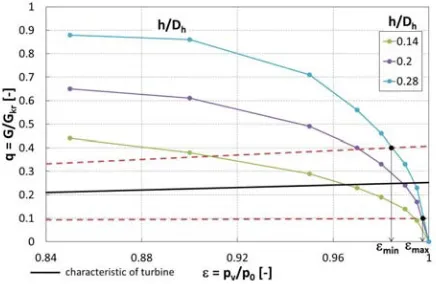
The loss coefficient of diffuser expansion and the loss coefficient of wake vortex with the cone lift decreases. Their course is presented in figure 20 and figure 21. The impact of wake vortex on the pressure loss is the most significant. The pressure loss depends on the velocity of steam flowing through a valve. The smaller the dimensions of a valve, the higher are thevelocities at a given certain quantity of the steam in the flow section of a valve, which causes the increase of the final pressure loss. The choice of dimension of the flow may impact the pressure loss in the valve under the certain operational conditions of the turbine. Figure 22 shows the range of choice of relative flow rate q. If a valve with
lower value qmax is used, Hmax is higher too and thus the pressure loss on the valve is lower.
Fig. 21. Dependence of the loss coefficient by wake vortex on the proportional lift
Fig. 22. Range of operating pressure ratios
5 Conclusion
• Due to wake vortex under the cone in the diffuser of a control valve the velocity field gets deformed. Backflow occurs in the diffuser. Flow separation from the diffuser wall may occur.
• The highest velocities occur by the diffuser wall close to its throat. This is the place with the occurrence of pressure pulsations at the supersonic steam flow.
• Uneven velocity field also occurs at the outlet from the diffuser.
• The final pressure loss can be evaluated using loss coefficients for a friction, expansion of the diffuser and for impact of the wake vortex. The wake vortex has the highest impact on the pressure loss in the valve.
• Choice of dimensions of the valve can influence the pressure loss in the valve under the certain operational conditions of a turbine.
Nomenclature
c velocity h cone lift n area ratio
p pressure
D diameter G mass flow Ma Mach number S flow area T temperature Re Reynolds number Ȗ angle of diffuser opening H pressure ratio
O coefficient of friction loss ȡ specific weight
ȗ loss coefficient
Subscripts
c total
h throats
o inlet
v outlet
se saddle
dno bottom of the cone
d nozzle
ax axial
z loss
T friction U wake vortex R dimensional PZ pressure loss NT pressure increase P prediction
References
1. M. Dej, Technická dynamika plynĤ, Praha: SNTL, 659s. (1967)
2. . . , Ⱥɷɪɨɞɢɧɚɦɢɱɟɫɤɢɣ ɷɤɫɩɟɪɢɦɟɧɬ ɜ
ɦɚɲɢɧɨɫɬɪɨɟɧɢɢ, Ʌɟɧɢɧɝɪɚɞ,
, (1974)
3. J. Nožika, Základy termomechaniky, VUT Praha, 187s. ISBN 9788001040225, (2008)
4. R. Dvoák, K. Kozel, Matematické metody
v aerodynamice, VUT Praha, 153s. ISBN
8001008517
5. J. Šesták, PĜenos hybnosti, tepla a hmoty, VUT Praha, 299s. ISBN 800101715x, (1998)
6. J. Ambrož, Parní turbíny a kondenzace, VUT