Copyright 0 1986 by the Genetics Society of America
MORPHOMETRIC DIFFERENTIATION AMONG
EXPERIMENTAL LINES OF THE HOUSEFLY I N
RELATION
TO A BOTTLENECK
EDWIN H. BRYANT, LISA M. COMBS AND STEVEN A. McCOMMAS’ Department of Biology, University of Houston, Houston, Texas 77004
Manuscript received December 2, 1985 Revised copy accepted August 29, 1986
ABSTRACT
Differentiation in morphometric traits among experimental populations of the housefly subjected to an experimental bottleneck was examined for replicate lines founded with one, four or 16 pairs of flies. Differentiation among lines within a bottleneck size was significantly greater than predicted by drift in re- lation to the additive genetic variation for these traits within the founding pop- ulation. Two models of nonadditive genetic variance were investigated to inter- pret these results, one involving dominance of allelic effects within loci and another incorporating multiplicative epistasis. Both models generated more var- iation among lines as a direct result of sampling during the bottleneck than predicted by a model with additive gene action. T h e pattern of differentiation among our experimental lines in relation to these models conformed more to the model incorporating epistasis. Nevertheless, it may be difficult to distinguish differentiation among lines occurring during a bottleneck as a result of nonad- ditive gene action from that caused by diversifying selection among lines after the bottleneck.
HEN small populations are derived by repeated sampling of individuals
W
from a donor population, the additive genetic variation present in the donor population will be converted into variation among the derived lines (FALCONER 198 1). Specifically, if replicated founder lines were initiated by sampling N individuals from a donor population with additive genetic variance, V A , the variance among such lines with be VAIN (HILL 1972; LANDE 1980), provided the lines increase in size rapidly after the founder event so no further loss in variance within lines o r differentiation among lines occurs after the bottleneck event. If divergence among derived lines is significantly greater than expected by such random drift, then differential selection among populations may be invoked as an additional cause of divergence (LANDE 1977; RICH et al. 1984).These predictions are based on additive effects among alleles within loci or among loci (FALCONER 1981, p. 240). In an experiment on drift among small
’ Present address: Department
of Microbiology and Molecular Genetics, Harvard Medical School, 25 Shattuck Street, Boston, Massachusetts 021 15.1214 E. H . BRYANT, L. M. COMBS AND S. A. MCCOMMAS
populations of Tribolium, WADE and MCCAULEY (1 984) found greater differ- entiation among lines than could be accounted for by drift. They suggested that nonadditive components of interlocus variance in the base population were transformed into additive genetic variance among lines. In a companion paper (BRYANT, MCCOMMAS and COMBS 1986) investigating changes in genetic vari- ance for morphometric traits of the housefly in relation to a bottleneck, ad- ditive genetic variance for these traits within bottleneck lines increased over that in the base population. We attributed these increases to nonadditive ge- netic variation affecting these traits. Furthermore, at least two levels of non- additive effects were evident that differentially affected the traits. One suite of three traits largely independent of body size seemed to be affected by recessive alleles initially in low frequency in the base population. A second suite of five traits associated with general body size appeared to be affected by epistatic interactions among loci in addition to dominance effects within loci.
It is unclear exactly how these nonadditive interactions within and among loci might translate into differentiation among lines. They could well alter the balance away from levels of differentiation expected under additive models [e.g., see ROBERTSON (1952) for a discussion of dominance in relation to changes in variance among inbred lines]. The purpose of this paper is to investigate differentiation in quantitative traits among replicated experimental lines of the housefly subjected to a bottleneck episode and to coordinate these results with those for changes in variation within such lines. Specifically, we first show that differentiation among our experimental bottleneck lines was greater than expected based on additivity of genetic effects. We then detail models of nonadditive genetic variance that could account for additional var- iation among bottleneck lines for these traits and compare these predictions with our results.
MATERIALS A N D METHODS
The complete details of experimental protocol can be obtained from BRYANT, MCCOMMAS and COMBS (1 986), and only an abbreviated account is given here.
Bottleneck (founder) lines were initiated with two, eight or 32 individuals selected from a newly established outbred population of the housefly, Musca domestica L. Sepa- rate male-female pairs were used to ensure that all pairs contributed offspring to the respective line so the desired bottleneck size was achieved. Four such lines were estab- lished for each bottleneck size. After the populations increased to normal laboratory size (about 1000 pairs), additive genetic components of phenotypic variance were esti- mated on all 12 bottleneck lines as well as the control (base) population by regression of offspring onto midparental values (FALCONER 198 1). ,In all, eight morphological traits were measured (for a complete description of these traits see BRYANT 1977): wing length, wing width, inner eye separation, head width, scutellum length, scutellum width, metafemur length and length of thoracic suture. These traits are more or less correlated with general fly size (BRYANT 1977; BRYANT, MCCOMMAS and COMBS 1986), and fly size varies inversely with larval density (SULLIVAN and SOKAL 1963). Therefore, density as a complicating factor was controlled by providing a constant 0.225 g of larval me- dium per egg in all tests, equivalent to a near-optimal density for these flies (BRYANT
MORPHOMETRIC DIFFERENTIATION
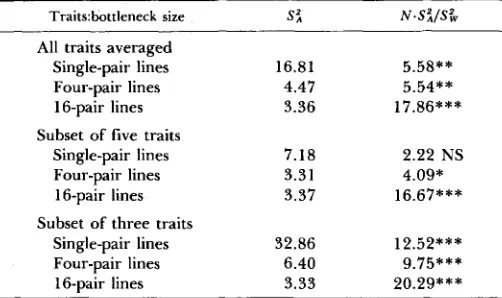
TABLE 1
Variance components of phenotypic variation among bottleneck
lines
1215
Traitshottieneck size S i N . S i l S &
All traits averaged
Single-pair lines 16.81 5.58**
16-pair lines 3.36 17.86***
Single-pair lines 7.18 2.22 NS
Four-pair lines 3.31 4.09*
16-pair lines 3.37 16.67***
Single-pair lines 32.86 12.52***
16-pair lines 3.33 20.29***
Variance components were obtained from one-way analyses of var- iance of individual traits and then averaged over all traits, the subset of three traits largely independent of body size, and the subset of five traits associated with general body size. Significance levels of the F ratio (d.f. = 3, 46) are NS = nonsignificant at P > 0.05;
*
= P < 0.05;**
= P < 0.01;***
= P < 0.001. All variance components have been mulitplied by lo4 for convenience.Four-pair lines 4.47 5.54**
Subset of five traits
Subset of three traits
Four-pair lines 6.40 9.75***
156 and 48 total families for lines of one, four and 16 pairs and the control, respec- tively. Five female offspring from each family were killed with cyanide and were pinned with their parents; three of these were measured to obtain estimates of genetic com- ponents of variance for the morphological traits. All traits were transformed to natural logarithms before analysis.
RESULTS
Variance components among lines were estimated by one-way analyses of variance of individual morphometric traits by setting observed mean squares equal to their expected values (SOKAL and ROHLF 1969). These variance com- ponents were then used to test if observed differentiation among bottleneck lines of size N could be accounted for by drift using the variance ratio test distributed as Fisher’s F proposed by LANDE (1977), N - S i / S & , where S z is the among-line variance component from the analysis of variance, and S & is the additive genetic variance for the trait in the base population. These results, averaged over all eight traits in Table 1, indicated significantly more differ- entiation among lines for all bottleneck sizes than could be accounted for by drift. These averages were computed separately for the two suites of traits identified by BRYANT, MCCOMMAS and COMBS (1986); the suite of three traits largely independent of body size showed the greatest degree of differentiation among lines, whereas the suite of five traits was significantly greater than expected by drift for the four-pair and 16-pair lines, but not for the single- pair lines (Table 1).
1216 E. H. BRYANT, L. M. COMBS AND S. A. MCCOMMAS
solely on additive genetic variation; furthermore, different levels of nonaddi- tivity may be differentially affecting the two separate suites of traits. Alterna- tive explanations in addition to nonadditive (intralocus and interlocus) effects are also possible. One is that the bottleneck sizes were smaller than intended. Our design using single pairs to initiate bottleneck lines ensured that the intended number of mating pairs was achieved, but the number of offspring varied among individual pairs so the effective size of four-pair and 16-pair bottleneck lines could have been lower. We counted the number of F 1 off- spring emanating from each pair and computed a variance-effective number (CROW and KIMURA 1970), Ne, as
N e = ( N
+
CV2)/(1+
CV'),where CV represents the coefficient of variation of offspring number among pairs within a bottleneck line. These variance-effective numbers were 7.37 and 29.9 1 averaged over the four-pair and 16-pair bottleneck lines, respectively; each represents over 90% of the indicated bottleneck size. T o reduce the variance ratios in Table 1 to a nonsignificant level, the bottleneck size would have to be nearly one-half of the intended size, which is unlikely. Another possibility is that the populations grew only slowly after the bottleneck, so drift occurred over several generations, instead of one. T h e lines recovered rapidly after the bottleneck, especially so for the four- and 16-pair lines, making this explanation also unlikely. In the 16-pair lines, for example, the lines would have had to remain as low as 16 pairs for six generations, an outcome that is inconsistent with our observations. Neither of these possibilities seems to pro- vide an adequate basis for explaining our results, and we turn our attention to models less simplistic than those based on additivity of genetic effects.
To investigate how nonadditive components of variance within the base population affect differentiation among lines, we expand upon two models of nonadditivity we previously used to explain changes in genetic variance within our bottleneck lines: the first incorporates dominance of allelic effects within loci affecting our traits, and the second incorporates multiplicative epistasis among loci.
Dominance model: With two alleles at one locus, the mean of a quantitative trait, X , is given by FALCONER (1981) as
where q is the frequency of the recessive allele, a is an arbitrarily assigned genotypic deviation from the midpoint between the trait values for the two homozygotes, and d represents dominance deviations from this linearity. As- suming complete dominance, d = a, for convenience, the trait mean becomes
x
= a[l-
2q']. (3)MORPHOMETRIC DIFFERENTIATION
1217
2 4
a
16B o t t l e n e c k s i z e
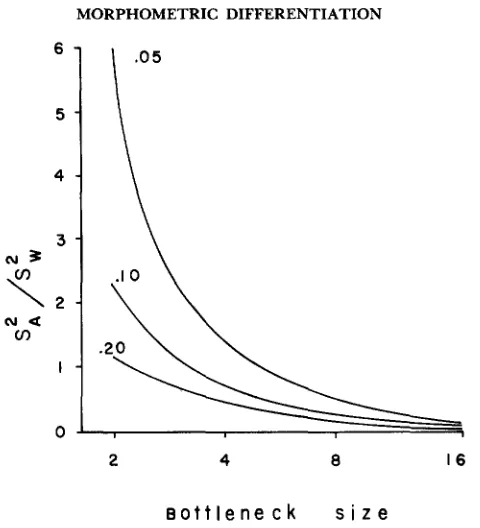
FIGURE 1 .-Ratio of variance among replicate bottleneck lines to additive genetic variance within the base population for the dominance model over a range of bottleneck sizes (abscissa) and over a range of equilibrium frequencies of a recessive allele in the base population (indicated on graph;
4
= 0.05, 0.10 and 0.20). Expectations for a purely additive model of genetic variation for comparison would be 1/N for bottleneck size of N .then be the variance among lines in their trait means (given an allele frequency) weighted by the binomial probabilities of occurrence for these frequencies. The variance among lines in trait means is thus
and
x
is the mean trait value over all lines;where
$
is the frequency of the recessive allele in the base population, and i / 2 N its frequency in a particular line.The ratio of the variance among lines to the initial additive genetic variance within the base population is given in Figure 1 for various values of the recessive allele in the base population. For completely additive affects of alleles
1218 E. H . BRYANT, L. M. COMBS A N D S. A . MCCOMMAS
X
0
I 2 4 8 16 3 2
B o t t l e n e c k s i z e
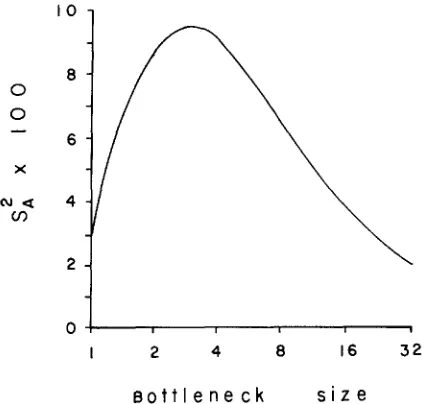
FIGURE 2.-Variance among bottleneck lines for the multiplicative epistasis model over a range of bottleneck sizes (abscissa).
line (see figure 4 in BRYANT, MCCOMMAS and COMBS 1986) as well as the genetic variance among lines (Figure 1) will increase above the level predicted by pure additivity of allelic affects. One possible explanation for our observed level of differentiation among lines could rest on recessive alleles in low fre- quency in the base population.
Epistasis model: We utilize the same model of multiplicative epistasis as in our companion paper. Assume that making one linkage group homozygous reduces fitness by 50%; making two such linkage groups homozygous reduces fitness by 75%, and so on. Also, assume that the number of linkage groups is six, the haploid number of chromosomes for this species [see BRYANT, MCCOMMAS and COMBS (1 986) for further explanation of equating the number of linkage groups to the haploid number of chromosomes]. T h e mean fitness of a population with homozygosity level F would then be
with variance among such lines
MORPHOMETRIC DIFFERENTIATION
N 3 m
' 1
\
/
1219
1
. ' \
~a 3 m
I
A D D I T l V l T Y2 4 8 16 3 2
B o t t I e n e c k s i z e
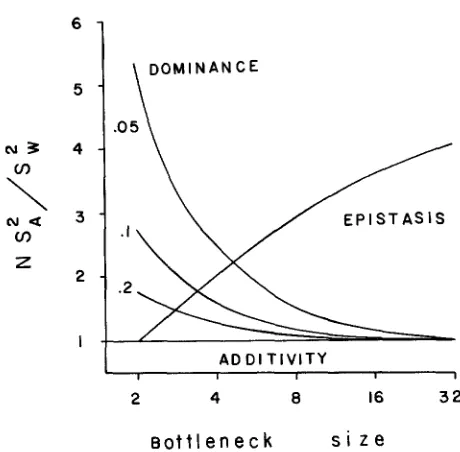
FIGURE 3.-Comparison of ratio of variance among bottleneck lines to that within lines for the three models of variance: complete dominance, multiplicative epistasis and additivity of genetic action. For all models the ratio of variances have been multiplied by N (bottleneck size) and then standardized so that the smallest ratio is set to 1.0 for each model; in this case the model of
additive gene action results in a ratio of 1.0, regardless of bottleneck size.
variance among lines in the epistasis model occurs for intermediate bottleneck sizes.
T o see how the results of the two models fit our data we can scale variances among lines for both models (as well as those based on additivity) by the variance ratio, as before, of N - S z / S & . It would be impossible to know the exact values for these variance ratios, because they depend either on an unknown frequency of recessive alleles or on an unknown homozygosity in the base population, so we standardize these variance ratios in Figure 3 to the lowest value among bottleneck lines of different size within a model (i.e., the lowest value of variance is set to 1.0 within a particular model). In doing so, the model of additive effects yields an expectation for among-line variances of 1 .O, regardless of bottleneck size. T h e pattern of variances among lines differs with the two nonadditive models, however. T h e model of complete dominance yields the greatest variance ratios for the smaller bottleneck sizes, whereas the epistasis model yields the greatest variance ratios for the largest bottleneck sizes.
1220 E. H. BRYANT, L. M. COMBS AND S. A. MCCOMMAS
among lines with increasing bottleneck size, implicating epistasis in addition to dominance. On the other hand, the pattern of variance ratios among the bottleneck sizes for the three traits shows no clear-cut trend, and all bottleneck sizes exhibit nearly the same level of differentiation among lines. In comparing observed additive genetic variances for these traits within bottleneck lines, we previously concluded (BRYANT, MCCOMMAS and COMBS 1986) that the suite of three traits independent of body size was influenced more by changes in fre- quencies of recessive alleles in the base population as a result of the bottlenecks, but that the suite of five traits associated with body size was further influenced by epistatic effects among loci. T h e results here for variance among lines seem to corroborate these conclusions, although they are less clear for the three- trait suite than for the five-trait suite (i.e., the pattern of variance ratios does not seem to clearly follow either model).
DISCUSSION
Models of genetic differentiation among populations through drift assume additivity of genetic effects, both within as well as among loci (HILL 1972;
LANDE 1980). Under this assumption, additive genetic variation within a pop- ulation will be converted into variation among derived populations at a rate of 2F VA per generation, where VA is the additive genetic variation present in the base population, and F is the rate of inbreeding per generation (which is 1/2N for random mating populations of size N). Ultimately, the maximal var- iance among lines as F approaches 1 .0 (complete homozygosity within derived lines) will be twice that of the additive genetic variance in the base population (FALCONER 1981). T h e process is one of steady conversion of the additive genetic variation present in the base population into variation among descen- dent lines, so variation within lines declines as variation among lines increases. When variation in the base population is based on nonadditivity of genetic effects, this process is altered in substantive ways. In the first place, a bottle- neck can generate variation among lines without expense to variation within such lines. In the second place, the variation generated among replicated bot- tleneck lines can be much greater relative to the base population than expected under an additive model. This is due to sampling effects of the bottleneck per se and not to diversifying selection among lines occurring after the bottleneck. Significantly higher levels of differentiation among lines than predicted by drift on additive genes during a bottleneck (LANDE 1977) may implicate such post- bottleneck selection where none exists.
MORPHOMETRIC DIFFERENTIATION 1221
In comparing our pattern of differentiation among lines of different bottle- neck sizes (Table 1; last column) the 16-pair lines exhibited the greatest sig- nificance, and this was especially true for the suite of five traits associated with body size. This is consistent with the model of multiplicative epistasis (Figure 3). In addition, for electrophoretic variation in these same bottleneck lines (MCCOMMAS and BRYANT, unpublished results), we found that the 16-pair lines deviated the most from expectation of among-line variance based on neutral, additive effects. We concluded from these data that moderate bottleneck sizes allow an interplay of drift and (intralocus and interlocus) selection. If we stand- ardize the variation among lines in Table 1 in the same way we scaled the variation based on the three models in Figure 3 (i.e., scale the lowest value of
N - S : / S k to l.O), it is the 16-pair lines that are the most deviant. In other
words, if variation among the 16-pair lines were less, the suite of five traits would more nearly fit the model of multiplicative epistasis, whereas the suite of three traits would more nearly fit the model of dominance. T h e results from the models do not include selection occurring after the bottleneck, but only the direct effects of the bottleneck per se. We feel that selection could be differentiating the 16-pair lines to a much greater extent than either the four- pair or single-pair lines. That is, selection may be most effective in intermediate bottleneck sizes where disruption of the equilibrium genetic relationships has occurred, but not so much as to substantially reduce genetic variation within such lines (e.g., CHARLESWORTH and SMITH 1982).
T h e primary impetus for evolutionary biologists to study bottlenecks is their putative effects on the speciation process. Do bottlenecks serve to increase differentiation among populations and promote speciation? If they serve only to redistribute neutral additive variance within populations to variance among populations as predicted by models of additive gene action, they are of little interest in an evolutionary context almost by definition, particularly with re- spect to speciation. It is variation associated with fitness or its components that would be the most interesting, and it is precisely this variation that would be expected to involve epistasis (e.g., DOBZHANSKY 1946, 1955; CHARLESWORTH
and CHARLESWORTH 1973; ROSE and CHARLESWORTH 1980). More generally
WRIGHT (1969) has noted that, if there were an intermediate optimum for a phenotypic trait, one would expect epistasis for fitness. An interaction between genetic drift and multilocus epistasis provides the cornerstone of WRIGHT’S shifting balance theory of speciation (WRIGHT 1932, 1940) and the founder- flush theories of speciation of CARSON (1 97 1, 1982) and TEMPLETON (1 980a,b). Yet the evaluation of bottlenecks, whether it be from a theoretical or from an empirical perspective has been based primarily on additive gene action that is selectively neutral (e.g., NEI, MARUYAMA and CHAKRABORTY 1975; MARUYAMA and FUERST 1984, 1985; RICH et al. 1984). Clearly, more attention should be given to models of bottlenecks involving different kinds of selection, particu- larly those incorporating nonadditive gene action (e.g., see SLATKIN 198 1 ;
WADE and MCCAULEY 1984).
1222 E. H . BRYANT, L. M. COMBS A N D S. A. MCCOMMAS
measuring these flies and especially thank TREVOR PRICE, GERARD WELLINGTON and an anonymous reviewer for their comments and suggestions that led to extensive revisions of this manuscript.
LITERATURE CITED BRYANT, E. H., 1969
1049- 1069.
BRYANT, E. H., 1977
T h e fates of immatures in mixtures of two housefly strains. Ecology 50:
Morphometric adaptation of the housefly, Musca domesticu L., in the United
T h e effect of an experimental bottle- States. Evolution 31: 580-596.
BRYANT, E. H., S. A. MCCOMMAS and L. M. COMBS, 1986
neck upon quantitative genetic variation in the housefly. Genetics 114: 1191-1211.
CARSON, H. L., 1971
CARSON, H. L., 1982
Speciation and the founder principle. Stadler Genet. Symp. 3: 51-70.
Speciation as a major reorganization of polygenic balances. pp. 411-433. In: Mechanisms of Speciation, Edited by C. BARIGOZZI. Alan R. Liss, New York.
systems. Genet. Res. 21: 167-183.
CHARLESWORTH, B. and D. B. SMITH, 1982 Genet. Res. 39: 227-236.
CROW, J. F. and M. KIMURA, 1970
DOBZHANSKY, TH., 1946
CHARLESWORTH, B. and D. CHARLESWORTH, 1973 Selection for inversions in multilocus genetic
A computer model of speciation by founder effects.
An Introduction to Population Genetics Theory. Harper & Row,
Genetics of natural populations. XIII. Recombination and variability in
A review of some fundamental concepts and problems of population New York.
populations of D. pseudoobscura. Genetics 31: 269-290.
genetics. Cold Spring Harbor Symp. Quant. Biol. 20: 1-15. DOBZHANSKY, TH., 1955
FALCONER, R. A., 1981
FRANKLIN, I. R., 1977
Introduction t o Quantitative Genetics, Ed. 2. Longman, New York. T h e distribution of the proportion of the genome which is homozygous by descent in inbred individuals. Theor. Pop. Biol. 11: 60-80.
HILL, W. G., 1972 Estimation of genetic change. I. General theory and design of control popu-
Statistical tests for natural selection on quantitative characters. Evolution 31:
Genetic variation and phenotypic evolution during allopatric speciation. Am. lations. Anim. Breed. Abstr. 40: 1-15.
LANDE, R., 1977 442-444.
LANDE, R., 1980 Nat. 116: 463-479.
MARUYAMA, T. and P. A. FUERST, 1984 Population bottlenecks and nonequilibrium models in population genetics. I. Allele number when populations evolve from zero variability. Genetics 108: 745-763.
Population bottlenecks and nonequilibrium models in population genetics. 11. Number of alleles in a small population that was formed by a recent bottleneck. Genetics 11 1: 675-689.
T h e bottleneck effect and genotypic vari-
An experimental study of genetic
T h e effect of inbreeding on the variation due to recessive genes. Genetics
A test of evolutionary theories of senescence. Nature MARUYAMA, T. and P. A. FUERST, 1985
NEI, M., T . MARUYAMA and R. CHAKRABORTY, 1975 ability in populations. Evolution 29: 1-10.
drift for two quantitative traits in Tribolium. J. Hered. 75: 191-195.
ROBERTSON, A., 1952 37: 189-207.
RICH, S. S., A. E. BELL, D. A. MILES and S. P. WILSON, 1984
MORPHOMETRIC DIFFERENTIATION 1223
SLATKIN, M., 1981
SOKAL, R. R. and F. J. ROHLF, 1969 Biometry. W. H. Freeman, San Francisco.
SULLIVAN, R. L. and R. R. SOKAL, 1963 housefly. Ecology 4 4 120-1 30.
1038.
Populational heritability. Evolution 35: 859-87 1.
The effect of larval density on several strains of the
The theory of speciation via the founder principle. Genetics 94: 101 1-
Modes of speciation and inferences based upon genetic distances.
WADE, M. J. and D. E. MCCAULEY, 1984 Group selection: the interaction of local deme size and
WRIGHT, S., 1932 The roles of mutation, inbreeding, crossbreeding, and selection in evolution.
WRIGHT, S., 1940 Breeding structure of populations in relation to speciation. Am. Nat. 7 4 232-
WRIGHT, S., 1969 Evolution and the Genetics ofPoflulations, Vol. 2. University of Chicago Press, Chicago.
Communicating editor: J. R. POWELL TEMPLETON, A. R., 1980a
TEMPLETON, A. R., 1980b Evolution 3 4 719-729.
migration in the differentiation of small populations. Evolution 38: 1047-1058.
Proc. 6th Int. Congr. Genet. I: 356-366.