FATE MAPPING MULTI-FOCUS PHENOTYPES
JONATHAN ARNOLD1
Department of Statistics, Y a k Uniuersity, 2179 Yale Station, N e w Hauen, CT 06520
DOUGLAS R. KANKEL
Departmeni of Biology, Yale Uniuersity, Box 6666,260 W h i t n e y Aue., New Hauen, CT 06511
Manuscript received June 3, 1981 Revised copy received August 10, 1981
ABSTRACT
A central assumption used in the genetic fate mapping of anatomical sites responsible for certain mutationally induced abnormalities is that a single pair of bilaterally symmetric sites on the blastoderm gives rise to structures that control the expression of that abnormality. We report a new model that is not so constrained and test its efficacy in the analysis of several mutations that in- duce behavioral abnormalities.
H E problem to be considered in this paper is the localization of anatomical Tdomains respmsible for complex behavioral or developmental phenotypes associated with the presence of various mutations in Drosophila melunogaster. W e will focus exclusively on the use of gynandromorphs to address this problem. The work in this area was pioneered by STURTEVANT (1929) and GARCIA-BELLIDO and MERRIAM (1969) and more recently, techniques have been developed to map relatively complex phenotypes to a pair of bilaterally symmetric foci defined on the surface of the cellular blastoderm (HOTTA and BENZER 1973; MERRIAM and LANGE 1974; FLANAGAN 1977). A new procedure is reported here to map pheno- types controlled by two or more pairs of foci. This procedure allows one to estimate how many pairs of foci must be postulated to fit the data and further to examine how these foci interact to determine the phenotype of interest.
THE MODEL
Assumption 1 : Half the blastoderm is covered by male cells ( X / O ) . The covering is convex.
A number of methods exist to generate relatively large numbers of gynandro- morphs (see review by
HALL,
GELBART and KANKEL 1976), but the procedure developed here concerns itself only with those methods yielding half-male, half- female mosaics. The procedure also assumes that both male and female clones occupy essentially contiguous regions, ZALOKAR, ERK and SANTAMARIA (1980)1 C u i i e n t addiess: Rutgers Statishcs Dept , Hill Center. Busch Campus, Rutgers Univ , New Brunswick, NJ 08903.
212 J . ARNOLD A N D D. R. K A N K E L
directly monitored the distribution of male cells over the blastcderm. More than one patch of male cells occasionally occur, but the bulk of male cells seems to be confined to a single connected patch. The bonndary between male and female cells tends to be quite irregular.
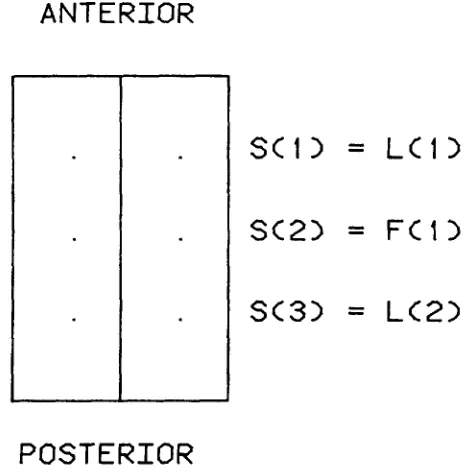
Assumption 2: All site-pairs are symmetrically arranged about the midline. Each landmark autonomously determines a mosaic’s adult phenotype. There are F pairs of foci determining the fate of the behavioral phenotype. When
k
(defined as the threshold) or more foci are covered by male cells, then the mosaic exhibits the mutant phenotype.S site pairs are arranged along the blastoderm, and the members of each pair are symmetrically situated about the midline. The site pairs 1,
.
.
.
,
S are ordered by their position along the anterior-posterior axis of the blastoderm (Figure I ) . Some site pairs are called landmarks, and others, foci. Landmarks on the blasto- derm give rise to pairs of anatomical features in the adult mosaic, such as right and left posterior scutellar bristles; foci are hypothetical sites on the blastoderm determining the fete (presence or abcence) of the mutant phenotype. The L landmarks and F f,oci take a position in the ordering 1..
. .
,
S of S (= L+
F ) site pairs along the blastoderm. Site pairs in positions x ( l ) ,.
. .
, h ( L ) are landmarks, and site pairs in positions+
(1 ),. . . ,
+
( F ) are focal pairs.A chromosome, designated X ( r ) , is found in all cells and carries recessive marker(s) for each landmark. When male cells cover a landmark, the adult feature derived from i t is male and marked by the recessive marker (s)
.
Similarly, when a given numberk,
1 5k
5 2F, or more of the foci are (not) covered by male cells,ANTERIOR
1
s<1>
=
LC1>
SC2>
=
FC1>
s<3>
=
L<2>
POSTERIOR
MULTI-FOCUS PHENOTYPES 21 3 then the mosaic is (not) fated to exhibit the mutant phenotype. In the extreme cases in which the phenotype's threshoZd
(k)
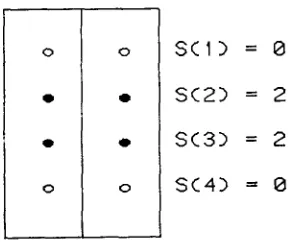
is 1 o r 2F, i.e., equal to the total number of foci, the model herein is domineering o r submissive, respectively.Different configurations of the blastoderm are displayed in Figure 2. A con- figuration is the total genotype of the mosaic and is specified once the number (e.g., 0, 1 or 2) of sites covered by male cells in each site pair is known. Configu- rations 1 , 2 , 3 and 4 have 6 , 3 , 3 and 1 site( s) covered, respectively. Configurations
are the aggregate of one or more covering events, which are not distinguished by the model. For each configuration in Figure 2, the simpler events that yield the blastoderm configuration are presented. A blastoderm configuration is then coded by a sequence S of length S: (i) if both sites of site pair
i
are covered, then the count S ( i ) is 2; (ii) if one site of site pairi
is covered, then the countS ( i )
is 1; or (iii) if neither site of site pairi
is covered, then the count S ( i ) is 0. The blastoderm configuration is then the list of counts S = [ S ( S ) ..
. . ,
S ( I ) ]*.
Similarly a landmark score is the landmark phenotype of the mosaic and is specified once the numbers of sides for each landmark covered by male cells are known. A landmark score can be coded by a sequence L of length
L:
(i) if both sites of landmark h ( i ) are covered, then the right and left sides of the mosaic's structure are male, and the count L [h(i)
] is 2; (ii) if one site of landmark h ( i ) is covered, then the right or left side of the mosaic's structure is male, and the count L [A(i)
] is 1 : or (iii) if neither site of landmark h(i)
is covered, then neither side of the mosaic's structure is male, and the L [ h ( i ) ] is 0. The landmark score of a mosaic is then the list of counts L = {L[h(L)],.
. . .
L[h(l)]}*. Similarly the countsF = {F[+(F)],.
.
.
,F[+(l)]}code thenumbersofeachfocalpaircovered by male cells. If there are three site pairs on the bastoderm ( S = 3 ) , all blasto-NUMBER
f
CODE
s = s < 3 > s < 2 > SC1)
2 2 2
3
4
@ l Z
FIGURE &.-Some blastoderm configurations and their codes.
214 J . A R N O L D A N D D. R . K A N K E L
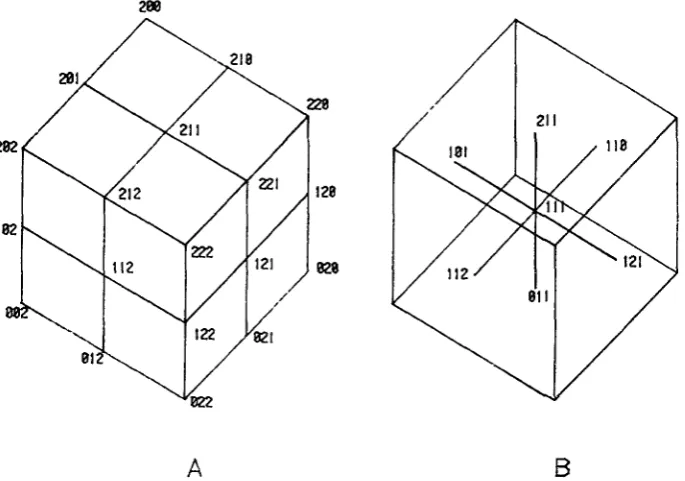
derm configurations can be enumerated by counting in base 3 from 0 to 222.
A s s u m p t i o n 3 : Noncontiguous configurations have zero probability of occurrence.
The blastoderm configurations can be identified with points in a three-sided lattice (Figure 3 ) . Some configurations are highly unlikely. They would require either multiple patches of male cells on the blastoderm or a nonconvex cover, con- trary to Assumption 1. Two site pairs in a configuration are coordinated if there is at least one site from each of common gender. Coordinated site pairs in a con- figuration are required to be contiguous. For example, all configurations in Figure 2 are contiguous; Figure 4 displays a noncontiguous configuration. A noncontigu- ous configuration in this case has a code that contains a 2 surrounded by numbers l e s than 2 ,or a 0 scrrounded by numbers greater than 0.
There are three types of contiguity requirements on blastoderm configura- tions. (i) There can be no contiguity requirement. (ii) A configuration can be required to be locally contiguous, A locally contiguous configuration has a code S in which there are no 2’s surrounded by numbers less than 2 or 0’s surrounded by numbers greater than 0. (iii) A configuration can be required to be gZobalZy contiguous. In this case all runs of 0’s. 1’s and 2’s in the sequence S are replaced by a single 0, 1 o r 2, and the resulting shortened sequence without runs is re- quired to be locally contiguous. Checking global contiguity of a configuration is equivalent to determining whether or nat a configuration code shortens to one
0 01 010 012 02 10 of 12 codes below:
2 21 212 210 20 12
288
A
B
MULTI-FOCUS PHENOTYPES 21 5
sc1>
= 2se21
= 0S ( 3 1 = 2
0
sc1>
= 20 0
se21
= 00 S ( 3 1 = 2
FIGURE 4.--Noncontiguous configuration.
I n Figure 5 there is an example of a blastoderm configuration that is locally contiguous, but is not globally contiguous. The model assumes no contiguity, local contiguity or global contiguity in Assumption 3. For example, if the model makes a global contiguity assumption in Assumption 3, then all globally noncontiguous configurations have zera probability. Global contiguity implies local Contiguity, and they are equivalent as long as there are three or fewer site pairs. With only two site pairs, all three contiguity assumptions are equivalent.
Assumption 3 can be viewed as a consequence of Assumption 1 and is sug- gested in the single focal-pair model of HOTTA and BENZER (1973, p. 150, caption of Figure IO). Assumption 3 is empty if there is no contiguity requirement. The model and the program implementing the fitting of the model allow a choice of contiguity assumptions. A number of other notions of contiguity need considera- tion, and ultimately, the mosaic data themselves will select the correct notion of contiguity.
Assumption
4:
Two blastoderm configurations S and S’, equivalent under reflection R, are equiprobable.Some pairs of configurations are equiprobable. If half the blastoderm is covered and site pairs are symmetrically located about the midline, the configuration(s) in the lattice (Figure 3 ) that are equivalent under a reflection through the lattice center are equiprobable. Letting 1 = (1,
.
.
S times.
.
,
1 ) be the center of the lattice, define the reflection R (S) = 1 - (S - 1) of S through the center 1. Twose1>
= 0sc21
= 2se31 = 2
s e 4 1 = 0
;I
;I
216 J. ARNOLD A N D D. R. KANKEL
configurations S and S’ are equivalent under reflection R if and only if S’ = R (S)
.
The reflection changes 2 (0) to 0 (2) in a configuration code and leaves 1 unchanged.Assumption 4 is employed in the single focal-pair models of HOTTA and BENZER (1973).
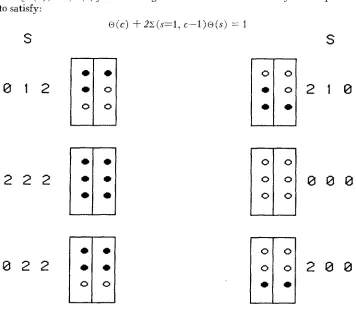
Some equivalent configurations are displayed in Figure 6. The configuration 1 is its own symmetry partner, and all other configurations have one symmetry partner. By enumerating the configuration 0 = (0,
.
.
S times.
.
,
0) up to 1, the remaining con€igurations can be obtained by reflection R. If a configuration S is noncontiguous, then its reflection R ( S ) is also noncontiguous.The parameters in the model, as defined by the numbers of landmarks and foci, their positions on the blastoderm, the phenotype’s threshold, the landmarks entered i n the model and the contiguity assumption, are the nonzero probabilities of contiguous configurations with codes from 0 to 1. Letting s denote the base-IO code of a configuration S, then the probability of a configuration S is @ (s)
.
For example, if c is the base-10 code of the center configuration 1, then the proba- bility of the center configuration c iso
( c ).
The list of configuration probabilitieso
=[ ~ ( o ) ,
.
. .
,
~ ( c ) ] are nonnegative and are constrained by Assumption4
to satisfy:
S
0 1 2
2 2 2
0 2 2
0
o(c) + 2 z ( s = l , c - l ) o ( s ) = 1
S
F
l
0
0
0
ri ri
2
8
0
0 0
e
*
MULTI-FOCUS PHENOTYPES 21 7
The nunibers of nonzero configuration probabilities or parameters under the global contiguity assumption with varying numbers of site pairs S are tabled:
S 1 2 3 4 5
Parameters 2 5 10 17 26
Each mosaic is scored for the presence or absence of the mutant phenotype and the number of inale sides for each landmark, yielding the landmark score L. A score can also be g h e n a base-10 code,
i.
If the adult fly had a blastoderm configu- ration s, then the 0-1 indicator c(s,i )
of the blastoderm configuration having been contiguous and having landmark phenotype j is:c(s, j ) = 1, S contiguous, S[k(i)] = L[k(i)], i = 1 , .
.
.
,
L = 0. otherwiseFor the mosaic to express the mutant phenotype,
k
or more foci on the blasto- derm need to be covered. The fate f (s) of a mosaic as determined by its blastoderm configuration s is:f(s) = l , Z ( i = l , F ) F [ + ( i ) ] 2
k
= O,Z(i=l, F ) F [ + ( i ) ]<
k
.
The probability of the observed phenotype and landmark score is the sum of the probabilities of contiguous configurations that have the landmark pheno- type and fate the adult mosaic to have the observed phenotype. Letting the normal fate
f(s>
= 1-
f ( s ) , the outcome of a n experiment yielding a mosaic with previous Configuration S is: (i) normal phenotype and landmark score L = {L[k(L)],.
. .
,
L [ k ( l ) ] } with probabilityW O ,
i
I
0 ) = Z ( s > [@(s)c(s.i>f(s>l
;(ii) or mutant phenotype and landmark score L = {L[X(L)],
. . . ,
L[X(l)]} with probabilityP ( l , j
I
0 ) = z ( s ) [@(s)c(s,i>f(s)l
.
After N mosaics are generated and scored for the mutant phenotype and land- marks, the data are recorded in a contigency table N =
[ N (
i,
j ) ] according to the absence or presence (i = 0 o r 1) of the mutant phenotype and by landmark score L, whose base-10 code isi.
When a fixed number of mosaics are independently generated, then tlie density of the table of counts given the model, namelyP (N
I
O ),
is multinomial and proportional to:P(N
1
0 ) En(i,
i )
[ P ( i ,
jI
0 ) ] ~ ( ~ 7 i ) (1)218 J. A R N O L D A N D D. R. K A N K E L
M A T E R I A L S A N D N E T H O D S
Three global+ phenotypes are analyzed in the context of multi-focus models: (i) the temperature-sensitive paralytic mutant comatose (com, EIDDIQI and BENZER 1976) ; (ii) a com- ponent of female mating behavior, namely female receptivity; and (iii) a new X-linked mutant currently and temporarily designated CBI, isolated by H. LIPSHITZ on the basis of abnormalities in visual pattern preferences (unpublished findings).
(i) comatose: Canton-Special (C-S) strains of D. m:Zanogaster containing the original c o n
allele were obtained from the laboratory of SEYMOUR BENZER. Males hemizygous for yellow ( y ) and com were mated to females homozygous for com+ and homozygous for claret-nnndis- junctional (CL@) on chromosome 3 . Females additionally carried the dominant mutation Stubble
( S b ) on one chromosome 3 . This particular stock of C& produces many more progeny than
most C& stocks with no apparent drop in the frequency of mosaics produced (D. KANKEL, un-
published observation). Of the 226 mosaics resulting from this cross, 101 carried Sb and 125 Sb+. Fate maps were constructed szparately for the Sb and Sb+ mosaics and did not differ signifi- cantly.
The 226 gynandromorphs were raised and maintained at 25', and each mosaic was scored for paralytic behavior by continuously observing individual flies that had been placed in a specially constructed chamber whose temperature had been raised to and maintained at 38". Two major features of each fly's behavior were recorded after 2 min at the elevated temperature: First, it was noted whether or not the fly had "collapsed", i.e., was no longer capable of standing even when raised to its feet with the aid of a small brush. Second, the relative intensity of move- ment of each of the fly's six legs was scored on a categorical scale as 0. 1, 2, 3, 4 or 5, where 0 represents no movement and 5 rather rapid and continuous movement. This scale was developed by observing wild-type and com individuals under similar circumstances. The legs of wild-type individuals are almost invariably scored as 4 or 5 and those of com individuals as 0, although occasionally as 1 o r 2. For the purpose of classifying leg movement as male/female, a score of
0 o r 1 was considered male; 4 or 5 , female; and 2 or 3, mixed. The landmark scores and be- havioral phenotypes (Table l) of each mosaic were placed on a score sheet as in STURTEVANT (1929, Figure 3 ) and transferred via computer coding sheets and cards to a file on the computer's direct access storage medium. Mosaics with unscored structures or behaviors were not analyzed, and mixed scores were randomized to 0 (site female) or 1 (site male). Table 2 is a summary of the analysis f o r the comatose collapse phenotype.
(ii) Female receptiuity: The second phenotype to be analyzed is a component of female courtship, female receptivity. Female courtship behavior was observed in mosaics from crosses to be described by HARRIS, who has kindly provided us with the mosaic data. Females heterozy- gous for the ring-X chromosome In(l)W("C) were mated to males hemizygous for y w sns, and mosaics were selected for the presence of female genitalia. The 140 mosaics resulting from these crosses were scored for the female receptivity phenotype and landmarks (Table 1). The data on each mosaic were coded and transcribed to a computer file as with the c3matosz data.
(iii) Pattern preferences behvlaior of CB8: The last phenotype is the pattern-preference be- havior of the mutant CB8, isolated and characterized by H. LIPSHITZ, who has kindly provided us with unpublished data. Mosaics were generated by loss of the unstable ring-X chromosome I n ( l ) 2 0 ~ v c ) from females of the genotyp:: I n j l ) 7 ' ( u c ) / y cho CBI sn3;i/CyO. The presence of the dominant marker Cy prevents the mosaic from flying; this is necessary in order to score the behavior, which was done using an apparatus similar to that described by WEHNER (1972).
(iv) Computer programs: Two computer programs have been written to support the model described. The first program (MAXLE) fits the model. The second program (MAPPNG) pro- rides a graphical representation of the relationship between landmarks and foci as found by MAXLE. MAPPNG is an implementation of the multi-dimensional scaling algorithm used by FLANAGAN (1976) to aid in the drawing of genetic fate maps; the core of MAPPNG is based on an unpublished program provided to one of us (DRK) by J. FLANAGAN a number of years ago. The current program is substantially different, however, and any errors are apt to be ours.
MULTI-FOCUS PHENOTYPES
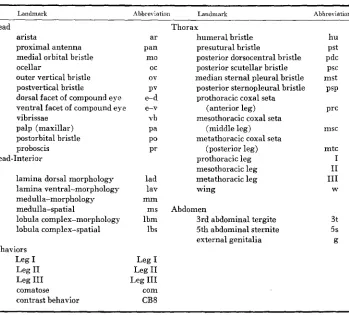
TABLE 1
Landmarks and behmiors used in mosaic experiments
21 9
Landmark Abbre\ iation Landmark Abbreviation
Head arista
proximal antenna medial orbital bristle ocellar
outer vertical bristle postvertical bristle
dorsal facet of compound eye ventral facet of compound eye vibrissae
palp (maxillar) postorbital bristle proboscis Head-Interior
lamina dorsal morphology lamina ventral-morphology medulla-morphology medulla-spatial lobula complex-morphology lobula complex-spatial Behaviors Leg I
Leg I1
Leg I11
comatose contrast behavior ar Pan mo oc ov PV e-d e-v vb P O pa pr lad lav m m ms lbm lbs
Leg I
Leg I1
Leg I11
com CB8
Thorax
humeral bristle presutural bristle
posterior dorsocentral bristle posterior scutellar bristle median sternal pleural bristle posterior sternopleural bristle prothoracic coxal seta
(anterior leg) mesothoracic coxal seta
(middle leg) metathoracic coxal seta
(posterior leg) prothoracic leg mesothoracic leg metathoracic leg wing Abdomen
3rd abdominal tergite 5th abdominal sternite external genitalia hu PSt pdc PSC mst PSP Prc msc mtc I I1 I11 W 3t 5s g
The abbreviation of landmarks follow co8nventions set i n GARCIA-BELLIDO and J. R. MERRIAM (1969, Table 1, p. 63) and in KANKEL and HALL (1976, Table 1, p. 6). Landmarks are ordered by their position along the blastoderm (anterior to posterior).
All programming has been done i n Fortran-IV, using a compiler for the Digital Equipment
Corp. (DEC) RT-11 operating system running on a DEC PDP-I1/34A processor. A number of the subroutines used in the MAXLE and MAPPING programs are specific to the RT-11 operat- ing system; these are clearly marked as such in the program listing and are almost invariably associated with the manipulation of data files. MAPPNG contains code that is specific for the display of a map on Tektronix 4010 series graphics terminals or devices that emulate them; MAPPNG also contains a routine that can plot on a line printer or printing terminal.
Both programs have been designed to run in an interactive mode, although, with simple modifications, either could r u n on a batch-oriented computer system. Such an attempt, how- ever, would likely make it very difficult to obtain full use of MAXLE.
ANALYSIS AND RESULTS
220 J. A R N O L D A N D D. R. KANKEI,
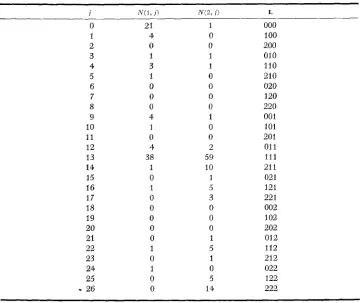
TABLE 2
Mosaic data' on comatose?
~~ ~
I i?-(l, 1 ) iV(0, 1 )
0 21 1
1 4 0
2 0 0
3 1 1
4 3 1
5 1 0
6 0 0
7 0 0
8 0 0
9 4 1
10 1 0
11 0 0
12 4 2
13 38 59
14 1 10
15 0 1
16 1 3
17 0 3
18 0 0
19 0 0
20 0 0
21 0 1
22 1 5
23 0 1
24 1 0
25 0 5
-
26 0 14L 000 100 200 010 110 210 020 120 220 001 101 201 01 1
111 21 1 021 121 22 1 002 102 202 012 1 le 218 022 122 222
* The landmarks and their order along the blastoderm in Table 2 are Leg I-Leg II-Leg 111.
Jr As Fointed out in the text, only those cases with complete data were used in any particular analysis. Thus, of the 226 gynandromorphs available, only 191 were used for these particular landmarks.
found, the null hypothesis is assessed for goodness-of-fit by the Pearson
'
x
statistic.[6(0),
.
. .
,
6 ( c ) ] of a multi-focus model can be iteratively computed by the EM algorithm, as in HABERMAN (1977, p. 1143) and more generally in DEMPSTER, LAIRD and RUBIN (1977). T h e algo- rithm has the advantages of easy programmability, quick convergence for this model specification. numerical stability and yielding closed-form expressions for the maximum lilrelihood estimates. Its application to other frequency table models (HABERMAN 1974, p. 73) also suggests a gain i n computational efficiency when large numbers of parameters are involved, as is the case i n a multi-focus model). If the blastoderm has a contiguous configuration. s, and if the whole blasto- derm configuration s were observable in a developing mosaic, then configuration scould be seen N * (s) times in a n N-mosaic experiment. The counts
N*
= [ N * ( s ) ]MULTI-FOCUS PHENOTYPES 22 1
would be multi-nomial with configuration probabilities { (s) } and sample size N . The maximum likelihood estimates
6
could then be computedby:
(NI step)
6
(s) ={ N *
($1
+
N * [ ~ ( s )1
} / 2 ~ , s # c (2)= [ N * ( s ) ] / N , s = c
.
In fact, the counts of mosaic configurations N* are not observed, but their ex- pected values { E ( N * (s)
[
N, @)}, conditional on the table of landmark scores by behaviorNS=
[ N ( i , j ) ] and the model 0 , can be computed from the model specification (1) via:( 3 )
w N r m ;
i ( s ) i
(E step) E [ N * (s)
1
N,
01
=In ( 3 ) , configurations hasfatef(s) andlandmarkscorej(s).
The EM algorithm ‘estimates’ the unobserved table of mosaic counts N* via the E step (3) from provisional estimates
6
and the observed table (Table 2) and then recomputes the provisional estimates of the configuration prpbability estimates6
via the M step ( 2 ) from the “estimated table” {[ N *
(s)1
N,a]}.
These two steps can be combined to give a difference equation converging to solutions of the likelihood equation (HABERMAN 1977, Theorem 4, p. 1143).
P [ f ( s ) , j ( s )
Io1
By
solving these difference equations, the maximum likelihood estimates 0 of a model are obtained. In general. there will be multiple solutions to these differ- ence equations corresponding to multiple peaks in the likelihood surfaceL(N
I
e ) ,
the right hand side of equation ( I ) . For example, in the case of thesingle focal-pair models of
HOTTA
and BENZER (1973), there are four solutions to(4),
one of which is that ofHOTTA
andBENZER
(1973, p. 149) and another is the midline model, which yields the map distance estimates in KOANA andHOTTA
(1978, p. 128). These closed-form maximum likelihood estimates in the single focal-pair models were used to check the interactive computer program and their properties will be subject to careful study in another paper.
Estimates of the variance-covariance matrix for the maximum likelihood esti- mates can be obtained (CRAMER 1974, Section 32.7, p. 445, and Section 33.3, p.
500) from the Information Matrix [Z(ss’)
( e ) ]
= {-E[azlnP(NI
@)/a@(s)a@ (s’)] } computed from model specification (1) with the result:222 J. A R N O L D A N D D. R. KANKEL
I n addition to the basic data analysis performed in MATERIALS AND METHODS, the interactive computer program asks the user to describe the data t o be an- alyzed and then to choose a model by selecting the number of site pairs and foci, the order of site pairs along the blastoderm, the contiguity assumption, the phenotype’s threshold and other features. With the model selected, the pro- gram fits the model as in
(4)
and ( 5 ) and graphically displays the model’s foci and landmarks in a fate map, using the multi-dimensional scaling procedure ofFLANAGAN (1 976).
Models
o
and O’ with different assumptions and fitted to the same table of mo- saic counts N (i.e., Table 1A) can be compared by their likelihood ratio L(N1
@)/ L(N
i
0 ) . The likelihood can guide the search for a reasonable model to serve as the null hypothesis.Having found a model, goodness-of-fit to the null hypothesis can be assessed in an absolute sense via the Pearson
x’
goodness-of-fit statistic:x z =
~ ( i ,
j){AT(i,
j ) - E [ N ( ~ ,i )
1
& I } Z / E [ N ( ~ ,i )
I
61
,
(6)with the convention that 0/0 = 0. Its degrees of freedom are (number of cells -1 - (number of distinct parameters - 1 ) o r simply the (number of cells) - (number of distinct parameters). In fitting the model with a number of be- havioral foci, a model is estimated for which a number of blastoderm configura- tions have the same fitted configuration probability
6.
These configurations contribute only one distinct parameter to the model.A well-understood complex behavior can provide a crucial test of the proposed family of models. Prior experiments may implicate the number of behavioral foci, their location and how they interrelate to control the behavior. The test is whether or not the fitted model from the current mosaic data predicts the number of foci, their locations and the phenotype’s threshold as found by other experiments. One relatively well-understood behavior is that of the temperature dependent ‘col- lapse’ of the mutant comatose.
The experiments of SIDDIQI and BENZER (1976) indicate that leg paralysis i n comatose is due to blockage in impulse propogation at one or more steps along ihe pathway from cervical nerve to leg muscle contraction. By scoring leg movements and by performing a genetic fate mapping, using only external landmarks, SID- DIQI and BENZER (1976) were able to define 3 pairs of sites on the blastoderm that mapped ventral to the ventral-most thoracic cuticular structures and were implicated in controlling leg muscle contraction in comatose. Each of the fly’s six legs was under the autonomous control of a single focus, and these sites were pre- sumably within the thoracic ganglion. More recently KANKEL and FITZGERALD
MULTI-FOCUS PHENOTYPES 223
three or more. I n the following analysis, no information concerning leg paralysis was provided to the program. The results of fitting a number of models appear in Tables 3 and 4.
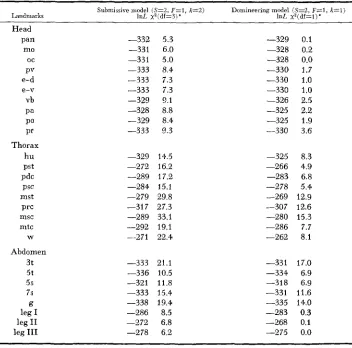
First, one asks whether or not existing models
(HOTTA
and BENZER 1973) are sufficient to explain the mosaic data N on the “collapse” behavior of comatose. The results of litting single focal-pair models (Table 3 ) lead us to reject the sub- missive mode in favor of the domineering model for all landmarks; however, thex
‘
goodness-of-€it tests lead us to reject the domineering model as well. There are only a few landmarks (leg I, leg 11, and leg 111 paralysis, and head structures) to which the existing models provide a reasonable fit. The inadequacy of models using only a single focal-pair to explain complex behaviors should not be unex- pected. For example, if one examines the goodness-of-fit of existing models to the mosaic data in KOANA andHOTTA
(1978, Table 1) on the flightless mutant pt0,TABLE 3
Rejection of Hotta-Benzer models for comatose
Submissive model (S=?, F = l , k=2) Domineering m d e l ( 8 ~ 2 . F = l , X = l )
Landmarks 1nL x 2 ( d f = 3 ) * 1nL x z ( d f = l ) *
Head
pan -332 5.3 -329 0.1
mo -331 6.0 -328 0.2
oc -331 5.0 -328 0.0
PV -333 8.4 -330 1.7
e-d -333 7.3 -330 1.0
e-v -333 7.3 -330 1.0
vb -329 9.1 -326 2.5
pa -328 8.8 -325 2.2
PO -329 8.4 -325 1.9
Pr -333 ” 3 -330 3.6
Thorax
hu -329 14.5 -325 8.3
Pst -272 16.2 -266 4.9
PdC -289 17.2 -283 6.8
PSC -284 15.1 -278 5.4
mst -279 29.8 -269 12.9
prc -317 27.3 -307 12.6
msc -289 33.1 -280 15.3
W -271 22.4 -262 8.1
mtc -292 19.1 -286 7.7
Abdomen
3t -333 21.1 -331 17.0
5t -336 10.5 -334 6.9
59 -321 11.8 -318 6.9
7s -333 15.4 -331 11.6
leg I -286 8.5 -283 0.3
leg XI -272 6.8 -268 0.1
g -338 19.4 -335 14.0
224 J . ARNOLD A N D D. R. K A N K E L
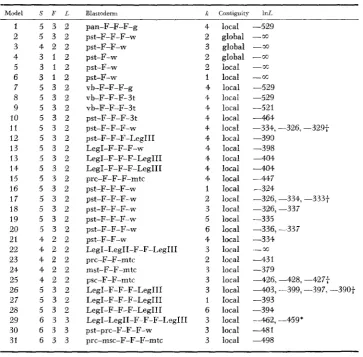
TABLE 4
Fitting multi-focus models to comatose data
~~~
Model S F L Blastoderm X Coniiguity InL
1 2 3 4 5 6 7 8 9 10 1 2 12 13 13 14 1 5 16 17 18 19 20 21 22 23 24 25 26 27 28 29 30 31
5 3 2
5 3 2
4 2 2
3 1 2
3 1 2
3 1 2
5 3 2
5 3 2
5 3 2
5 3 2
5 3 2
5 3 2
5 3 2
5 3 2
5 3 2 5 3 2 5 3 2
5 3 2
5 3 2 5 3 2
5 3 2
4 2 2
4 2 2
4 2 2
4 2 2 4 2 2
5 3 2
5 3 2
5 3 2
6 3 3
6 3 3 6 3 3
pan-F-F-F-g pst-F-F-w pst-F-w pst-F-F-F-w Pst-F-w pst-F-w vb-F-F-F-g vb-F-F-F-3t vb-F-F--F-3 t p~t-F-F-F-3t pst-F-F-F-w pst-F-F-F-Leg1 I1 Leg I-F-F-F-w LegI-F-F-F-Leg I11 LegI-F-F-F-Leg I11
prc-F-F-F-m tc
pst-F-F-F-w pst-F-F-F-w pst-F-F-F-w pst-F-F-F-w
LegI-LegII-F-F-Leg I11 prc-F-F-mtc
mst-F-F-mtc psc-F-F-mtc
LegI-F-F-F-Leg I11 LegI-F-F-F-Leg111 LegI-F-F-F-Leg111 LegI-LegII-F-F-F-Leg111 pst-prc-F-F-F-w
prc-msc-F-F-F-m tc pst-F-F-F-w ps t-F-F-w 4 2 3 2 2 1 4 4 4 4 4 4 4 4 4 4 1 2 3 5 6 4 3 2 3 3 3 1 6 3 3 3
local -529
global -m
global -CO
global --x local --OC
local - - ~ 3
local -529
local -529
local -521
local -464
local -334, -326, -329f
local -390
local -398
local -404
local -404
local -447
local -324
local -326, -334, -333t
local -326, -337
local -335
local -336, -337
local -334
local --x,
local -431
local -379
local -426. -428. -427f
local -403, -399, -397. -390t
local -393
local -394
local -462, -459*
local 4 8 1
local -498
* For the comatose mosaic data, only the midline solution of (4) exists. The midline model has 3 distinct parameters and 6 cells (degrees of freedom (df) = 6 - 3 = 3). The midline solu- tion is common to both domineering and submissive models. Under the domineering model, all
4 solutions to (4) exist. but the interior solution always provides the maximum likelihood estimates 0 = (0(0),
. .
. , i ( 4 ) ) . There are 5 distinct parameters and 6 cells (df = 6-
5 1).A *
-f The values are from reruns differing only in the randomizations of mixed scores.
there is a lack of €it at the 0.1% level for six of the eight landmarks displayed. Similarly, if existing models are fiited to components of male mating behavior (HALL 1977, Table 1, p. 298), the single focal-pair models are rejected over- whelmingly. Further attempts to find a multi-focus model are now made in Table 4.
MULTI-FOCUS PHENOTYPES 225
22, a model with two focal pairs for comatose was tried and rejected (1nL = -“). I n order to explain the table of mosaic counts
N
in Table 2, at least 3 pairs of foci are required.The search for a multi-focus model begins with an initial guess as to the number of focal pairs F involved (in the case of “collapse,” F = 3 ) , and localization of the foci by means of the external landmarks in Table 1. The contiguity assumption was varied across a large number of models (as in Models 2-4), and i n all cases the assumption oi global contiguity was rejected. Among the landmarks in Table 1, the proximal antenna (pan) and genitalia (g) are at the extreme anterior and posterior ends, respectively, of the fate map of D. melunogaster, so that the foci must fall between them. Assuming local contiguity and three pairs of foci, the search begins with model 1 (Table 4), which is the first model not rejected by the mosaic data.
In models 7-15, the foci controlling the fate of the “collap~e’~ behavior are localized by moving landmarks i n from the anterior and posterior region of the blastoderm. The foci are mapped to the vicinity of the thorax and, among the cuticular structures. lie closest to the setae on the coxae of the legs.
I n models 11, 1G-20 and 26-28, the phenotype’s threshold is varied. The cur- rent mosaic experiment reveals little about the behavior’s threshold. I n single focal-pair models. the ability to distinguish between domineering and submissive models disappears as the foci approach the midline. We conjecture, then, that the lack of information on the threshold is due to the relatively ventral (i.e., rather close to the midline) locations of the behavioral foci. In models 16-21, a different pair of landmarks, the wings (w) and presutural bristle (pst) bracket the three pairs of behavioral foci.
If one examines the relation of foci to only three (two) landmarks at a time, then the data do (not) distinguish a 2-focal-pair model from a 3-focal-pair model, as in model (s) 22 (21,23,24 and 25).
I n models 29-31, the relations of three landmarks and three pairs of foci are examined. The foci are again seen to map near the legs in the thorax.
In summary. the predictions of the model for comatose concerning the number
of behavioral foci, the threshold of the “~ollapse’~ phenotype, and the localization of these foci by the mosaic experiments agree with those based on other experi- ments. The fit to the multi-focus model found is summarized i n Table 5. Models with two pairs of foci (Table 4) are rejected, but the sparse nature of the mosaic data (see columns
Iv
in Table 2) does not permit us to interpret the Pearson x2 on the 3-focal-pair model serving as our null hypothesis. More data will be necessary for a conclusive test of goodness-of-fit for the null hypothesis.226 J . A R N O L D A N D D. R. K A N K E L
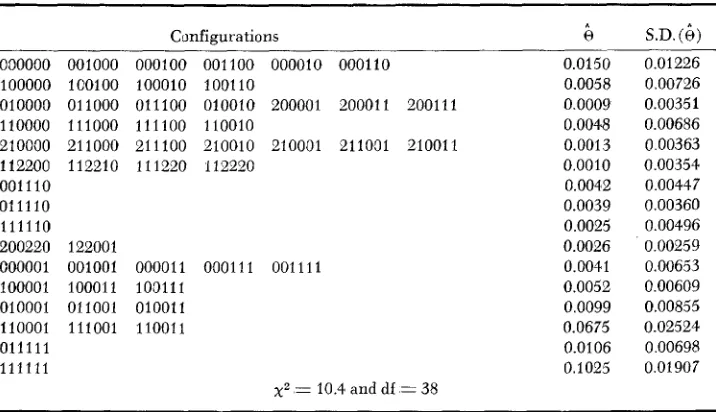
TABLE 5
Fitted null hypothesis of the conzatcse data
Configurations 000000 100000 OlOOOD 11 0000 210000 112200 001110 011110 111110 200220 000001 100001 010001 110001 011111 111111
001000 000100 001100 000010 000110 1co100 100010 100110
011000 011100 010010 200001 200011 200111 111000 111100 110010
211000 211100 210010 210001 211091 210011 112210 111220 112220
122001
001001 000011 000111 001111 100011 100111
011001 010011 111001 110011
~2 = 10.4 and df = 38
0.0150 0.0058 0.0009 0.0048 0.0013 0.0010 0.0042 0.0039 0.0025 0.0026 0.0041 0.0052 0.0099 0.0675 0.0106 0.1025
S.D.
(4)
0.01226 0.00726 0.00351 0.00686 0.00363 0.00354 0.00447 0.00360 0.00496 0.0025 9 0.00653 0.00609 0.00855 0.02524 0.00698 0.01907 ~~ ~
Blastoderm (LegI-LegII-F-F-F-LegIII) configurations observed in a 3-focal-pair ( F = 3 ) model and their probability estimates are reported for the collapse behavior of comatose. The phenotype's threshold is 3 ( k = 3). and 10 cycles of the EM algorithm were used to fit the model.
jected. Setting aside the selected landmark (g) and bracketing the two pairs of foci by anterior (e.g., ov) and posterior (e.g., 6t) landmarks, the foci were local- ized to the head relatively close to the outer vertical (ov) and ocellar (oc) bristles and to the proximal antenna (pan), When landmarks in the head near the foci were entered into the model and the threshold was varied, the log likelihood, lnL, pointed to a fully submissive model. More landmarks were added into the model to test more strongly whether the model was submissive and whether the number of focal pairs was two. After some searching, both the order of foci and landmarks and the phenotype's threshold
(k
= 4. submissive) were ascertained. The be- havioral foci mapped to a region on the fate map between the thorax and head; the more ventral part of this region is known to give rise to parts of the central nervmous system (RANKEL and HALL 1976, Figure 9). Experiments with internal markers are now needed.Lastly, the pattern preference behavior of the mutant CB8 was fate mapped to two focal pairs in the head near the arista and palp and between the lamina and lobula complex. Again the global contiguity assumption was flatly rejected ( I n L = -"). The existing HOTTA and BENZER models were also fit to the m,osaic data on CB8 and rejected by
x2
goodness-of-fit tests, as in Table 3 on comatose. Taking two landmarks at a time, again the single focal-pair models were flatly rejected.MULTI-FOCUS PHENOTYPES 22 7
posterior landmark was moved into the thorax, there was improvement i n the log likelihood, and as the posterior landmark was moved into the head, there was another large gain in the log likelihood. Thus, external landmarks indicated that the behavioral foci are in the vicinity of the head relatively close t o the arista (ar), vibrissae (vb), outer vertical bristle (ov) and ocellar bristle (oc). W e tried varying the threshold in the neighborhood of the behavioral foci and found a slight improvement (although insignificant) by postulating a fully submissive relation among the behavioral foci.
The closest structures to the two pairs of foci are the organizational phenotypes of various subsets of the optic lobe: lamina (lad and lav)
,
medulla (mm and ms), and lobula complex (Ibm and lbs).
The medulla maps relatively far from the foci in ccmparison to the lamina and lobula complex, a distance of the same magnitude as to the arista (ar) and vibrissae (vb).
We introduced more data with more landmarks i n the model to test the 2-focal- pair hypothesis and the submissive model assumption
( k
=4),
In contrast to coma:ose, the 2-focal-pair assumption was consistent with the mosaic data ana- lyzed, and a n additional pair of foci did not offer significant improvement over 2-focal-pair models. The data on CB8 also spoke m.ore strongly to the threshold than did the mosaic data on comatose; some thresholds were flatly rejected(1nL = -"), although in some cases the threshold was rejected on the basis of a single mosaic's landmark score. Internal landmarks are difficult to score, and one reclassification could change the log likelihood back to a finite value.
Our null hypothesis for the CB8 phenotype places the behavioral foci between the Iamina and lohula complex and has a phenotypic threshold of 4 (submissive). There are only enough data to reject definitively the single focal-pair models for the CB8 phenotype. The data are too sparse to interpret the
x2
goodness of fit f o r the null hypothesis.DISCUSSION
Complex behavioral and developmental events are apt to be under the control of a multiplicity of sites within the organism. Mosaic experiments on male court- ship
(HALL
1977) and flight(KOANA
andHOTTA
1978) indicate their control by multiple foci on the blastoderm. A class of models postulating several pairs of behavioral foci has been constructed, and a n interactive computer program has been developed to fit this family of models by maximum likelihood.228 J. A R N O L D A N D D. R. K A N K E L
foci, the phenotype’s threshold can vary from 1 (fully domineering model) to 2F (fully submissive model).
T h e family of models was directly tested with the relatively well-understood complex behavior induced by the comatose mutation (SIDDIQI and BENZER 1976) ;
other experiments had already provided the number of foci, their phenotypic threshold and their location on the fate map, This information was withheld from the analyst of the mosaic experiment. With the caveat that the Pearson
x 2
cannot be readily interpreted, a n analysis based solely on the data from mosaic experi- ments in the context of our model predicted that t h e comatose phenotype was under the control of a t least three pairs of foci mapping in the region of the thoracic ganglion and had a phenotypic threshold of 3 .T h e family of multi-focus models was also used as an exploratory tool on one component of female mating behavior, female receptivity, and on the pattern preference behavior of the mutant CB8. No model with only a single pair of foci controlling female receptivity can explain the mosaic data, in which counts of mosaics were broken down simultaneously b y behavior and two landmarks. Within the limits of the computer program, two pairs of behavioral foci were localized in a region between the thorax and head, a region giving rise to some of the central nervous system (KANKEL and HALL 1976). Only a fully submissive model explained the mosaic data. These mosaic experiments and their analysis now suggest that more painstaking experiments involving internal markers m a y further localize the foci controlling female receptivity.
An analysis of the pattern preference behavior of CB8 revealed that a single pair of foci could ne: explain the mosaic data. T h e analysis localized the two pairs
of foci close to certain external landmarks on the head. Scoring with the use of
internal landmarks was then warranted, and the two pairs of behavioral foci were further bracketed b y regions within the fly’s optic lobe. The relation of the behavioral foci was fully submissive.
T h e construction of the model and its use as a tool in the analysis of a number of behaviors reveals that the frequencies of possible blastoderm configurations giving rise to mosaics differing in landmark scoring and behavior are not well known, nor are the relationships among the frequencies of different blastoderm configurations understood. Larger-scale mosaic experiments are needed to define the possible blastoderm configurations, to discover the frequency relations among the blastoderm configurations and to test multifocus models adequately.
W e thank W I L L I ~ M HARRIS and HOWARD LIPSHITZ for providing us with unpublished data, W e also thank I. R. SAVAGE, JOHN Fox and HOWARD LIPSHITZ for reading and commenting on the manuscript. Work r e p x t e d here has been supported by Public Health Service grants NS12346 andNS11788.
L I T E R A T U R E C I T E D
CRAMER, H., 1974
DEMPSTER, A. P., N. M. LAIRD and D. B. RUBIN, 1977
Mathemaiical Methods in Statistics. Princeton University Press. Princeton,
Maximum likelihood from incomplete New Jersey.
MULTI-FOCUS PHENOTYPES 229
FLANAGAN, J. R., 1976 A computer program automating construction of fate maps of Dro- sophila. Develop. Biology 53: 142-146. - , 1977 A method for fate mapping the foci of lethal and behavioral mutants in Drosophila melanogaster.
Cell lineage of the imaginal discs in Drosophila gynandromorphs. J. Exp. Zool. 171): 61-76.
The Analysis of Frequency Data. The University of Chicago Press, Chicago. __ , 1977 Product models for frequency tables involving indirect observation. Ann. Statistics 5: 1124-1147.
Portions of the central nervous system controlling reproductive behavior in Drosophila melanogaster. Behav. Genetics 7 : 291-312.
Mosaic systems. pp. 265-314. In: The Genetics and Biology of Drosophila, Volume l a . Edited by M. ASHBURNER and E. NOVITSKI. Academic Press, New York.
HOTTA, Y. and S. BENZFX, 1970 Genetic dissection of the Drosophila nervous system by means of mosaics. Proc. Natl. Acad. Sci. U.S. 67: 1156-1163. -, 1973 Mapping of behavior in Drosophila mosaics. pp. 129-167. In: Genetic Mechanisms of Development, 31st Sym-
posium of the Society for Developmental Biology. Edited by F. H. RUDDLE. Academic Press, New York.
-
, 1976 Courtship in Drosophila mosaics: sex-specific foci for sequential action patterns. Proc. Natl. Acad. Sci. U.S. 73: 4154-4158.KANKEL, D. R. and J. C. HALL, 1976 Fate mapping of nervous system and other internal tissues in genetic mosaics of Drosophila melanogaster. Develop. Biology 48: 1-24.
KOANA, T. and Y. HOTTA, 1978 Isolation and characterization of flightless mutants in Drosophila melanogaster. J. Embryol. Exp. Morph. 45: 123-143.
MERRIAM, J. R. and K. LANGE, 1974 Maximum likelihood estimates for fate map locations o f
behavior in Drosophila. Develop. Biology 38: 196-201.
SIDDIQI, 0. and S. BENZER, 1976 Neurophysiological defects in temperature-sensitive paralytic mutants of Drosophila melanogaster. Proc. Natl. Acad. Sci. U.S. 73: 3253-3257.
STURTEVANT, A. H., 1929 The claret mutant type of Drosophila simulans: a study of chromo- some elimination and of cell-lineage. Zeit. wiss. Zool. 135: 323-356.
WEHNER, R., 1972 Spontaneous pattern preferences of Drosophila melanogaster to black areas
in various parts of the visual field. J. Insect Physiol. 18: 1531-154.3.
ZALOKAR, M., I. ERK, P. SANTAMARIA, 1980 Distribution of ring-X chromosomes in the blas- toderm of gynandromorphic D . melancgaster. Cell 19 : 133-141
Corresponding editor: A. CHOVNICK GARCI~-BELLIW, A. and J. R. MERRIAM, 1969
HABERMAN, S. J., 1974
HALL, J. C., 1977