ABSTRACT
MINEART, KENNETH. Utilization of Network-Forming Block Copolymers and Ionomers in the Development of Novel Nanostructures and Responsive Media. (Under the direction of Dr. Richard J. Spontak).
Utilization of Network-Forming Block Copolymers and Ionomers in the Development of Novel Nanostructures and Responsive Media
by
Kenneth Mineart
A dissertation submitted to the Graduate Faculty of North Carolina State University
in partial fulfillment of the requirements for the degree of
Doctor of Philosophy
Chemical Engineering
Raleigh, North Carolina 2015
APPROVED BY:
_______________________________ _______________________________
Richard J. Spontak Michael D. Dickey
Committee Chair
_______________________________ _______________________________
DEDICATION
BIOGRAPHY
Kenneth was born in Los Angeles County, CA where his parents, Kevin and Jody, resided for 1 year prior to returning to their home state of Iowa. Kenneth was raised in West Burlington, IA with his younger brother, Christian, and attended West Burlington Elementary, Junior High, and High School. There, he took an interest in upper level math courses; participated in varsity football, basketball, track, and baseball; and met his future wife, Hannah. After graduation, Kenneth attended Iowa Wesleyan College for two years where he received a scholarship to play varsity basketball. He transferred to the Department of Chemical and Biochemical Engineering at the University of Iowa in 2008 where he began working with Brian Dillman and Prof. Julie Jessop on radical/cationic-hybrid photopolymerization kinetics. During many lunch time discussions with Brian and another PhD student, Clint Cook, Kenneth truly developed a passion for scientific research and made the decision to pursue his PhD. Kenneth took courses in graduate polymer chemistry and technical writing during his senior year, and as a course capstone wrote a review paper on block copolymers for lithographic masks, further defining his scientific interest toward block copolymers and molecular self-assembly. Kenneth married Hannah shortly following his graduation from the University of Iowa, and they subsequently relocated to Raleigh, NC where he was accepted to graduate school.
ACKNOWLEDGMENTS
While a PhD is an individual achievement, mine could not have been possible without the help and support from many people. First, and foremost, is my research advisor, Prof. Richard Spontak, who has maintained an infectious optimism and enthusiasm towards research during nearly all of my interactions with him. These mannerisms often revived me following meetings with him, and I feel as though I have begun to adopt these characteristics in my own interactions with peers and mentees. I also must acknowledgment my fellow labmates, Syamal Tallury, Daniel Armstrong, Justin Ryan, Mohammad Tuhin, Heba Al-Mohsin, and Iman Soltani, who have provided companionship during many long days in the lab, continuous feedback, and many fruitful collaborations and discussions. I have benefited intellectually and grown as a mentor from working with a number of undergraduate students including Alex Woodrow (ChE 2013), Dillon Love (ChE 2014), David Williams (ChE 2014), Steven Plante (ChE 2015), Corey Parks (ChE 2016), Max Griffiths (MSE 2016), Andrew Drake (ChE 2017), and Josh Dickerson (MSE 2017). I appreciate their willingness to be my mentee guinea pigs.
would have been impossible without support from Mrs. Susanna Klingenberg, Dr. Beth Overman, and Profs. Jan Genzer, Matthew Cooper, and Lisa Bullard.
TABLE OF CONTENTS
LIST OF TABLES ... xi
LIST OF FIGURES ... xii
CHAPTER 1 The Thermoplastic Elastomer Revolution: Functionality and Responsiveness . 1 1.1. Introduction ... 2
1.1.1. TPE Fundamentals... 2
1.1.2. Block Copolymer Self-Assembly ... 4
1.2. Functional TPE Progress ... 6
1.2.1. Optical Functionality ... 6
1.2.2. Thermal Responsiveness ... 8
1.2.3. Electro-Actuation ... 10
1.2.4. Conductivity & Transport ... 12
1.2.5. Environmentally Responsible... 14
1.3. Summary ... 16
1.4. References ... 27
CHAPTER 2 Molecular-Level Insights into Asymmetric Triblock Copolymers: Network and Phase Development* ... 37
2.1. Introduction ... 38
2.2. Methods... 40
2.3. Results and Discussion ... 41
2.4. Conclusions ... 45
2.5. Acknowledgments... 46
2.6. References ... 51
CHAPTER 3 Dual Modes of Self-Assembly in Super Strongly-Segregated Bicomponent Triblock Copolymer Melts* ... 54
3.1. Introduction ... 55
3.2. Methods... 57
3.3. Results and Discussion ... 59
3.4. Conclusions ... 64
3.5. Acknowledgments... 65
CHAPTER 4 Ultrastretchable, Cyclable and Recyclable 1- and 2-Dimensional Conductors
Based on Physically Cross-linked Thermoplastic Elastomer Gels* ... 73
4.1. Introduction ... 74
4.2. Experimental ... 77
4.3. Results and Discussion ... 78
4.4. Conclusions ... 83
4.5. Acknowledgments... 84
4.6. References ... 92
CHAPTER 5 Phase-Change Thermoplastic Elastomer Blends for Tunable Shape Memory by Physical Design*† ... 96
5.1. Introduction ... 97
5.2. Experimental ... 98
5.3. Results and Discussion ... 99
5.4. Conclusions ... 104
5.5. Acknowledgments... 105
5.6. References ... 109
CHAPTER 6 Morphological Investigation of Midblock-Sulfonated Block Ionomers Prepared from Solvents Differing in Polarity* ... 111
6.1. Introduction ... 112
6.2. Experimental ... 114
6.3. Results and Discussion ... 116
6.4. Conclusions ... 121
6.5. Acknowledgments... 122
6.6. References ... 129
CHAPTER 7 A Solvent-Vapor Approach Towards the Control of Block Ionomer Morphologies* ... 134
7.1. Introduction ... 135
7.2. Experimental ... 139
7.2.1. Materials ... 139
7.2.2. Methods ... 139
7.3. Results and Discussion ... 141
7.3.1. Theoretical Equilibrium Morphology ... 141
7.3.3. SVA Solvent Selection ... 146
7.3.4. Time-Dependent SVA ... 149
7.3.5. SBI DOS Influence ... 152
7.3.6. Orientation Considerations ... 153
7.4 Conclusions ... 156
7.5. Acknowledgments... 157
7.6. References ... 172
CHAPTER 8 Sulfonated Pentablock Copolymer Hydrogels: A Kinetic and Thermal Exploration ... 177
8.1. Introduction ... 178
8.2. Experimental ... 180
8.2.1. Materials ... 180
8.2.2. Methods ... 181
8.3. Results and Discussion ... 183
8.3.1. Dry Film Morphology ... 183
8.3.2. Hydrogel Swelling Kinetics... 184
8.3.3. Hydrogel Temperature Dependence ... 188
8.4. Conclusions ... 190
8.5. Acknowledgments... 191
8.6. References ... 202
CHAPTER 9 Water-Induced Nanochannel Networks in Self-Assembled Block Ionomers* ... 205
9.1. Introduction ... 206
9.2. Experimental ... 207
9.3. Results and Discussion ... 210
9.4. Conclusions ... 214
9.5. Acknowledgments... 215
9.6. References ... 220
CHAPTER 10 Conclusions and Future Recommendations... 224
10.1. Conclusions ... 224
10.1.1. Diblock-to-Triblock Transitions ... 224
10.1.3. Midblock Sulfonated Block Copolymers ... 226
10.2. Recommendations for Future Work ... 227
APPENDICES ... 231
APPENDIX A Highly-Flexible Aqueous Photovoltaic Elastomer Gels Derived from Sulfonated Block Ionomers* ... 232
A.1. Introduction ... 232
A.2. Results and Discussion... 235
A.3. Conclusions ... 241
A.4. Experimental ... 242
A.5. Acknowledgments ... 243
A.6. References ... 249
APPENDIX B Phase-Change Thermoplastic Elastomer Blends for Tunable Shape Memory by Physical Design – Supplemental Information† ... 252
B.1. Section 1 ... 252
B.2. Section 2 ... 253
B.3. Section 3 ... 254
LIST OF TABLES
Table 7.1. Predicted block volume fractions (i) of each SBI material used in this
study.a ...159 Table 7.2. Summary of morphological parameters extracted from SAXS profiles
for CH- and TIPA-cast SBI films before and, in some cases, after
solvent-vapor annealing (SVA) in identified media. ...162 Table 8.1. First-order rate constants extracted from fits of SAXS (kSAXS) and water
uptake (kWU) data, as well as WU(t=∞)=WU∞ from water uptake data,
for the three SBI grades and two casting-solvents examined. ...198 Table A.1. Specimen details and performance metrics of the PVEGs investigated
LIST OF FIGURES
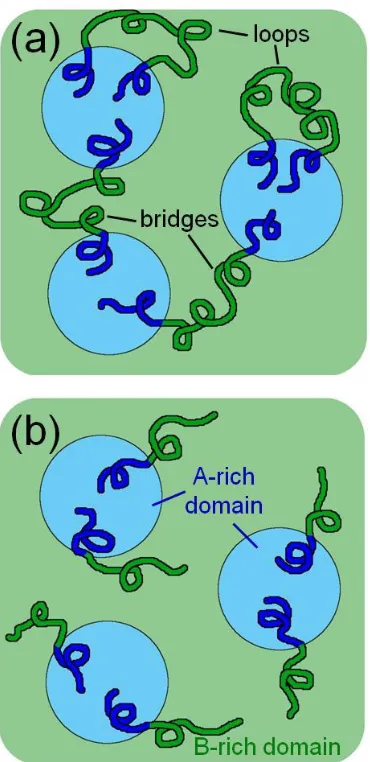
Figure 1.1. Schematics indicating the molecular conformation of block copolymer chains in an ABA triblock copolymer (a) and an AB diblock copolymer (b). The A and B blocks are indicated by blue and green beads, respectively, and A-rich and B-rich domains are correspondingly colored. In addition, examples of loop and bridge conformations within
the ABA triblock schematic are provided. ...18 Figure 1.3. Mechanochromic response of poly[styrene-b-n-butyl acrylate-b-styrene]
(PS-PnBA-PS) TPE with a single spiropyran (SP) at the center of each chain. The ring-opening reaction of SP to merocyanine (MC), which occurs upon strain (ε) and is responsible for the color change, is also
included. This figure was adapted from 49. ...20 Figure 1.4. The triple shape memory behavior achieved by 56 using a
poly[styrene-b-(ethylene-co-propylene)-b-styrene] (SEBS) TPE in combination with two waxes (Tm,1 = 32°C, Tm,2 ≈ 61°C). The sample was heated to T >
Tm,2 > Tm,1 (a) where it was twisted a half turn, cooled to Tm,2 > T > Tm,1
(b) where it was twisted another half turn, and then cooled to Tm,2 > Tm,1
> T (c). Each half twist is then recovered individually by heating to the same incremental temperatures without any applied stress (d,e). This
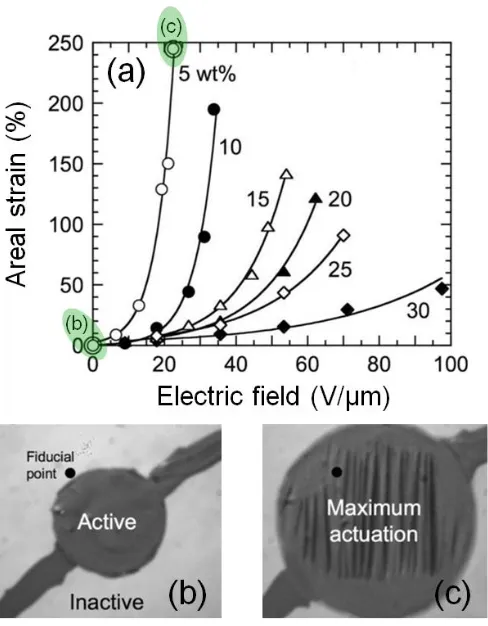
figure was adapted from 56. ...21 Figure 1.5. Areal actuation response of SEBS/mineral oil TPEGs as a function of
applied electric field for various gel compositions (a) including points that correspond to the images in (b) and (c). This figure was adapted
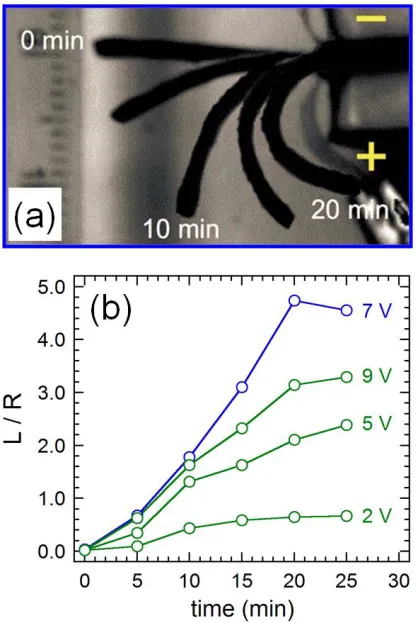
from 62. ...22 Figure 1.6. Subsequent, overlaid images of an IPMC (under 7 V applied voltage)
fabricated from a midblock sulfonated pentablock copolymer, Nexar®, ion exchanged to contain Li+ and swollen in glycerol (a) and corresponding actuation rate data (where L/R is the ratio of the IPMC length to its radius of curvature) for varoius applied voltages (b) where the blue data are from the image set in (a). This figure was adapted from
64
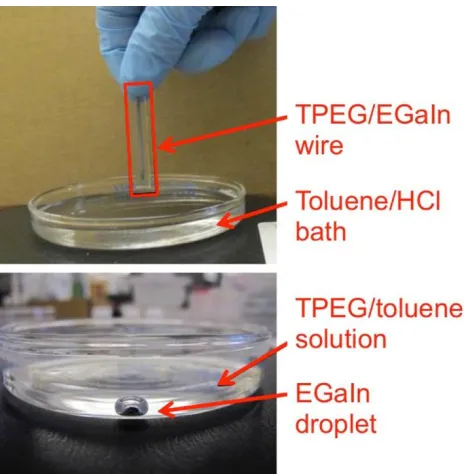
. ...23 Figure 1.7. Images of a SEBS extruded hollow fiber subsequently filled with liquid
metal at 0% (a) and 900% (b) uniaxial strain, as well as normalized resistance data (R/R0 where R and R0 are the resistances at a given strain
and at 0% strain, respectively) as a function of strain (c) for a molded microchannel (□)84
and an extruded fiber (○)83 each subsequently filled
with liquid metal. Images were adapted from 83. ...24 Figure 1.8. Photocurrent-density as a function of voltage for Ru2+-dyed TPEGs:
Nexar®/H2O (a), and a comparison of the stability in solar cell
efficiency (η) between SOS/IL and its pure-IL analog (b). Data were adapted from 104,106. The inset in (a) indicates the construction of a TPE-based solar cell, adapted from 105, wherein the layers from top to bottom are: FTO-coated glass (orange), dye-containing ionic-TPEG (green), poly[dimethyl siloxane] spacer (transparent), and Platinum-electrode
(silver). ...25 Figure 1.9. Block chemistries used in constructing TPEs from renewable resources
where blue and green indicate endblock and midblock polymers, respectively. The acronyms and sources for each polymer are as follows: polylactide (PLA)115–125,129, poly[α-methylene-γ-butyrolactone] (PMBL)126, poly[α-methyl,para-methyl-styrene] (PAMMS)127, poly[N-phenylitaconimide] (PPHII)128, poly[3-(R)-hydroxybutyrate] (PHB)119, poly[1,3-trimethylene carbonate] (PTMC)120,129, polymenthide (PM)121–
124,126
, poly[myrcene] (PMYR)127, poly[6-methyl-ε-caprolactone]
(PMCL)125, and poly[dibutyl itoconate] (PDBI)128 ...26 Figure 2.1. (a) Schematic illustration of triblock copolymer micelles depicting
bridges, loops and dangles (labeled). (b) Values of * evaluated from the MOC theory26 as the value of τ corresponding to the predicted minimum in TODT (or, alternatively, the maximum in χN at the order-disorder
transition), and presented as a function of the parent diblock composition (). The dotted vertical line identifies the point below which * is no longer observed. The depicted molecules correspond to
= 1 and = ½ (labeled). ...47 Figure 2.2. (a) The dependence of the midblock fractions (fB, red; fL, blue; fD,
black) from DPD simulations with εAB = 35kT (open symbols), MC
simulations (filled symbols) and SCFT predictions (solid lines) on in the 9-46-A2 copolymer series. The intersecting dashed lines yield the
value of N, and the gray stripe identifies * determined from the MOC
theory. (b) DPD simulation results of N (green) and fB,N (red) as
functions of for two values of AB (in units of kT): 40 (open symbols)
and 50 (filled symbols). The solid lines represent linear regressions of the data, whereas the dashed line serves as a guide for the eye. The variation of N on parent diblock copolymer incompatibility (N) from
SCFT is included in the inset, and the solid line is a linear regression. ...48 Figure 2.3. MC simulation results of the midblock fractions in the network regime
— (a) bridge, (b) loop and (c) dangle — as functions of reduced temperature (T*) for a 9-45-4 copolymer. The ODT is labeled, and the
error bars correspond to the standard deviation in the data. ...49 Figure 2.4. Isothermal phase diagram along the τ-β plane constructed from MC
lamellae (PL), gyroid (QIa3d), hexagonally-packed cylinders (H), and
body-centered-cubic spheres (QIm3m). The second abscissa axis converts
the β scale to the more conventional A-fraction basis (), defined in the
text. ...50 Figure 3.1. Snapshots of MC simulations of molecularly asymmetric A1BA2
triblock copolymers in the sSS regime revealing the existence of interstitial micelles between lamellae [(a) edge view] and perforated lamellae [(b) parallel view through the perforation]. Included in (a) is an inset showing the lateral hexagonal packing of the micelles in (a). The schematic illustration in (c) depicts the placement of the blocks (not drawn to scale). Shades of blue and green refer to A1 and A2 features,
respectively, whereas red signifies individual B midblocks in (c). ...66 Figure 3.2. Values of the A2 block fractions extracted from MC simulations of sSS
A1BA2 triblock copolymers – (a) 39-40-1, (b) 38-40-2, (c) 37-40-3, (d)
47-48-1, (e) 46-48-2, and (f) 45-48-3 – provided as functions of reduced temperature (T*). The fractions shown include micelle-forming bridges (νM, circles), double-anchored chains (νL, triangles, and dangling ends
(νD, squares). The solid lines connect the data, and the size of the
simulation boxes employed here are (a)-(c) 80x40x40 and (d)-(f)
96x48x48 to explore size effects. ...67 Figure 3.3. Dependence of the micelle aggregation number (Q) on T* for
copolymers designated as (40-x)-40-x (squares), (48-x)-48-x (circles), and (56-x)-56-x (triangles) for the cases of x = 1 (filled symbols) and x
= 2 (open symbols). The solid lines connect the data. ...68 Figure 3.4. The upper and lower stability limits (open and filled circles,
respectively) for interstitial micelles in A1BA2 triblock copolymers with
short A2 blocks compiled from MC simulation results for copolymers
varying in chain length (N): 80 (squares), 96 (circles), and 112 (triangles). The solid lines are guides for the eye, and the dashed line corresponds to Equation 3.3 in the text (evaluated under the specified conditions). The inset displays the dimensionless free energy as a function of χN from Equation 3.2 for dangling ends (νL = 0, upper four
curves) and double-anchored chains (νL = 1, bottom curve) at different
fA2 (labeled). ...69
Figure 4.1. Step-by-step procedure by which microchannels are fabricated in TPEGs. A PDMS mold with a desired pattern (a) is first prepared. A TPEG film is melt-pressed onto the mold (b and c) according to the temperature considerations described in the text to leave an imprint of the pattern once the mold is removed (d). The molded TPEG film is melt-pressed with an unmolded TPEG film (e) to yield the desired
Figure 4.2. (a) The dynamic shear moduli (G’,○; G’’,●) measured as a function of temperature from a 25/75 w/w SEBS/oil TPEG under isochronal conditions. The arrows identify the upper and lower transition temperatures needed to fabricate microchannels in TPEG laminates. (b) The upper (Δ) and lower (●) transition temperatures comprising the welding window (shaded) for TPEG laminates varying in copolymer
concentration. ...86 Figure 4.3. (a) The dependence of tensile modulus (this work,○; reported results,40
●) and adhesion strength (Δ) on copolymer concentration. The solid line serves to connect the data, whereas the dashed line is a power-law fit to the data. Error bars denote the standard error in the data. (b) Adhesion strength displayed as a function of tensile compliance and fitted to an exponential decay function. The intersection of the dotted tangent lines identifies the cross-over between good adhesion and high compliance and, thus, the composition of the TPEG (20 wt% SEBS) used to
fabricate laminates in this study. ...87 Figure 4.4. (a) Photographs of a TPEG/EGaIn composite before (top left), during
(bottom) and after (top right) stretching to 1000% strain to illustrate its ultrastretchable and elastic nature. (b) Photographs of 2-dimensional arrays that can be achieved by injecting liquid EGaIn into the
microchannels fabricated in TPEG laminates. ...88 Figure 4.5. (a) Normalized resistance (R/R0) of TPEG/EGaIn composite wires as a
function of tensile strain. (b) The change in normalized resistance upon cycling to 500% strain. The theoretical prediction included as a solid line in (a) is determined from R = (L/L0)2, where L denotes the wire
length and L0 represents the initial length at rest. The solid line in (b)
serves to connect the data. ...89 Figure 4.7. A TPEG/EGaIn composite wire prior to recycle (top) and after 10 min
of immersion in a mixture of toluene and HCl acid (bottom). The copolymer and oil dissolve completely in the toluene phase, whereas the density of EGaIn and the presence of acid cause the metal to bead up in
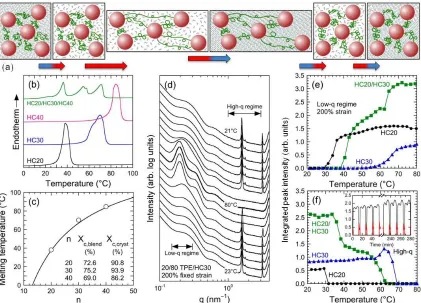
the bottom of the dish. ...91 Figure 5.1. (a) Schematic diagram of a TPE/HC-designed SMPB (from left to right)
relaxed at ambient temperature, heated above Tm of the HC, deformed to
a temporary strain state, cooled below Tm to fix the temporary strain
state, heated above Tm to promote strain recovery, and cooled again to
permit strain-thermal cycling. (b) DSC thermograms acquired from SMPBs containing one or three HCs (labeled and color-coded). (c) Tm
as a function of carbon number (n) for HCs incorporated into a TPE. The solid line corresponds to Tm for pure HCs predicted23 by [2347(n –
symmetry parameter and = 0.61(n – 2) – 1 relates to the number of torsional angles within the HC. Values of Xc,blend and Xc,cryst discerned
from the latent enthalpies of melting are tabulated in (c). (d) Combined SAXS/WAXS intensity profiles acquired from a 20/80 w/w TPE/HC30 SMPB initially fixed at 200% strain upon progressively heating to 80°C (top half) and re-cooling to 23°C (bottom half). Integrated peak intensities calculated from the low-q and high-q regimes identified in (d) are presented for three SMPBs (labeled and color-coded) in (e) and (f), respectively. The inset in (f) displays high- and low-q integrated peak intensities (black and red lines, respectively) for a 20/80 w/w
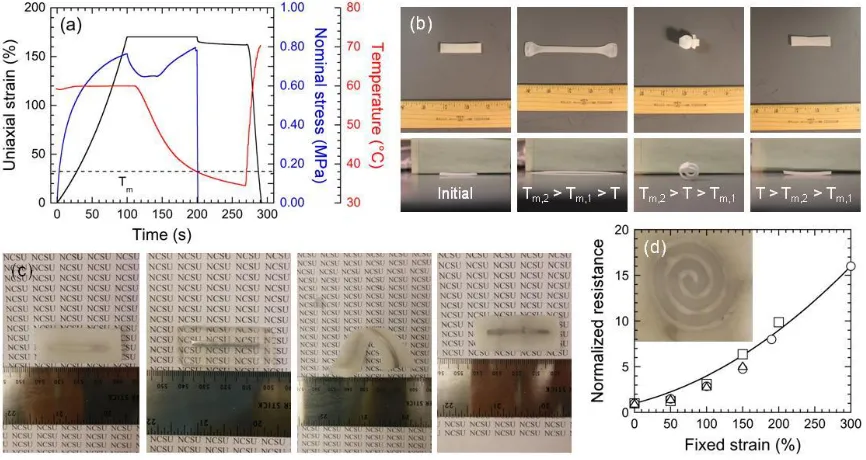
TPE/HC20 SMPB upon thermal cycling. ...106 Figure 5.2. (a) Time-dependent sequence of uniaxial strain, nominal stress and
temperature measurements (color-coded) acquired from a 20/80 w/w TPE/HC20 SMPB. The dashed horizontal line identifies Tm. (b) Series
of optical micrographs acquired from a bilaminate SMPB illustrating the two temporary strain states achieved with two different HCs differing in Tm (see text). (c) Optical micrographs of a 20/80 w/w TPE/HC20 SMPB
fabricated with a centerline channel, imbibed with liquid metal (dark feature) and strained into a coil upon heating above Tm to form a
shape-memory conductor. Normalized resistance values measured from replicates strained to different levels are provided in (d), along with calculated values based exclusively on the assumption of a constant square-channel cross-section (solid line). Included in (d) is a 2-D pattern, indicating that these conductive SMPBs can be used as
shape-memory antennae. ...107 Figure 5.3. (a) DSC thermograms measured at different concentrations of a
tackifying resin (wTR) in the HC/TR mixture incorporated into the 20
wt% TPE matrix of the SMPB. Values of Tm and crystallinity (Xc,blend
and Xc,cryst) are presented as functions of wTR in (b, color-coded). While
the solid and dashed lines are intended to serve as guides for the eye, both Tm and Xc,blend appear to decrease linearly with increasing wTR. The
shaded region identifies the range of Xc,cryst for SMPBs that are capable
of fixing a temporary strain state. Strain recovery kinetics are displayed at different TR loading levels for TPE/HC20/TR SMPBs with 20 and 30 wt% TPE in (c) and (d), respectively. The times required to reach 50% (fuchsia) and 90% (green) recovery are included as a function of Xc,blend
in the inset of (d) for SMPBs with 20 (circles) and 30 (triangles) wt% TPE. The solid lines are linear regressions to the data. (e) Schematic depictions of a strain-fixed TPE/HC/TR ternary SMPB before (top) and
after (bottom) heating above Tm. ...108 Figure 6.1. (a) The chemical structure of the SBI material examined here. Included
-stained SBI-52-AR, and (d) Pb[acetate]2-stained SBI-52-TIPA
materials, and the insets are enlargements to display finer detail. The electron opaque (dark) features in (b) correspond to nonpolar (T and EP) blocks, where as the light characteristics identity S/sS-rich
nanostructural elements. The contrast is reversed in (c) and (d). ...123 Figure 6.2. TEM image of the Pb[acetate]2-stained SBI-26-AR material. The most
electron-opaque objects correspond to gold nanoparticles. The S/sS blocks are selectively stained and appear dark, whereas the light features
consist of unstained nonpolar blocks. ...124 Figure 6.3. TEM images of the (a) RuO4-stained SBI-52-THF, (b) Pb[acetate]2
-stained SBI-52-THF, and (c) Pb[acetate]2-stained SBI-26-THF
materials. The dark spherical speckles apparent in (b) are gold nanoparticles deposited on the film surface for image alignment purposed in TEMT. Image contrast is the same as that described in the
caption of Figure 6.1. ...125 Figure 6.5. Isocontour 3D images acquired by TEMT of the Pb[acetate]2-stained (a)
SBI-52-AR and (b) SBI-52-THF materials displayed at three viewing angles. In these reconstructions, the contrast is reversed from earlier TEM images so that the white features identify ion-rich microdomains.
Each reconstruction is ≈40 nm thick. ...127 Figure 6.6. (a) A planar slice of the Pb[acetate]2-stained SBI-52-THF TEMT
reconstruction wherein linear traces along the lamellar normal indicate the location of the cross-sectional (thickness) slices provide by number in (b). The cross-sectional view included in the inset in (b) confirms that the gold nanoparticles (circled) used for alignment purposes in TEMT
are not severely distorted. ...128 Figure 7.1. Schematic illustration (a) and DPD simulation screenshot (b) of the
4,3-LAM morphology for an ABCBA pentablock copolymer. The single chain included in (a) depicts one possible arrangement within the nanostructure, and D indicates the microdomain periodicity. Corresponding segmental volume fraction profiles, wherein x denotes the direction along the lamellar normal and L is the length of the DPD
simulation box, are provided in (c). ...160 Figure 7.2. In (a), a TEM image of SBI-52 cast from TIPA. In this and all
subsequent images, dark (stained) and light (unstained) regions indicate S/sS-rich and T-/EP-rich microdomains, respectively. A series of SAXS profiles acquired from all three SBI grades cast from TIPA is provided in (b). The arrows included in (b) indicate the location of the primary peak (q*), and the thick orange lines represent model fits of P(q) from
Figure 7.3. TEM images and enlargements of (a) SBI-52 and (b) SBI-26 cast from THF. In the corresponding SAXS profiles (c), as well as in all SAXS profiles hereafter reported, filled arrows identify the primary peak (q*)
and open arrowheads indicate the S(q) peaks discussed in the text. ...163 Figure 7.4. SAXS profiles collected from SBI-52 cast from TIPA (black) and THF
(blue), and subsequently subjected to SVA for 24 h using methanol (MeOH), chloroform (CHCl3) or THF vapor. As-cast profiles prior to
SVA are included for comparison, and the thick orange lines represent
model fits of P(q) from Eq. 1 to each TIPA-cast data set. ...164 Figure 7.5. Time-dependent SAXS profiles for in-situ SVA (displayed at 2 min
intervals) of a TIPA-cast SBI-52 film subjected to subsequent THF
vapor exposure. The S(q) scattering peaks are discussed in the text. ...165 Figure 7.6. Microdomain spacing (a) and normalized S(q) peak intensities (red) and
2π/q values (blue) (b) as functions of SVA exposure time for TIPA-cast SBI-52 films. The normalized intensities correspond to the peaks positioned at 2q* ( ), 3q* ( ) and 4q* ( ) in Figure 5. Color-matched solid lines serve to connect the data, whereas the black solid line in (b) represents a nonlinear regression of the first-order kinetic rate
expression introduced in the text. ...166 Figure 7.7. Time-dependent SAXS profiles for in-situ SVA (displayed at 2 min
intervals) of a THF-cast SBI-52 film subjected to subsequent THF vapor
exposure. The S(q) scattering peaks are discussed in the text...167 Figure 7.8. Microdomain spacing (black) and 2π/q values (blue) as functions of
SVA exposure time for THF-cast SBI-52 films. The solid lines serve to
connect the data. ...168 Figure 7.9. SAXS profiles acquired from all three SBI grades (DOS values are
labeled) cast from TIPA (blue) and THF (black), followed by a 2-h exposure to THF vapor and subsequent drying. The S(q) scattering
peaks are discussed in the text. ...169 Figure 7.10. TEM images of (a) SBI-52 and (b) SBI-26 cast from THF, exposed to
THF vapor for 2 h and dried. ...170 Figure 7.11. 2D SAXS patterns obtained from SBI-52 as-cast from (a) TIPA and (b)
THF, as well as after SVA in THF vapor for 2 h (c and d, respectively). ...171 Figure 8.1. Front (a) and side (b) schematic views of the custom-built chamber for
in-situ SAXS experiments. The arrow in each indicates the sample location (orange film), the dashed line and gray cone in (b) indicate the
Figure 8.2. Micrographs collected for SBI-52 films cast from TIPA (a) and THF (b), where in light and dark regions are hydrophobic, T-/EP-rich and
hydrophilic, S/sS-rich domains. ...193 Figure 8.3. 1-D SAXS profiles obtained for TIPA-cast SBI-52 films during in-situ
swelling with liquid water. The profiles progress from 0 (top) to 37.18 s (bottom) exposure at increments of 2.86 s. The red and blue arrows indicate the position of the primary peak (q*) and first minimum (qmin),
which corresponds to the first minimum in the form factor, respectively. ...194 Figure 8.4. The sphere radii extracted from in-situ 1-D SAXS profiles (a) and
macroscopic water uptake (b) as functions of TIPA-cast film immersion time in liquid water. The black, blue, and red points are data that correspond to the three DOS grade SBIs employed (26, 39, and 52, respectively) whereas the solid lines are first-order kinetics fits for each
data set. ...195 Figure 8.5. 1-D SAXS profiles obtained for THF-cast SBI-52 during in-situ
swelling with liquid water. The profiles progress from 0 (top) to 37.18 s (bottom) exposure to water at increments of 2.86 s. The red, blue, and green arrows indicate the position of the primary peak (q*) and structure
factor peaks at √3q* and 2q*, respectively. ...196 Figure 8.7. A summary of tensile moduli from stress-strain experiments performed
after 24 h immersion in liquid water for each SBI grade cast from either
TIPA (gray) or THF (red). ...199 Figure 8.8. Water uptake data from SBI-26 (black), SBI-39 (blue), and SBI-52 (red)
following 24 h immersion at select water temperatures (a), and subsequent drying and reswelling for 24 h at room temperature (b). Open and closed symbols correspond to TIPA-cast and THF-cast films,
respectively, and the solid and dashed lines denote linear fits. ...200 Figure 8.9. Tensile moduli for TIPA-cast SBI hydrogels swollen in water at select
temperatures for each DOS (SBI-26, black; SBI-39, blue; and SBI-52, red) (a) and 1-D SAXS patterns for SBI-39 as-cast, i.e. never exposed to liquid water, (dry) and immersed in water at increasing temperatures (as
indicated) and subsequently dried (b). ...201 Figure 9.1. Micrographs of the SBI cast from the 85TIPA mixed solvent (a) before
and (b) after SVA in THF. Dark features represent selectively-stained ionic microdomains. Accompanying SAXS profiles are included in (c). Open arrowheads identify q* in each profile, and higher-order lamellar
reflections (in the SVA) case are indicated by filled arrowheads. ...216 Figure 9.2. TEMT slices of the SBI cast from 85TIPA highlighting the presence of
clusters consisting of 2 (blue), 3 (orange), 4 (red), 5 (green), and 9 (purple) micelles. In (d), a TEMT image of the SBI is presented after immersion in DI water for 1 h prior to staining and sectioning, and a TEMT slice after BCS analysis, indicating the presence of a single ionic
network (yellow), is included in (e). All scalebars are 100 nm...217 Figure 9.3. In (a), real-time SAXS profiles acquired from the SBI while immersed
in DI water (time increases from top to bottom. Black and red triangles identify q* and qmin, respectively. Values of the microdomain
periodicity (D, ) and equivalent volume (V*, ) extracted from SAXS profiles such as those in (a) are displayed as a function of immersion time in (b). The inset in (b) provides the mass uptake of DI water as a
function of immersion time. ...218 Figure 9.4. Photocurrent density presented as a function of voltage for three
specimens (labeled): THF-cast SBI, 70TIPA-cast SBI and 70TIPA-cast SBI subjected to SVA in the presence of THF prior to incorporation of photoactive dyes and photovoltaic analysis. The input power density is 1
kW/m2 under AM1.5G standard light spectrum conditions. ...219 Figure A.2. In (a, c, and d), current density presented as a function of voltage for
three different case studies: (a) fabrication procedure (labeled), (c) block ionomer used (see Table A.1) and the cycle number for SBI2.0 (labeled), and (d) dye concentrations (labeled as [Ru(bpy)3]/[DAS] and
expressed in mM) used in conjunction with SBI2.0. In all cases, the lines serve to connect the data. The inset displays the dependence of the short-circuit current density (Jsc) on open-circuit voltage (Voc) extracted
from the data in (a), and the line serves as a guide for the eye. Both dye concentrations in SBI2.0 are 5 mM in (a), and the sequential dye protocol is used to generate the specimens in (c and d). In (b), UV-Vis absorbance spectra acquired from the SBI2.0 material upon addition of each dye and combinations thereof (labeled). All the lines connect the data, and the dotted line corresponds to an aqueous solution of Ru(bpy)3
without polymer. All data have been collected at a power density of 1
kW/m2 under AM1.5G standard light spectrum conditions. ...246 Figure A.3. Mechanical properties measured from the hydrated SBI2.0 system
alone, as well as with either Ru(bpy)3 or a mixture of both dyes
equimolar (5 mM) mixture of both dyes (dashed line), and the solid line
serves as a guide for the eye. ...247 Figure A.4. In (a and b), Raman spectra collected from the hydrated SBI2.0 system
alone, as well as with either dye or a mixture thereof (labeled). Included in (b) is the position of the symmetric SO3 vibration for sulfonated
polystyrene (s). The lines serve to connect the data. A TEM image of
the SBI2.0 ionomer cast from THF so that the ion-rich pathways are continuous and stained with lead acetate so that the pathways appear electron-opaque (dark) is displayed in (c). The inset in (c) is a TEM image (at the same magnification) of the as-received ionomer prepared from a nonpolar solvent.34 The specimens in (c) are surface-decorated with gold nanoparticles measuring ca. 5 nm in diameter and appearing as small, dark specks. A schematic illustration (d) depicts the variety of complexes that can form between the dye molecules and charged units fixed on the hydrated midblock of the ionomer (identified in the figure
legend). ...248 Figure B.1. SAXS/WAXS patterns for 20/80 w/w SEBS/HC blends with different
HCs (labeled) at 80°C. Filled arrows highlight the primary peak position (q*), while open arrows identify the peak positions in the structure factor corresponding to spherical styrenic micelles positioned on a bcc lattice
(discussed in the text). ...255 Figure B.2. (a) Combined SAXS/WAXS profiles acquired from a 20/80 w/w
TPE/HC20 SMPB initially fixed at 200% strain upon progressively (from top to bottom) heating to 78°C (top half) and cooling to 21°C (bottom half). Enlargements of the high-q region at more frequent temperature intervals display scattering peaks that correspond to the HC rotator phase (red) and equilibrium crystalline phase (black) for HC20 (b, c) and HC30 (d, e). Arrows indicate the progression of each dataset:
heating (b, d) and cooling (c, e)...256 Figure B.3. (a) Combined SAXS/WAXS profiles for a 20/80 w/w TPE/HC20 blend
cycled from 20°C (bottom) to 80°C (top) with the cycle numbers labeled. (b) Integrated high-q (red) and low-q (black) peak intensities over the 20 cycles shown in (a) with the cycle numbers labeled. The
low-q integrated peak intensities in (b) are shifted vertically for clarity. ...257 Figure B.4. Thermal actuation of a bilayered SMPB laminate following biaxial
deformation. Details regarding the laminate composition are provided in the text. Upon heating above Tm,1, the top film recovers while the
bottom film does not, resulting in an out-of-plane gripping action.
Heating above Tm,2 promotes full recovery of the initial shape. ...258 Figure B.5. (a) DSC thermograms measured at different tackifying resin
w/w TPE/HC20 SMPB. (b) Values of Tm and crystallinity (Xc,blend and
Xc,cryst) presented as functions of wTR (color-coded). While the solid and
dashed lines in (b) are intended to serve as guides for the eye, both Tm
and Xc,blend appear to decrease linearly with increasing wTR. The shaded
region identifies the range of Xc,cryst for SMPBs that are capable of
fixing a temporary strain state. ...259 Figure B.6. In (a) and (b), photographs of a 20/80 w/w TPE/HC20 SMPB are
displayed at the start (crystalline, opaque) and end (amorphous, transparent), respectively, of a shape-recovery test. Specimen lengths are measured along the y-axis, and the corresponding optical density profiles are included in (c), wherein the film lengths are indicated
(arrows). ...260 Figure B.7. Reproducibility of strain recovery kinetics indicated by independent
replicates (red and black points) of ternary blends with 20 wt% SEBS and different TR loading levels (labeled). The number of data points has
CHAPTER 1
The Thermoplastic Elastomer Revolution:
Functionality and Responsiveness
Abstract
1.1. Introduction
Thermoplastic elastomers (TPEs) began their history as prevalent materials in the mid-20th century when scientists at ICI and Du Pont were independently working on condensation copolymers (i.e. copolyesters and copolyurethanes) and discovered that their products had relatively high achievable strain, elasticity, and toughness.1 The “virtually cross-linked”2 materials found nearly immediate success in the fiber industry under trademarks, such as Lycra®, but the nanoscale infrastructure accounting for their mechanical properties was not entirely understood. The identity of the utilized copolymers led many to believe that it may be related to their polarity or hydrogen bonding.3 However, it was eventually proven that TPEs owe their array of beneficial properties simply to the presence of hard and soft segments along the polymer backbone.4 It was the same study that introduced the first, entirely nonpolar TPE, [styrene-b-butadiene-b-styrene] (SBS), into the discussion. This expanded the number of possible TPEs to a nearly endless list of hard and soft segment combinations. Eventually, a complete description of the hard and soft segment roles within the TPE infrastructure was pieced together and has since become unanimously accepted.
1.1.1. TPE Fundamentals
midblock. The endblocks, which must be the hard component, form the aforementioned physical cross-links by segregating from the soft segments via crystallization or thermodynamic demixing followed by vitrification.6 The soft, liquid-like midblocks are tethered at both ends to the hard A-rich domains due to the interblock covalent linkages resulting in two possible chain conformations. Chains that connect two separate A-rich domains are deemed bridges and account for much of the TPE elasticity.7,8 Alternatively, chains that are bound at both ends to the same A-rich domain are called loops (Figure 1.1a), and can also contribute to elasticity and strength through entanglement and interlocking with other chains due to the high midblock concentration in the B-rich domain.9 Comparison with AB diblock chain conformations further solidifies the concept of physical cross-linking in ABA triblock copolymers. The absence of a second hard, A block yields B blocks that are tethered at a single end providing no connection between the hard domains (Figure 1.1b). This key difference has been confirmed to be the major cause of the significantly higher elasticity and extendability in triblock TPEs.10 In fact, studies by Spontak et al.11–14 on asymmetric A1BA2 triblock copolymers with progressively longer A2 blocks show that
triblock like behavior, which is exhibited above a critical A2 block length, accounts for the
The addition of solvents, homopolymers, particles, or other components to TPEs can have a variety of desired impacts without destroying their physically cross-linked networks. As will be made more clear below, care must be taken when these various additives are included such that the hard, endblock domains do not become plasticized. For example, incorporation of a soft block selective solvent yields a TPE gel (TPEG) with tunable mechanical properties based on the composition of solvent in the TPEG.16–18 The selectivity of the solvent leads to its exclusive segregation in the soft domains and leaves the vital hard domain cross-links entirely unaffected.19 Hard additives such as metallic nanoparticles may also be incorporated into TPEs, but can have the capability to reside anywhere within the mechanical infrastructure as long as the hard block domains are not mechanically compromised.20,21 Blends of TPEs with hard additives will be referred to henceforth as TPE composites (TPECs).
It is clear that the number of possible TPEs, TPEGs, and TPECs are exponential due to the possible hard and soft segment combinations, as well as the variety of potential additives. The copolymer architecture, which can vary from three to ~10 blocks22 and can be made more complex through the use of graft23 and mikto-arm star24 geometries, can moreover effect the final properties. In order to maintain a reasonable scope, functionality imparted to ABA triblock and ABCBA pentablock copolymer TPEs and their corresponding gels and composites are the focus of this review.
1.1.2. Block Copolymer Self-Assembly
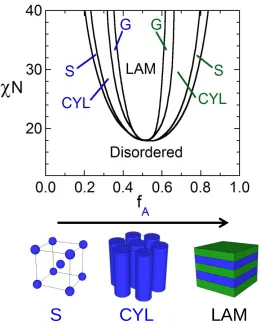
nanoscale features.25 The force that drives demixing in these systems and contributes to the specific morphological features formed is the interblock thermodynamic incompatibility, which is commonly described by the product χN where χ is the Flory-Huggins interaction
parameter between the blocks and N is the statistical number of repeat units per polymer chain.26 Nearly all A-B block pairs present in TPEs exhibit sufficiently high χN to provide segregation of the blocks and produce ordered nanoscale domains.27 The resultant domain morphology, however, is also significantly dependent on the fraction of each block (fA and fB
[=1-fA]). Upon increasing fA from a low value, the copolymer equilibrium self-assembly
transitions from A-rich spheres on a BCC-lattice within a B-rich matrix to hexagonally-packed A-rich cylinders within a B-rich matrix to the bicontinuous gyroid and finally to alternating lamellae when fA→0.5.28 Following the crossover of fA to the majority fraction,
the same morphological progression occurs in the reverse order and with B-rich spheres and cylinders residing in an A-rich matrix (Figure 1.2). The morphology can further be altered through the incorporation of a single29 or multiple30,31 endblock- or midblock-selective additives that swell their inclusive domains altering the effective fractions of the blocks and thus changing the morphology accordingly.
blocks requires more independent variables to define the system (χAB, χBC, χAC, fA, and fB).
Therefore, less design formalisms have been calculated or experimentally produced for the morphological transitions in ABCBA pentablock copolymers, though this factor has not inhibited their exploration as functional TPEs.
1.2. Functional TPE Progress
Progress made on TPEs, TPEGs, and TPECs in the 21st century has shifted a significant focus to their broad functionality, which is accessed through means of novel TPE synthesis, gel and blend formulation, and combinations thereof. TPE-based material advancement includes optical, thermal, and electrical responsiveness, electrical and ionic conductivity, material transport, and environmentally friendly synthesis and decomposition. Recent literature highlighting each of these functional areas will be presented below.
1.2.1. Optical Functionality
Alternatively, materials that change their optical properties upon other stimuli have focused on mechanochromic responses (i.e. appearance change due to mechanical stimulus). One example49 does so by synthesizing a poly[styrene-b-(n-butyl acrylate)-b-styrene] triblock copolymer containing a single spiropyran (SP) functional group in the center of the midblock. The SP group’s weak spiro carbon-oxygen bond can be mechanically broken
under sample strain to convert the yellowish precursor to its ring opened form, merocyanine (MC), which exhibits a purplish color (Figure 1.3). A second case50 incorporates hydrocarbon-coated gold nanorods into SBS. Initially, the random orientation of gold nanorods results in polarization independent absorption of near infrared (NIR) light. However, upon straining the sample up to 400% the nanorods align causing the NIR absorption to be highly polarization dependent. The high elasticity of the SBS and minimal diffusion of gold nanorods makes the alignment reversible by simply cycling the induced strain.
1.2.2. Thermal Responsiveness
physical cross-links formed by the hard blocks. The temporary network(s), on the other hand, must be located outside of the physical cross-links and have been formulated by various routes.
The first TPE applied in a tSMP varied only slightly in structure from conventional SBS. The polybutadiene midblock was polymerized under controlled conditions such that it was mostly present (80-95%) in the trans-1,4 isomer form, and therefore crystallizes at Tm≈40-65
°C.52 The elastic TPE network maintains structural integrity even when the polybutadiene is molten, and the reversibility of the polybutadiene melting can lock in rigid temporary shapes that are recovered simply by melting and allowing the TPE network to snap back to its permanent shape. One main limitation of crystalline SBS tSMPs is the small temperature range at which they can be operated (between polybutadiene Tm and polystyrene Tg≈95 °C).
Synthetically designed TPEs, such as poly[(2-methyl-2-oxazoline)-b-(tetramethylene oxide)-b-(2-methyl-2-oxazoline)], have greatly widened the operating range to span from ≈25 °C to 130 °C.53 Other bulk TPE systems have sought specialty thermomechanical responses that do not require induced deformation. One example involves a telechelic TPE with a midblock composed of main-chain azobenzene groups that form a similar nematic phase to those discussed in the previous section.54 Much like UV irradiation, the addition of thermal energy causes a transition from the nematic liquid crystalline phase to an isotropic state subsequently resulting in macro-scale actuation, which is reversible upon cooling.
SEBS57,58 result in similar actuating materials to those described above. However, these materials have the additional advantage of enabling multiple shape memory in a single TPEC. This is accomplished through judicious selection of hydrocarbon waxes such that the melting points are far enough apart that co-crystallization is avoided and therefore multiple temporary networks are present. These TPE blends have been shown to exhibit triple (Figure 1.4) and even quadruple shape memory behavior with high fixity of the temporary shapes and high recovery of the permanent shape.55,56
1.2.3. Electro-Actuation
with and without prestrain, respectively. The next advances came from attempts to create a higher dielectric medium, which theoretically translates to a stronger electric field across the film at constant applied voltage. These attempts include utilization of polar TPEs such as maleated-SEBS65 and various all-acrylic TPEs (e.g. poly[(methyl methacrylate)-b-(n-butyl acrylate)-b-(methyl methacrylate)] (MBM))64,66–68, as well as polar additives like di-octyl phthalate (DOP)67, dibutyl sebacate (DBS) and oligomeric poly(n-butyl acrylate)69. The most promising example of which (45/55 wt/wt MBM/DOP) extended the highest achieved prestrain-free areal actuation in TPEs to ≈120%.64,67
difficult due to inconsistencies in the experimental approach (i.e. absence of a normalized measurement of actuation). The most recent set of studies has utilized a midblock sulfonated pentablock copolymer, Nexar®, in combination with a number of solvents and fillers. Successful examples include incorporation of midblock-selective sulfonated montmorillonite76 and ionic liquid77,78. Other instances incorporate ethylene glycol and glycerol into Li+-exchanged Nexar®64,79 resulting in a lower ionic concentration and consequently a slower response, but with one of the highest overall actuations ever captured for an IPMC (Figure 1.6).
1.2.4. Conductivity & Transport
Electrical conductivity has been imparted into normally insulating TPEs through the incorporation of conductive nano-fillers. In this thrust, conductive TPECs have been produced from carbon nanotube/SBS mixtures prepared by melt extrusion80 and hydrocarbon-functionalized polyaniline (hPANI)/SEBS mixtures through solvent casting81,82. Carbon nanotube/SBS composite conductivities were shown to relate directly to their degree of uniaxial deformation, whereas hPANI/SEBS composite conductivities were related to compressive stress. Therefore, either composite could successfully serve as an electric strain sensor. Additional paths to electric strain sensors rely on the facile processability of TPEs and TPEGs to create microchannels in molded films or extruded fibers83 followed by filling with a liquid metal. These devices have shown electrical continuity up to high as 600-700% strain83,84 (Figure 1.7).
SEBS-type TPEs has been accomplished on multiple occasions.85,86 The presence of bound –SO3
Application of TPEs with high ionic conductivity extends beyond the realm of cation and anionic fuel cell membranes. The incorporation of dye molecules into conductive TPEGs has also resulted in competitive solar cell electrolytes. For example, TPEGs composed of poly[styrene-b-(ethylene oxide)-b-styrene] (SOS)/ionic liquid104 and Nexar®/H2O105,106, each
containing Ru2+-based dye, have achieved solar efficiencies of ≈2.5% and ≈7.0%, respectively (Figure 1.8a). The thermodynamic gel-stability of these TPEGs also greatly enhances their operational lifetime (Figure 1.8b) as compared to liquid-based electrolytes, which have a tendency to dissolve or degrade the cell sealant and leach into the environment over time.104
The production of polar and ionic TPEs and TPEGs also translates to intriguing material transport properties due to their favorable interactions with polar molecules and salts. The midblock sulfonated pentablock TPE, Nexar®, has proven especially promising in this regard as indicated by water vapor transmission rate measurements as high as 20-25 kg/m2/day107,108. The same material also competes with non-TPEs as a water desalination membrane due to the high water affinity.109–112 Other systems, such as bulk SOS113, SOS blended with poly[ethylene glycol]113, and SOS/ionic liquid TPEGs 114 present a high affinity for CO2 gas over H2, which enables their consideration as reverse-selective gas membranes.
1.2.5. Environmentally Responsible
(H2O, pH 7.4, T=37 °C) are invaluable functionalities. Most importantly, these attributes
support the current green direction that research and industry are moving towards.27
The biggest effort in the synthesis of renewably-resourced TPEs has focused on the use of both crystalline and glassy polylactide (PLA) endblocks. The initial studies combined PLA endblocks with conventional midblocks including polyisobutylene115, poly(dimethyl siloxane)116, and polyisoprene117,118. The latter case, which was the only one tested for mechanical properties, indicated elasticity and elongation (up to 600%118) reminiscent of conventional TPEs. However, each of these examples utilizes renewable-resource monomers for only a portion of the copolymer. Other works have replaced the midblock with renewable derivatives to create entirely biorenewable TPE options (Figure 1.9).119–125 Of these, Hillmyer et al.124 showed that entirely amorphous PLA-b-polymenthide-b-PLA (PLA-PM-PLA) has reasonable potential as a pressure-sensitive adhesive, which is a frequent application for TPEs. Mechanical data from these studies further support the goal that renewable TPEs closely imitate their conventional analogs (e.g. high extendability [~1000%] and sufficient Young’s modulus and ultimate strength), but they are limited in comparisons regarding thermal aspects (e.g. crystalline PLA’s susceptibility to thermal history and amorphous PLA’s relatively low Tg≈60 °C). More recently, other endblock options have built
upon these results by replacing PLA with glassy, higher-Tg alternatives that more closely
One added benefit of synthesizing TPEs using renewable monomers is that the products typically have a higher rate and quantity of environmental degradation compared with conventional analogs; the degradation products also have a less negative impact on the environment. Glassy, as opposed to crystalline endblock domains are especially important for degradation due to their markedly lower diffusional barriers to small molecules.122 Two of the renewable-resourced TPEs discussed above122,130 have been shown to have rapid hydrolytic degradation as evidenced by a significant decrease in molecular weight (≈30-50% decrease) and a reasonable decrease in sustained mass (≈20% decrease) in only 10-20 wks. Hillmyer et al.122 further postulate that increasing the TPE hydrophilicity may lead to even quicker and more complete degradation due to increased water presence in the copolymer.
1.3. Summary
Figure 1.2. An ABA triblock copolymer phase diagram reproduced from 28 where S, CYL, G, and LAM represent the body-centered cubic sphere, hexagonally-packed cylinder, gyroid, and lamellar morphologies. Depictions of the corresponding classical morphologies are also included.
Figure 1.4. The triple shape memory behavior achieved by 56 using a poly[styrene-b-(ethylene-co-propylene)-b-styrene] (SEBS) TPE in combination with two waxes (Tm,1 =
32°C, Tm,2 ≈ 61°C). The sample was heated to T > Tm,2 > Tm,1 (a) where it was twisted a half
turn, cooled to Tm,2 > T > Tm,1 (b) where it was twisted another half turn, and then cooled to
Tm,2 > Tm,1 > T (c). Each half twist is then recovered individually by heating to the same
Figure 1.7. Images of a SEBS extruded hollow fiber subsequently filled with liquid metal at 0% (a) and 900% (b) uniaxial strain, as well as normalized resistance data (R/R0 where R and
R0 are the resistances at a given strain and at 0% strain, respectively) as a function of strain
(c) for a molded microchannel (□)84
Figure 1.8. Photocurrent-density as a function of voltage for Ru2+-dyed TPEGs: poly[styrene-b-(ethylene oxide)-b-styrene]/ionic liquid (SOS/IL) and Nexar®/H2O (a), and a
1.4. References
1. N. R. Legge, G. Holden, H. E. Schroeder. Thermoplastic Elastomers: A Comprehensive Review, Hanser Publishers: Munich, 1987.
2. C. S. Schollenberger, H. Scott, G. R. Moore. Rubber Chem. Technol. 1962, 35(3), 742– 752.
3. W. H. Charch, J. C. Shivers. Text. Res. J. 1959, 29(7), 536–540. 4. S. L. Cooper, A. V. Tobolsky. Text. Res. J. 1966, 36(9), 800–803.
5. G. Holden. Thermoplastic Elastomers, Hanser Publishers: Munich, 2004.
6. R. J. Spontak, N. P. Patel. Curr. Opin. Colloid Interface Sci. 2000, 5(5–6), 333–340. 7. K. Karatasos, S. H. Anastasiadis, T. Pakula, H. Watanabe. Macromolecules 2000,
33(2), 523–541.
8. S. S. Tallury, R. J. Spontak, M. A. Pasquinelli. J. Chem. Phys. 2014, 141(24), 244911. 9. H. Watanabe, T. Sato, K. Osaki, M.-L. Yao, A. Yamagishi. Macromolecules 1997,
30(19), 5877–5892.
10. C. Y. Ryu, M. S. Lee, D. A. Hajduk, T. P. Lodge. J. Polym. Sci. B 1997, 35(17), 2811– 2823.
11. M. W. Hamersky, S. D. Smith, A. O. Gozen, R. J. Spontak. Phys. Rev. Lett. 2005, 95(16), 168306.
12. S. D. Smith, M. W. Hamersky, M. K. Bowman, K. O. Rasmussen, R. J. Spontak. Langmuir 2006, 22(15), 6465–6468.
14. S. S. Tallury, K. P. Mineart, S. Woloszczuk, D. N. Williams, R. B. Thompson, M. A. Pasquinelli, M. Banaszak, R. J. Spontak. J. Chem. Phys. 2014, 141(12), 121103. 15. K. Ø. Rasmussen, E. M. Kober, T. Lookman, A. Saxena. J. Polym. Sci. B 2003, 41(1),
104–111.
16. J. H. Laurer, J. F. Mulling, S. A. Khan, R. J. Spontak, R. Bukovnik. J. Polym. Sci. B 1998, 36(13), 2379–2391.
17. J. H. Laurer, J. F. Mulling, S. A. Khan, R. J. Spontak, J. S. Lin, R. Bukovnik. J. Polym. Sci. B 1998, 36(14), 2513–2523.
18. T. L. Chantawansri, T. W. Sirk, Y. R. Sliozberg. J. Chem. Phys. 2013, 138(2), 024908– 024908–10.
19. A. S. Krishnan, K. E. Roskov, R. J. Spontak. In Adv. Nanomater, Wiley-VCH: Weinheim, 2010, pp. 791–834.
20. M. R. Bockstaller, Y. Lapetnikov, S. Margel, E. L. Thomas. JACS 2003, 125(18), 5276–5277.
21. M. R. Bockstaller, R. A. Mickiewicz, E. L. Thomas. Adv. Mater. 2005, 17(11), 1331– 1349.
22. D. J. Arriola, E. M. Carnahan, P. D. Hustad, R. L. Kuhlman, T. T. Wenzel. Science 2006, 312(5774), 714–719.
23. Y. Chen, A. M. Kushner, G. A. Williams, Z. Guan. Nat. Chem. 2012, 4(6), 467–472. 24. W. Shi, N. A. Lynd, D. Montarnal, Y. Luo, G. H. Fredrickson, E. J. Kramer, C. Ntaras,
26. I. W. Hamley. The Physics of Block Copolymers, Oxford University Press: New York, 1998.
27. J. G. Drobny. Handbook of Thermoplastic Elastomers, William Andrew: Norwich, 2007.
28. M. W. Matsen, R. B. Thompson. J. Chem. Phys. 1999, 111(15), 7139–7146.
29. J. H. Laurer, R. Bukovnik, R. J. Spontak. Macromolecules 1996, 29(17), 5760–5762. 30. N. R. Jackson, E. A. Wilder, S. A. White, R. Bukovnik, R. J. Spontak. J. Polym. Sci. B
1999, 37(15), 1863–1872.
31. A. S. Krishnan, S. D. Smith, R. J. Spontak. Macromolecules 2012, 45(15), 6056–6067. 32. F. S. Bates, M. A. Hillmyer, T. P. Lodge, C. M. Bates, K. T. Delaney, G. H.
Fredrickson. Science 2012, 336(6080), 434–440.
33. X. Ye, X. Yu, T. Shi, Z. Sun, L. An, Z. Tong. J. Phys. Chem. B 2006, 110(46), 23578– 23582.
34. H.-H. Liu, C.-I. Huang, A.-C. Shi. Macromolecules 2015, 48(17), 6214–6223. 35. H. Ott, V. Abetz, V. Altstadt. Macromolecules 2001, 34(7), 2121–2128.
36. H. Jinnai, T. Kaneko, K. Matsunaga, C. Abetz, V. Abetz. Soft Matter 2009, 5(10), 2042–2046.
37. E. Roy, M. Geissler, J.-C. Galas, T. Veres. Microfluid. Nanofluidics 2011, 11(3), 235– 244.
38. A. P. Sudarsan, J. Wang, V. M. Ugaz. Anal. Chem. 2005, 77(16), 5167–5173.
41. X. Tang, L. Gao, X. Fan, Q. Zhou. J. Polym. Sci. A 2007, 45(22), 5190–5198. 42. Z.-Z. Tong, J.-Q. Xue, R.-Y. Wang, J. Huang, J.-T. Xu, Z.-Q. Fan. RSC Adv. 2014,
5(6), 4030–4040.
43. T. Rajasekhar, M. Trinadh, R. Sahoo, S. Dhara, A. V. S. Sainath. Des. Monomers Polym. 2015, 18(2), 145–156.
44. X. Wang, J. Vapaavuori, Y. Zhao, C. G. Bazuin. Macromolecules 2014, 47(20), 7099– 7108.
45. W. Deng, P.-A. Albouy, E. Lacaze, P. Keller, X. Wang, M.-H. Li. Macromolecules 2008, 41(7), 2459–2466.
46. M. Petr, B. Katzman, W. DiNatale, P. T. Hammond. Macromolecules 2013, 46(7), 2823–2832.
47. M. Ilčíková, M. Mrlík, T. Sedláček, D. Chorvát, I. Krupa, M. Šlouf, K. Koynov, J. Mosnáček. Polymer 2014, 55(1), 211–218.
48. M. Ilčíková, M. Mrlík, T. Sedláček, M. Šlouf, A. Zhigunov, K. Koynov, J. Mosnáček. ACS Macro Lett. 2014, 3(10), 999–1003.
49. S. Jiang, L. Zhang, T. Xie, Y. Lin, H. Zhang, Y. Xu, W. Weng, L. Dai. ACS Macro Lett. 2013, 2(8), 705–709.
50. H. Pletsch, M. Tebbe, M. Dulle, B. Förster, A. Fery, S. Förster, A. Greiner, S. Agarwal. Polymer 2015, 66, 167–172.
53. P. V. Caeter, E. J. Goethals, V. Gancheva, R. Velichkova. Polym. Bull. 1997, 39(5), 589–596.
54. S. V. Ahir, A. R. Tajbakhsh, E. M. Terentjev. Adv. Funct. Mater. 2006, 16(4), 556–560. 55. S. Song, J. Feng, P. Wu. Macromol. Rapid Commun. 2011, 32(19), 1569–1575.
56. Q. Zhang, S. Song, J. Feng, P. Wu. J. Mater. Chem. 2012, 22(47), 24776–24782. 57. L. Xu., 2012, US Patent US 20140110880 A1, 2014.
58. H. Zhang, H. Wang, W. Zhong, Q. Du. Polymer 2009, 50(6), 1596–1601. 59. R. Shankar, T. K. Ghosh, R. J. Spontak. Soft Matter 2007, 3(9), 1116–1129. 60. R. Shankar, T. K. Ghosh, R. J. Spontak. Macromol. Rapid Commun. 2007, 28(10),
1142–1147.
61. R. Shankar, T. K. Ghosh, R. J. Spontak. Adv. Mater. 2007, 19(17), 2218–2223.
62. R. Shankar, A. S. Krishnan, T. K. Ghosh, R. J. Spontak. Macromolecules 2008, 41(16), 6100–6109.
63. R. Shankar, T. K. Ghosh, R. J. Spontak. Sens. Actuators Phys. 2009, 151(1), 46–52. 64. P. H. Vargantwar, R. Shankar, A. S. Krishnan, T. K. Ghosh, R. J. Spontak. Soft Matter
2011, 7(5), 1651–1655.
65. B. Kim, Y. D. Park, K. Min, J. H. Lee, S. S. Hwang, S. M. Hong, B. H. Kim, S. O. Kim, C. M. Koo. Adv. Funct. Mater. 2011, 21(17), 3242–3249.
66. Y. Jang, T. Kato, T. Ueki, T. Hirai. Sens. Actuators Phys. 2011, 168(2), 300–306. 67. P. H. Vargantwar, A. E. Oezcam, T. K. Ghosh, R. J. Spontak. Adv. Funct. Mater. 2012,
68. K. Y. Cho, S. S. Hwang, H. G. Yoon, K.-Y. Baek. J. Polym. Sci. A 2013, 51(9), 1924– 1932.
69. Y. Jang, T. Hirai, T. Ueki, T. Kato. Polym. Int. 2012, 61(2), 228–234.
70. M. Shahinpoor, Y. Bar-Cohen, J. O. Simpson, J. Smith. Smart Mater. Struct. 1998, 7(6), R15.
71. X.-L. Wang, I.-K. Oh, J. Lu, J. Ju, S. Lee. Mater. Lett. 2007, 61(29), 5117–5120. 72. J.-Y. Jung, I.-K. Oh. J. Nanosci. Nanotech. 2007, 7(11), 3740–3743.
73. X.-L. Wang, I.-K. Oh, J.-B. Kim. Compos. Sci. Technol. 2009, 69(13), 2098–2101. 74. M. D. Green, D. Wang, S. T. Hemp, J.-H. Choi, K. I. Winey, J. R. Heflin, T. E. Long.
Polymer 2012, 53(17), 3677–3686.
75. S. Imaizumi, H. Kokubo, M. Watanabe. Macromolecules 2012, 45(1), 401–409. 76. J.-W. Lee, S. M. Hong, J. Kim, C. M. Koo. Sens. Actuators B Chem. 2012, 162(1),
369–376.
77. J.-W. Lee, J. H. Lee, M. Kim, S. M. Hong, C. M. Koo. J. Nanosci. Nanotech. 2013, 13(5), 3606–3610.
78. J.-W. Lee, S. M. Hong, C. M. Koo. Res. Chem. Intermed. 2014, 40(1), 41–48. 79. P. H. Vargantwar, K. E. Roskov, T. K. Ghosh, R. J. Spontak. Macromol. Rapid
Commun. 2012, 33(1), 61–68.
80. P. Costa, C. Silvia, J. C. Viana, S. Lanceros Mendez. Compos. Part B Eng. 2014, 57, 242–249.
82. G. M. O. Barra, R. R. Matins, K. A. Kafer, R. Paniago, C. T. Vasques, A. T. N. Pires. Polym. Test. 2008, 27(7), 886–892.
83. S. Zhu, J.-H. So, R. Mays, S. Desai, W. R. Barnes, B. Pourdeyhimi, M. D. Dickey. Adv. Funct. Mater. 2013, 23(18), 2308–2314.
84. K. P. Mineart, Y. Lin, S. C. Desai, A. S. Krishnan, R. J. Spontak, M. D. Dickey. Soft Matter 2013, 9(32), 7695–7700.
85. R. A. Weiss, A. Sen, C. L. Willis, L. A. Pottick. Polymer 1991, 32(10), 1867–1874. 86. R. A. Weiss, A. Sen, L. A. Pottick, C. L. Willis. Polymer 1991, 32(15), 2785–2792. 87. Y. A. Elabd, E. Napadensky, J. M. Sloan, D. M. Crawford, C. W. Walker. J. Membrane
Sci. 2003, 217(1-2), 227–242.
88. Y. A. Elabd, C. W. Walker, F. L. Beyer. J. Membrane Sci. 2004, 231(1-2), 181–188. 89. Y. A. Elabd, E. Napadensky, C. W. Walker, K. I. Winey. Macromolecules 2006, 39(1),
399–407.
90. S. Gauthier, A. Eisenberg. Macromolecules 1987, 20(4), 760–767.
91. J. P. Gouin, C. E. Williams, A. Eisenberg. Macromolecules 1989, 22(12), 4573–4578. 92. R. Vinodh, A. Ilakkiya, S. Elamathi, D. Sangeetha. Mater. Sci. Eng. B 2010, 167(1),
43–50.
93. Q. H. Zeng, Q. L. Liu, I. Broadwell, A. M. Zhu, Y. Xiong, X. P. Tu. J. Membrane Sci. 2010, 349(1–2), 237–243.
96. P. H. Vargantwar, M. C. Brannock, S. D. Smith, R. J. Spontak. J. Mater. Chem. 2012, 22(48), 25262–25271.
97. M. L. Disabb-Miller, Z. D. Johnson, M. A. Hickner. Macromolecules 2013, 46(3), 949– 956.
98. P. H. Vargantwar, M. C. Brannock, K. Tauer, R. J. Spontak. J. Mater. Chem. A 2013, 1(10), 3430–3439.
99. H.-Q. Xie, Y. Chen, J.-G. Guan, D. Xie. J. Appl. Polym. Sci. 2006, 99(4), 1975–1980. 100. M. D. Green, J.-H. Choi, K. I. Winey, T. E. Long. Macromolecules 2012, 45(11),
4749–4757.
101. Y. He, P. G. Boswell, P. Bühlmann, T. P. Lodge. J. Phys. Chem. B 2007, 111(18), 4645–4652.
102. N. P. Young, D. Devaux, R. Khurana, G. W. Coates, N. P. Balsara. Solid State Ion. 2014, 263, 87–94.
103. B. Tang, S. P. White, C. D. Frisbie, T. P. Lodge. Macromolecules 2015, 48(14), 4942– 4950.
104. J. Yoon, D. K. Kang, J. Won, J.-Y. Park, Y. S. Kang. J. Power Sources 2012, 201, 395– 401.
105. H. A. Al-Mohsin, K. P. Mineart, R. J. Spontak. Adv. Energy Mater. 2015, 5(8), 1401941.
109. G. M. Geise, B. D. Freeman, D. R. Paul. Polymer 2010, 51(24), 5815–5822.
110. G. M. Geise, L. P. Falcon, B. D. Freeman, D. R. Paul. J. Membrane Sci. 2012, 423– 424, 195–208.
111. G. M. Geise, B. D. Freeman, D. R. Paul. J. Membrane Sci. 2013, 427, 186–196.
112. G. M. Geise, C. L. Willis, C. M. Doherty, A. J. Hill, T. J. Bastow, J. Ford, K. I. Winey, B. D. Freeman, D. R. Paul. Ind. Eng. Chem. Res. 2013, 52(3), 1056–1068.
113. N. P. Patel, R. J. Spontak. Macromolecules 2004, 37(8), 2829–2838.
114. Y. Gu, E. L. Cussler, T. P. Lodge. J. Membrane Sci. 2012, 423–424, 20–26. 115. L. Sipos, M. Zsuga, G. Deák. Macromol. Rapid Commun. 1995, 16(12), 935–940. 116. S. Zhang, Z. Hou, K. E. Gonsalves. J. Polym. Sci. A 1996, 34(13), 2737–2742. 117. E. M. Frick, M. A. Hillmyer. Macromol. Rapid Commun. 2000, 21(18), 1317–1322. 118. E. M. Frick, A. S. Zalusky, M. A. Hillmyer. Biomacromolecules 2003, 4(2), 216–223. 119. S. Hiki, M. Miyamoto, Y. Kimura. Polymer 2000, 41(20), 7369–7379.
120. Z. Zhang, D. W. Grijpma, J. Feijen. Macromol. Chem. Phys. 2004, 205(7), 867–875. 121. C. L. Wanamaker, L. E. O’Leary, N. A. Lynd, M. A. Hillmyer, W. B. Tolman.
Biomacromolecules 2007, 8(11), 3634–3640.
122. C. L. Wanamaker, W. B. Tolman, M. A. Hillmyer. Biomacromolecules 2009, 10(2), 443–448.
123. C. L. Wanamaker, M. J. Bluemle, L. M. Pitet, L. E. O’Leary, W. B. Tolman, M. A. Hillmyer. Biomacromolecules 2009, 10(10), 2904–2911.
125. M. T. Martello, M. A. Hillmyer. Macromolecules 2011, 44(21), 8537–8545. 126. J. Shin, Y. Lee, W. B. Tolman, M. A. Hillmyer. Biomacromolecules 2012, 13(11),
3833–3840.
127. J. M. Bolton, M. A. Hillmyer, T. R. Hoye. ACS Macro Lett. 2014, 3(8), 717–720. 128. A. L. Holmberg, K. H. Reno, R. P. Wool, T. H. Epps. Soft Matter 2014, 10(38), 7405–
7424.
129. K. Satoh, D.-H. Lee, K. Nagai, M. Kamigaito. Macromol. Rapid Commun. 2014, 35(2), 161–167.
![Figure 1.4. The triple shape memory behavior achieved by 56 using a poly[styrene-b-(ethylene-co-propylene)-b-styrene] (SEBS) TPE in combination with two waxes (Tm,1 = 32°C, Tm,2 ≈ 61°C)](https://thumb-us.123doks.com/thumbv2/123dok_us/1775573.1228672/46.612.205.427.146.507/figure-behavior-achieved-styrene-ethylene-propylene-styrene-combination.webp)

![Figure 3.1. Snapshots of MC simulations of molecularly asymmetric A1BA2 triblock copolymers in the sSS regime revealing the existence of interstitial micelles between lamellae [(a) edge view] and perforated lamellae [(b) parallel view through the perforati](https://thumb-us.123doks.com/thumbv2/123dok_us/1775573.1228672/91.612.149.502.192.473/snapshots-simulations-molecularly-asymmetric-copolymers-interstitial-perforated-perforati.webp)