International Journal of Research (IJR)
e-ISSN: 2348-6848, p- ISSN: 2348-795X Volume 2, Issue 06, June 2015Available at http://internationaljournalofresearch.org
Numerical modeling and analytical validation of stress
intensity factor and crack velocity for SENT tensile specimen
of P265GH steel material
M.Lahlou
1; A.Hachim
2; N.Mouhib
1;H.Ouaomar
1;M.Rachik
3& M.El Ghorba
11 Laboratory of Control and Mechanical Characterization of Materials and Structures, National
Higher School of Electricity and Mechanics, BP 8118 Oasis, Hassan II University, Casablanca,
Morocco.Lahloumohammed89@gmail.com
2 ISEM/Higher Institute of Maritims Studies, Laboratory of Mechanics, Km 7 Road El Jadida
Casablanca Morocco
3RobervalLaboratory. UTC, Royallieu Research Center. Person street from Roberval,
BP20520,60205CompiègneCedex, France
Abstract
During service, most of the mechanical structures are subjected tovariable loads over time, leading to their sudden break and causing serious accidents. The life time of a mechanical structure could be divided into three stages: Stage I; the initiation, stage II; the slow-spreading and stage III; the sudden-spreading. The mechanical behavior of parts is directly related to the number of cycles before initiation and slow propagation that could occur in stress concentration zones, or simply because of manufacturing defects.
The aim of this study is to predict the lifetime
of Pressurized Structures by
modelingnumerically the evolution of the crack propagation velocity through a SENT specimen using the finite element code CASTEM2013.
The results show that the propagation velocity of crack increases by increasing the length of the crack and the stress level.
Key Words:
Notch; Finite element model; Stress; Stress intensity factor; Pressure vessels; number of cycles; Propagation Velocity; Length of Crack.
I.
INTRODUCTION
On the microscopic scale, any material has a
defect (in homogeneities, inclusions,
manufacturing defects, etc.) and any mechanical part could present section changes or rough surface states. Since these conditionsfavor the appearance of stress concentrations, we should often consider the possibility of crack initiation as well as its propagation when calculating a structure. For this reason, the designers of structures or any element subjected to cyclic loadings should not only take into account the possibility of cracking, but also estimate the velocity of crack propagation, to ensure that these cracks do not reach the critical length, which will inevitably lead to failure.
International Journal of Research (IJR)
e-ISSN: 2348-6848, p- ISSN: 2348-795X Volume 2, Issue 06, June 2015Available at http://internationaljournalofresearch.org
obtained numerically or by simplifying methods for semielliptical cracks internal or external, longitudinal or circumferential. Topper and El Haddad [5] use the stress distribution at the head of a short crack emanating from a notch, to establish the boundary conditions between the stress concentration factor theory of a blunt cut and that an acute notch.
The finite element method adopted in this paper is the most used for real applications to provide a robust solution for most industrial problems.
This work is devoted to the finite element analysis of a tensile specimen simple notched (SENT) using Castem2013[6] numerical code, through which we study the numerical crack velocity to predict the lifetime of the equipment, The material which is the subject of this research is a P265GH steel commonly used in pressure vessels.
II.
Experimentation
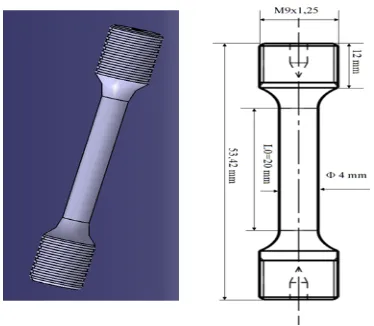
To extract the mechanical characteristics of the P265GH steel used in our program, tensile tests on standard specimens (Figure1) were conducted in different directions of rolling (longitudinal and transversal). The test curves showing the stress versus strain are given in Figure 2:
Figure 1: Dimensions of the standard test specimen
Figure 2: Stress strain curve test
By comparing the mechanical characteristics of the specimen in both rolling directions, it is found that there is a negligible difference between the two curves. The mechanical characteristics of P265GH steel, at the ambient temperature, are reported in the table1:
Table 1:Mechanical properties of the material
Young'smodu lus
E (MPa
elasticlim it: e (Pa)
Breaki ng stress:
g
(Pa)
Elongati on %
Poisso n's ratio ν
2.105 320 470 35 0,3
We notice that the elongation is about 35%, which is higher than 14% required by the CODAP [7]. Therefore, this P265GH steel used is well adapted for pressurized structures.
III.
Numericalmodeling
The calculation code Cast3m 2013 is used to construct a finite element model in order to analyze SENT specimen behavior subjected to tensile stress. In what follows, we describe FE modeling.
a. Geometry
International Journal of Research (IJR)
e-ISSN: 2348-6848, p- ISSN: 2348-795X Volume 2, Issue 06, June 2015Available at http://internationaljournalofresearch.org
specimen was subjected to tensile
solicitations.
Figure 3 : The geometry and dimensions of the studied specimen
b. Mesh and boundary conditions
By taking into consideration the symmetry of the problem, only half of the test specimen is discretized. Because the numerical results are intended for analysis of fracture mechanics, special attention is paid to mesh principally in crack and its vicinity (Mesh Refinement using Barsoum elements).[8]. Details of the mesh are illustrated in Figure 4 and Figure 5.
Figure 4: Mesh Figure 5: Mesh in the vicinity of a notch
c.Loading
The simulated load is a tensile solicitation along the longitudinal axis of the specimen. To avoid bending or twisting parasite and to ensure that the tensile stress is perfectly aligned; it is applied on the specimen via a rigid triangle indicated by the arrow 4. The selected loads are calibrated in such a way that the applied nominal stresses are respectively 148 MPa, 284MPa and 356MPa.
IV.
Results and discussion
a. Evolution of crack velocity
according to length of notch
When a crack is formed, its length increases in proportion to the increase of cyclesnumber. The crack velocity is determined by the equation (1):
da/dN= C (ΔK)m(1)
with:
da / dN: The crack velocity (where a is the crack length and N is the number of applied cycles)
ΔK: stress intensity factor [9]
C and m: constants of materials
According to the equation (1), it is clear that the crack velocityincreases constantly until the sudden break of the part.
Cracking is generally described by the following macroscopic three stages:
a) Stage I (propagation velocity less than 10 -5mm / cycle)
b) Stage II (propagation velocity is between 10-5 and 10-3 mm / cycle)
c) Stage III (rapid spread leading to sudden break than 10-3 mm / cycle).
International Journal of Research (IJR)
e-ISSN: 2348-6848, p- ISSN: 2348-795X Volume 2, Issue 06, June 2015Available at http://internationaljournalofresearch.org
The curves in Figure 6 illustrate the evolution of crack velocity for the three levels of applied stress: Δσ = 148 MPa, 284MPa, 356MPa
Figure 6 : The crack velocity for the three applied stresses (Δσ = 356MPa, 284MPa, 148MPa)
• A low level of stress (Δσ = 148 MPa), the crack velocity is practically located between 10-5 and 2x10⁻⁴mm/ cycle, which corresponds mainly to the end of stage I and stage II of crack propagation.
• At a medium level of stress (Δσ = 284 MPa), the crack velocity is practically located between 4x10⁻⁵ and 2x10⁻³ mm / cycle, which corresponds to stage II propagation and early stage III.
• A high level of stress (Δσ = 356 MPa), the crack velocity is in the range 1,1x10⁻⁴ and 2,4x10⁻³ mm / cycle, the propagation is mainly in stage II and stage III.
The analysis of these results shows that there is a significant increase in crack velocity according to the crack length.
b. Comparison of the crack velocity
according to stress levels
The curves in Figure 7 show the comparison of crack velocity, for three levels of applied stresses: Δσ = 148 MPa, 284MPa, 356MPa.
Figure 7 : Comparison of the crack velocity according to stress levels (Δσ = 356MPa, 284MPa, 148MPa)
International Journal of Research (IJR)
e-ISSN: 2348-6848, p- ISSN: 2348-795X Volume 2, Issue 06, June 2015Available at http://internationaljournalofresearch.org
c. Evolution of the numerical crack
velocity depending on the variation
of the stress intensity factor
Figure 8 illustrates the evolution of the numerical velocity logarithm as a function of stress intensity factor for the three applied stresses (Δσ = 148 MPa, 284MPa, 356MPa.)
Figure 8 : Comparison of the crack velocity for three applied stresses
According to Figure 8, it is noticed that:
Even if the load varies, the
representative points of the crack velocity log (da / dN) according to log (ΔK) are located on the same line (linear part), it is regime 2 called regime of Paris.
The values of (log (da / dN), log (ΔK)) increase when the load increases.
There is a gradual acceleration of the crack velocity when thevalues of the stress intensity factor approach the critical value (KIC value where there is a sudden break of the specimen).
V.
Conclusion
A numerical finite element analysis (using the Cast3m2013 code) of SENT specimen loaded in mode I, was carried out for three levels of nominal stress. Results show that the crack velocity varies with the intensity of the applied stress and also according to the
progress of the crack length. For a relatively low nominal stress level about 50% (148 MPa) of the elastic limit, the crack velocity is practically located between 10-5 and 1.2x10⁻⁴ mm / cycle. For a higher stress level about 90% of the elastic limit, the velocity of cracking increases in the interval between 4x10⁻⁵ and 1,2x10⁻³ mm / cycles. For the highest stress level about 110% of the elastic limit, the crack velocity is practically located between 1,1x10⁻⁴ et 2,4x10⁻³ mm/cycle mm / cycle
References:
[1.]A. Hachim, "Etude numérique et
validation expérimentale des
mécanismes d’endommagement et de fissuration de l’acier S355" : application aux équipements sous pression, Mémoire de thèse doctorat,
Faculté des
Sciences-AïnChock,Casablanca, 27/04/2013
[2.]A. Hachim,"Numerical Evaluation and Experimental Validation of Stress Concentration and Crack Propagation
a Bi-notched Specimen of Steel S355",
International Journal of Research and Reviews in Mechatronic Design and Simulation (IJRRMDS) Vol. 2, No. 3, September 2012.PP 58-64
[3.]Yoshihara, H., 2013: "Mode II critical stress intensity factor of medium-density fi berboard measured by asymmetric four-point bending tests
and analyses of kink crack formation".
BioResources 8 (2): 1771-1789.
[4.]A. El Hakimi, P. Le Grognec , S. Hariri"Numerical and analytical study of severity of cracks in cylindrical and
spherical shells" Engineering Fracture
International Journal of Research (IJR)
e-ISSN: 2348-6848, p- ISSN: 2348-795X Volume 2, Issue 06, June 2015Available at http://internationaljournalofresearch.org
[5.]Topper T.H., Haddad M.H.,"Fatigue strength prediction of notches based
on fracture thresholds", 1st int. Conf,
Stockholm ,Vol2, EMAS, Warley ,U.K,pp 777-797,1981.
[6.]Cast3M, code d'éléments finis, CEA: http://www-cast3m.cea.fr/ CODAP: Code de Construction des Appareils à Pression non soumis à la flame 2005
[7.]Barsoum,"Furthur application of quadratic isoparametric elements to linear fracture mechanics of plate
bending and general shells".
Int.J.Num.Meth,Engng , 11,167-169. (1976).
[8.]LAHLOU, M., et al. "Numerical modeling and analytical validation of stress and stress intensity factor for SENT tensile specimen of P265GH
steel material."IPASJ International