Design of a Two-channel Instrument to
Record Lung and Heart Sounds
Simultaneously and Separate Them Using
ANC–NLMS Algorithm
Noman Qaid Al-Naggar
1, Hamdi H. Ghazi
2Associate professor, Dept. of BME, Faculty of Engineering, UST, Yemen 1
Teacher, Dept. of BME, Faculty of Engineering, UST, Yemen 2
ABSTRACT: An effective lung sound (LS) recording instrument plays a major role in the diagnostic field because it can extract many types of information, such as symptoms or markers, to achieve various LS pathologies. This study proposes to develop a two-channel instrument (electronic stethoscope) for recording heart sound (HS), reference signal, and original signal (which includes LS and HS) simultaneously from the same subject. These recorded signals provide input requirements of adaptive noise cancellation (ANC) filter used for separating the original signal (LS+HS) and reference signal (HS). Normalized least mean square (NLMS) algorithm is applied to operate efficiently with two signals recorded at the same time because its computation is faster than that of LMS algorithm. A two-channel instrument is subjected to the specific requirements of heart and lung sounds, particularly in sensors and pre-amplification and filtering. Consequently, the designed instrument and ANC–NLMS algorithm demonstrated corresponding observed on uniformity and components (peaks, phases, and time delay) of original and reference signals before and after separating HS. The obtained pure LS signal maintained its uniformity and time delay. In addition, the performance of the proposed method is verified using power spectral density (PSD) of signals, as follows: the original (LS+HS), separated HS, reference HS, and obtained pure LS before and after separation. The PSD showed the difference of these signals in terms of average power and different frequency ranges of LS pathology. The designed instrument and ANC–NLMS algorithm obtained efficient and satisfactory results in separating LS and HS. The analysis process was implemented and displayed in Matlab platform.
KEYWORDS: lung sound, heart sound, electronic stethoscope, ANC,NLMS
I. INTRODUCTION
An electronic stethoscope, which is a common tool in respiratory sound diagnosis and replaces the traditional stethoscope in auscultation process, has become popular. Moreover, the electronic stethoscope is part of a computerized method that consists of hardware and software. The computerized method is developed to achieve easy digital recording and pre-processing and improve analysis and graphical representations. These improvements help in the automated diagnosis of lung sound (LS).
The main contribution of this study is the design of two channels for recording LS and heart sound (HS) simultaneously using two electronic stethoscopes and pre-processing circuits by considering the specific requirements of HS and LS. This approach is the first step to solve the challenge of providing HS signals discussed in related works [1-3]. Thus, this method provides an HS record for each LS record to maintain homogeneity in natural characteristics and ensure the same recording circumstances for both records.
of ANC–NLMS. Therefore, in this study, the NLMS algorithm replaces LMS because the former is characterized by fast computation and suitability to work with two recording signals in real time.
The performance of the designed two-channel instrument and ANC–NLMS algorithm in terms of separating LS and HS, followed by monitoring the uniformity and components (peaks, phases, and time delay) of all signals (original, reference, separated HS, and pure LS), is effective, and the results have provided the desired output signal. In addition, the power spectral density (PSD) used before and after separating the signals showed the difference in the average power distribution as a function of frequency signals.
The rest of this paper is organized as follows. Section 2 describes the related works and their limitations. Section 3 describes the hardware for designing two-channel electronic stethoscopes, followed by the ANC–NLMS algorithm. Section 4 describes the results, followed by a discussion. The last section presents the conclusion and future work.
II.RELATED WORK
In the literature [4-6], an electronic stethoscope for recording LS or respiratory sounds has been designed. These works have used various processing methods to filter the recorded signals, such as removing undesired frequency or particularly HS frequency. These methods characterize that the desired date may be removed along with undesired signals. On the contrary, several studies [1, 2, 7-12] are concerned with separating HS from LS using adaptive filtering techniques. These techniques require the corresponding natural characteristics of HS signal as a reference input of adaptive filter with noise (HS) and records within the original signal (LS+HS). However, these methods have used one correlated HS signal, which is correlated only with the targeted noise in the original signal, to separate its similar frequency as noise from any recorded LS using an adaptive filter. These works have many limitations that are summarized as follows:
using one correlated HS signal as a reference in adaptive filter with LS obtains less accuracy of the desired signal because no correspondence exists between this reference signal and the original signal in natural characteristics and the recording circumstances and time delay or beginning of the record phases;
using only one electronic stethoscope to record LS and/or surrounding noise; and
using modified reference input of adaptive filter such as adaptive line enhancer (ALE) or ANC to separate HS from LS.
III. METHODOLOGY
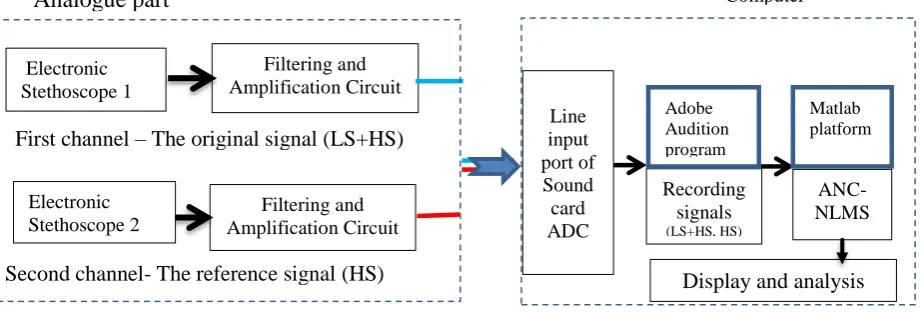
Fig. 1 shows the block diagram of the methods used in this study. This block diagram consists of two parts, namely, the designed hardware and ANC–NLMS algorithm.
Fig. 1 Block diagram of proposed method
A. Hardware Implementation:
The designed instrument was implemented with important considerations, such as reducing background noise, selecting electronic components, calculating their values, and obtaining a gain value during the amplification process, to guarantee
Line input port of Sound card ADC Recording signals (LS+HS, HS) ANC-NLMS
Display and analysis
Computer Adobe Audition program Matlab platform Electronic Stethoscope 1 Filtering and Amplification Circuit Filtering and Amplification Circuit
First channel – The original signal (LS+HS)
Second channel- The reference signal (HS)
Electronic Stethoscope 2
the reduction in noise level. The designed instrument was constructed from two channels, and each channel determined its gain and cutoff frequency depending on the signal type.
o First recording channel structure
This channel was used for recording the original signal (LS+HS) and consisted of the following components and processes:
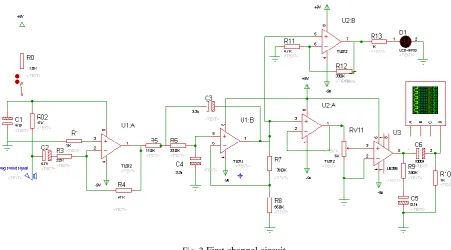
o Sensitive element or electronic stethoscope was constructed from a stethoscope head connected to the small pipe, where an electret condenser microphone was placed 3 cm away from the stethoscope head to avoid noise from metal surfaces [8]. Then, the microphone was connected to the amplification circuit, as shown in Fig. 2.
o The amplification process was divided into three stages. Eq. 1 shows the calculated gain of the first stage. In this stage, an amplifier TL072 was used to obtain a gain of approximately 3.9. The recorded signal was fitted to the inverting input of the amplifier through resistance (R2), as shown in Fig. 2. The value of the input resistance Rin was the sum of R3, and the high output impedance of the microphone (Rmic) reached 10 K Ω
.𝐴1−1
= −
𝑅𝑓 𝑅𝑖𝑛=
47
12.2
= 3.9
(1)Where,
Rf or 4 = 47K Ω gated by experiment circuit design, as follows:𝑅
𝑖𝑛= 𝑅
3+ 𝑅𝑚𝑖𝑐 = 2.2𝐾Ω + 10𝐾Ω = 12.2𝐾ΩFig. 2First channel circuit
o Eq. 2 shows the obtained gain of the second stage amplification that included an active low-pass filter Butterworth second order.
𝐴1−2= 1 +
𝑅13
𝑅14=
33
56= 1.59 (2)
o For the third-stage amplification, audio amplifier LM386 was used with gain at 20, and the volume controller used a potentiometer (Rv11). This amplifier can drive to the headphone given its ability to hear
𝐴
𝑡𝑜𝑡𝑎𝑙 𝐺 1 𝑐ℎ.= 𝐴
1−1∗ 𝐴
1−2∗ 𝐴
1−3= 124.02
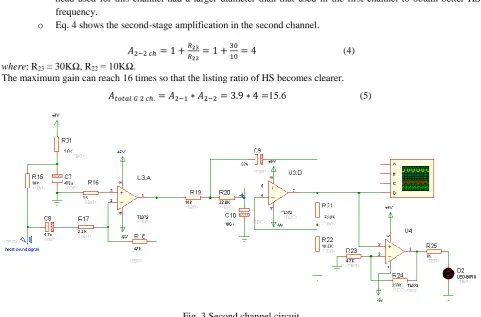
(3) o Second recording channel structureThis channel was determined for recording the reference signal (HS), and it was constructed using the following components and processes:
o A sensitive element or electronic stethoscope was constructed as in the first channel, but the stethoscope head used for this channel had a larger diameter than that used in the first channel to obtain better HS frequency.
o Eq. 4 shows the second-stage amplification in the second channel.
𝐴2−2 𝑐ℎ= 1 + 𝑅23
𝑅22= 1 +
30
10= 4 (4)
where: R23 = 30KΩ, R22 = 10KΩ.
The maximum gain can reach 16 times so that the listing ratio of HS becomes clearer.
𝐴𝑡𝑜𝑡𝑎𝑙 𝐺 2 𝑐ℎ.= 𝐴2−1∗ 𝐴2−2= 3.9 ∗ 4 =15.6 (5)
Fig. 3 Second channel circuit
• Filtering in Analog Circuit:
During the circuit design, the filtering of LS and HS signals was considered. The filtering in the first channel was required to pass LS frequencies of 15-2500 Hz and HS frequencies of 15–150 Hz. The first-stage filtering gained the same value for both channels with cutoff equal to 15 Hz, as shown in Eq. 6.
𝑓𝑐𝑢𝑡−ℎ𝑠 & 𝑙𝑠= 1 2𝜋𝑅𝐶=
1
2𝜋∗2.2∗4.7= 15.4 𝐻𝑧 (6)
Where, R=R3=R17=2.2 KΩ, and C= C2=C8= 4.7µF.
Second-stage filtering was calculated according to second-order Butterworth filter (Sallen–Key) with cutoff frequency of approximately 2500 Hz for LS in the first channel, as shown in Eq. 7, where HS cutoff frequency in the second channel was gated at approximately 150 Hz using the same filter, as shown in Eq. 8.
𝑓𝑐𝑢𝑡−𝑙𝑢𝑛𝑔= 1 2𝜋√𝑅5𝑅6𝐶3𝐶4=
1
2𝜋√11∗33∗3.3∗3.3= 2531𝐻𝑧 (7)
𝑓𝑐𝑢𝑡−ℎ𝑒𝑎𝑟𝑡= 1
2𝜋√𝑅19𝑅20𝐶9𝐶10=
1
2𝜋√16∗22∗33∗100= 148𝐻𝑧 (8)
The component values were calculated with analytical equation or a practical solution applied to circuits.
ANC is one of the noise-attenuating techniques that use filtering interference signals in a similar environment. Thus, such techniques are suitable to remove the interference in bio signals; in this study, interference between LS and HS. Therefore, we suggest using the second channel to record targeted HS as reference noise, not requiring prior knowledge about its natural characteristics and recording circumstances, which were recorded at the same time with the original signal from the same subject. The source input of ANC was used for the original signal (LS+HS) recorded by the first channel. The output y(n) of this ANC filter was obtained through Eq. 9 as follows .
y(n) = ∑N−1k=1wk(n) ∗ x(n − k), (9)
C. NLMS
Using LMS algorithm in real-time processing is difficult as a result of the selected step size (µ). Moreover, when µ is extremely large, it has less stability with faster convergence and vice versa. It can become convergent and stable according to 0 < 𝜇 < 2
𝜌𝑚𝑎𝑥 , where p is the largest eigenvalue of input autocorrelation R. The NLMS algorithm was
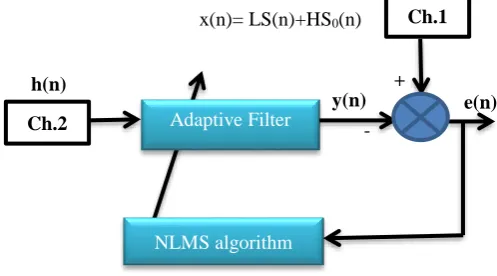
used to avoid the limits of LMS [2]. Moreover, the NLMS algorithm can adapt a filter when input data are changed by generating a new set of coefficients. Fig. 4 shows the ANC–NLMS algorithm architecture.
Fig. 4 ANC-NLMS algorithm architecture. Fig. 4 shows the following main variables of the ANC–NLMS algorithm:
• Input of original signal x(n) recorded by Channel 1: this signal consists of the desirable signal LS(n) and the heart noise signal and surrounding environment noise HS0(n), as shown in Eq. 10.
x(n) = LS(n) + 𝐻𝑆0(n) (10)
• Reference input signal HS(n) recorded by Channel 2: this signal has the same noise or signal as the original signal x(n), indicating that the HS(n) separation removes all of its components from x(n).
• Eq. 11 shows the following estimated error,
𝑒(𝑛) = (𝐿𝑆(𝑛) + 𝐻𝑆0(𝑛)) − 𝑦(𝑛), (11)
• The filter tap weights w(n+1) at each iteration are defined as follows:
𝑤(𝑛 + 1) = 𝑤(𝑛) + 𝜇𝑥(𝑛)𝑒(𝑛) (12)
where μ is the step size adjusted at 0 <µ< 1-2.
• The standard NLMS algorithm was modified by adding the value of β as a small positive constant to avoid division by zero when the values of the input vector are zero.
𝑤(𝑛 + 1) = 𝑤(𝑛) + 𝜇 𝑥(𝑛)
𝛽+𝑥(𝑛)2× 𝑒(𝑛) (13)
The ANC–NLMS algorithm was implemented in Matlab platform, and the benefit of the proposed method was followed by observing uniformity and components (peaks, phases, and time delay) of the original, reference, separated HS, and
+
-_
h(n)
e(n)
x(n)= LS(n)+HS0(n)
NLMS algorithm
y(n) Ch.2
Ch.1
pure LS signals. Moreover, the PSD was used to demonstrate the difference in the average power distribution as a function of signal frequency before and after signal separation.
D. Subject and data acquisition
The samples were obtained from 17 subjects with ages between 20 and 40. The original LS and HS data were recorded from different auscultated locations using two channels. The capturing operation was conducted simultaneously for heart and lung sounds. The captured signals were recorded and saved as a wave file using Adobe Audition platform at the sampling frequency of 4400 Hz, and then reduced to 11025 Hz to facilitate analysis. Table 1 presents the information on the subject and recording process.
Table 1 Information on subject and recording process
N of Subjects Type Age Sensor Location (LS) Sensor Location (HS) 6 healthy Male 18–22 Middle left (Anterior) Apex
4 healthy Male 23–30 Middle right (Posterior) 2nd and 3rd left interspace 5 unhealthy Male 20–24 Lower right (Posterior) 2nd and 3rd right interspace 2 unhealthy Male 30–35 Right costophrenic angle Left sternal border
IV. RESULT AND DISCUSSION
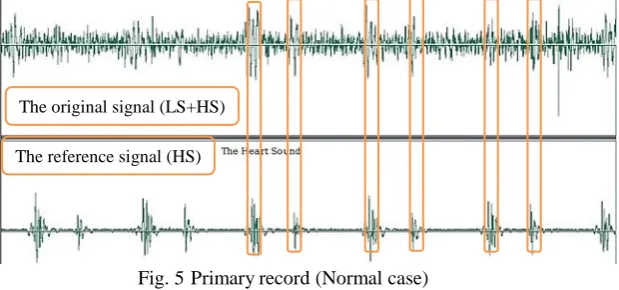
Fig. 5 shows the primary experiment on the instrument design and illustrates two signals (LS+HS) recorded from a healthy subject at the same time using the Audio Adoption program. The HS signal phases and amplitude were reflected in the original signal (LS+HS). The two signals correspond to the phases and peaks and time delay of HS.
Fig. 5Primary record (Normal case)
Fig. 6 shows a 1.5 sec fragment of recording signals at the same time for the same subject using Matlab. The result also shows the correspondence in phases and time delay in both signals.
Figs. 5 and 6 show the benefit of recording the original and reference signals using two channels at the same time, particularly avoiding non-uniformity between two signals because of gathering circumstances of recording, signal features, and subjects. The uniformity of HS signal with targeted HS (as noise) was included in the original signal, and their corresponding properties indicate that the designed instrument is more suitable and efficient than previous devices designed for the same purpose [4, 5-6].
The original signal (LS+HS)
Fig. 6 Fragment (1.5 sec) of both signals
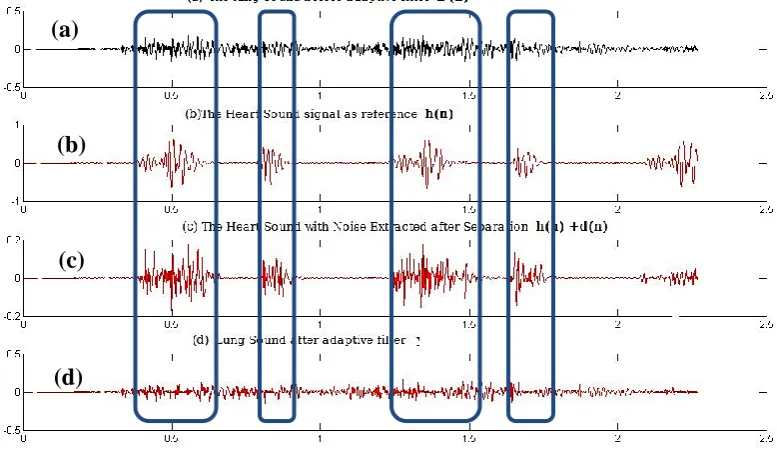
The effective application of the ANC–NLMS algorithm is shown in Fig. 7. The original signal x(n) and the reference signal (HS) were recorded from the same subject at the same time (a and b), whereas the waveform c showed the extracted HS and noise from x(n). This signal was obtained by adding the function for saving and displaying separated signals from the original signal after applying the ANC–NLMS algorithm. This step was added to ensure that the targeted noise was cancelled by comparison with the signal uniformity and components (peaks, phases, and time delay) in waveforms a, b, and c. These waveforms clarify that the applied ANC–NLMS algorithm for separating LS and HS obtains remarkable results and produces a pure LS signal (see waveform d). This signal maintains its uniformity and components. At the same time, HS components were removed from the original signal x(n).
Fig. 7 Waveforms before and after application of adaptive filter: (a) Original signal of x(n); (b) HS is considered a reference input recorded at the same time with x(n); (c) HS and noise extracted from x(n); (d) desired output signal.
Fig. 8 shows the difference in the average power distribution using the PSD of the original signal x(n), which included LS and HS frequencies, and the PSD of HS separated or removed from original signal x(n). This figure also shows the PSD of the pure LS after application of the ANC–NLMS algorithm. Thus, the PSD illustrates the difference
(a)
(b)
(c)
(d)
The same time delay
Appear HS phases in LS
time delay
The original signal (LS+HS)
average of Fourier transform magnitude because it includes the frequency of HS and LS, but the obtained pure LS after separation has the lowest average of Fourier transform magnitude or average power because the current LS is normal.
Fig. 8 PSD of lung sound before and after separation (normal case).
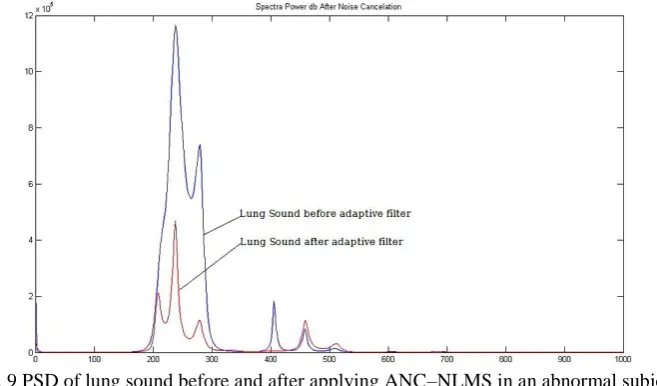
Fig. 9 shows the PSD of the abnormal LS diagnosis before and after application of the ANC–NLMS algorithm. The average power in the frequency range of 200–550 Hz had a higher average than the PSD in Fig. 8 because the current PSD has abnormal LS. The Fourier transform magnitude or average power of the original signal is different from that of pure LS after applying ANC–NLMS.
Fig. 9 PSD of lung sound before and after applying ANC–NLMS in an abnormal subject
V. CONCLUSION AND FUTURE WORK
This study aimed to design an instrument with two channels to record HS and LS signals at the same time, as well as the subject and recording circumstances, and to provide the specific requirements of adaptive filter using this designed instrument. These requirements include recording the original signal (LS+HS) as source input and HS signal as reference input of the ANC–NLMS algorithm.
The implementation of the designed instrument and ANC–NLMS algorithm obtained a corresponding performance, which was observed on the uniformity and components (peaks, phases, and time delay) of the recorded signals (original and HS) and obtained signals (pure LS and separated HS). Satisfactory and efficient results of separating the LS and HS signals were obtained.
In addition, the benefit of the proposed method was measured by using PSD to monitor the different average power before and after separating the signals. The PSD showed the difference in the average power or Fourier transform magnitude of signals before and after separation in the frequency range of signals. Moreover, the PSD demonstrated the different frequency ranges of LS pathology.
In the future, the method could be improved to develop an assisted diagnostic system for breathing sounds. Moreover, based on the obtained results, the recorded and extracted/separated HS could be applied to study and diagnose HS (S1, S2, S3, and S4)).
REFERENCES
[1] Noman Qaid Al-Naggar, “A new method of lung sounds filtering using modulated least mean square adaptive noise cancellation”, Journal of
Biomedical Science and Engineering, Vol.6, No. 9, pp. 869–876, 2013.
[2] NJR Muniraj, K.Sathesh, “Real time heart and lung sound separation using adaptive line enhancer with nlms”, Journal of Theoretical and Applied
Information Technology, Vol. 65, No. 2, pp.559–564, 2014.
[3] M. T. Pourazad, et al., “Heart Sounds Separation from Lung Sounds Using Independent Component Analysis”, Confer. Proc. of the IEEE
Engineering in Medicine and Biology Soc., 3:2736-9., 2005.
[4] A. G. Rudnitski, “Two-Channel Processing of Signals for the separation of Breath and Cardiac Sounds”, Acoustical Physics, Vol. 47, No. 3, 2001.
[5] F. Belloni D, Della Giustina, et al., “A new digital stethoscope with environmental noise cancellation”, Advances in Mathematical and Computational
Methods, Vol. 2, No.6, pp. 169 – 174, May 2014.
[6] Noman Qaid Al-Naggar, “Development of computerized recording channel of lung sound”, Journal of Medical and Bioengineering (JOMB), Vol.
1, No. 1, pp. 52-55, 2012.
[7] C. Ahlstrom, Liljefeldt O et al., “Heart sound cancellation from lung sound recordings using recurrence time statistics and nonlinear prediction”,
IEEE Signal Process Lett, Vol. 12, No. 12, pp. 812–815, 2005.
[8] S. Cortés, Jané R, et al., “Detection and adaptive cancellation of heart sound interference in tracheal sounds”, Proceedings of the 28 annual
international conference of the IEEE Engineering in Medicine and Biology Society, 1:2860-3, pp. 2860–2863, 2006.
[9] R. M. Potdar et.al., “Performance evaluation of different adaptive filtering algorithms for reduction of heart sound from lung sound”, International
Journal of Engineering and Advanced Technology, Vol. 1,No. 3, pp. 61–67, 2012.
[10] M. El-Segaier, Lilja C, et al., “Computer-based detection and analysis of heart sound and murmur”, Ann Biomed Eng., Vol. 33, No. 7, pp. 937–942,
2005.
[11] Thato Tsalaile and Saeid Sanei, “ Separation of Heart Sound Signal From Lung Sound Signal by Adaptive Line Enhancement”, European Signal
Processing Conference -Poland, No. 15, pp. 1231 – 1235, September 2007.
[12] K Sathesh and NJR Muniraj, “Separation of heart sounds from lung sounds using lms adaptive equalizer implementation in cadence tools”,