Clinical Epidemiology
Dove
press
O r i g i n a l r E s E a r C h open access to scientific and medical research
Open access Full Text article
Existing data sources for clinical epidemiology:
Danish Cancer in Primary Care cohort
henry Jensen1,2
Marie louise Tørring1
Mette Bach larsen3
Peter Vedsted1
1research Unit for general
Practice, research Centre for Cancer Diagnosis in Primary Care, 2section for general
Medical Practice, Department of Public health, aarhus University, aarhus C, 3Department of Public
health Programs, randers regional hospital, randers nOE, Denmark
Correspondence: henry Jensen research Unit for general Practice, research Centre for Cancer Diagnosis in Primary Care, Department of Public health, aarhus University, Bartholins allé 2, DK-8000 aarhus C, Denmark Tel +45 8716 8062
Email henry.jensen@feap.dk
Background: In this paper, we describe the settings, content, and possibilities of the Danish Cancer in Primary Care (CaP) cohort as well as some of the key findings so far. Further, we describe the future potential of the cohort as an international resource for epidemiological and health services research studies.
Methods: The CaP cohort comprises information from three Danish subcohorts set up in 2004–2005, 2007–2008, and 2010 on newly diagnosed cancer patients aged 18 years or older. General practitioner (GP)-reported and patient-reported data from six questionnaires gener-ated information on causes and consequences of delayed diagnosis of cancer, and these data were supplemented with complete information on, eg, death, migration, health care utiliza-tion, medication use, and socioeconomic data from Denmark’s comprehensive health and administrative registers. The cohort is followed up in terms of emigration, death, hospitalization, medication, and socioeconomics, and data are updated regularly.
Results: In total, we identified 22,169 verified incident cancer cases. Completed GP questionnaires were returned for 17,566 (79%) of the verified cases, and patient questionnaires were completed by 8,937 (40%) respondents. Patients with participating GPs did not differ from patients with nonparticipating GPs in regard to one-year survival, comorbidity, or educa-tional level. However, compared with nonparticipating GPs, patients listed with participating GPs were more likely to be women, younger, to have a higher disposable income, to have more regional or distant spread of tumors, were also more likely to have breast cancer, and were less likely to have prostate cancer. Responding patients were more likely to be women, aged 45–74 years, and diagnosed with breast cancer or malignant melanoma, and have higher one-year survival rates, more localized tumors, higher educational background, and higher disposable income.
Conclusion: The cohort is an international resource for epidemiological and health service research, and data are accessible for well defined and approved collaborative studies.
Keywords: public health, epidemiology, cohort studies, cancer, early diagnosis
Introduction
The Danish Cancer in Primary Care (CaP) cohort was set up as part of a large Danish research initiative to support epidemiological and health services research within the field of cancer diagnosis.1–3 Three subcohorts of cancer patients (n=22,169) newly
diagnosed during 2004–2010 were pooled. This period of time constitutes a politi-cally distinct period in Denmark as the Danish government and the Danish regions (ie, the hospital owners) launched new diagnostic strategies to promote early diagnosis of cancer and ultimately improve the comparatively poor survival of Danish cancer patients.4,5
Clinical Epidemiology downloaded from https://www.dovepress.com/ by 118.70.13.36 on 20-Aug-2020
For personal use only.
Number of times this article has been viewed
This article was published in the following Dove Press journal: Clinical Epidemiology
Dovepress
Jensen et al
Denmark has a population of 5.6 million people and an annual incidence of cancer of 326 per 100,000.6 All citizens
in Denmark have free access to diagnosis and treatment services through the publicly tax-funded health care system. Around 98% of all Danish citizens are listed with a general practitioner (GP),7 whom they must consult for medical
advice. The GP initiates diagnostics and acts as a gatekeeper to specialized care.
The CaP cohort is unique in the sense that it: employs international standards for measurement of key time points and intervals in the cancer diagnostic pathway;8 encompasses
clinical and patient-assessed data from both the primary and secondary health care sectors; and includes data from before, during, and after the national implementation of standard-ized cancer patient pathways, also referred to as fast-track referrals.9,10
Simultaneous GP and patient surveys (administered three times) were tailored to generate information on time intervals and risk factors of delayed diagnosis of cancer. The surveys were supplemented with information from the extensive Danish health and administrative registers, which provided valid and complete information on, eg, tumor pathology, comorbidities, health care use in primary and secondary care, socioeconomic status, and vital status at any given point in time.
In the following, we will describe the settings, content, and possibilities of the CaP cohort, as well as some of the recent findings from the cohort. Our aim is also to direct
researchers’ attention to the CaP cohort as a potential international resource for epidemiological and health service research studies.
Patients and methods
The CaP cohort comprises information on three Danish subcohorts (1, 2, and 3) of newly diagnosed cancer patients (except nonmelanoma skin cancer patients) aged 18 years or older. Data is stored at Statistics Denmark and managed by researchers at the Research Centre for Cancer Diagnosis in Primary Care at Aarhus University.
Data collection
The first subcohort (subcohort 1) included 2,966 patients from the former Danish County of Aarhus (640,000 inhabitants) from September 1, 2004 to August 31, 2005.2
The second subcohort (subcohort 2) included 12,034 patients from the Region of Southern Denmark and the Central Denmark Region (1.2 million inhabitants) from October 1, 2007 to September 30, 2008.11 The third cohort (subcohort 3)
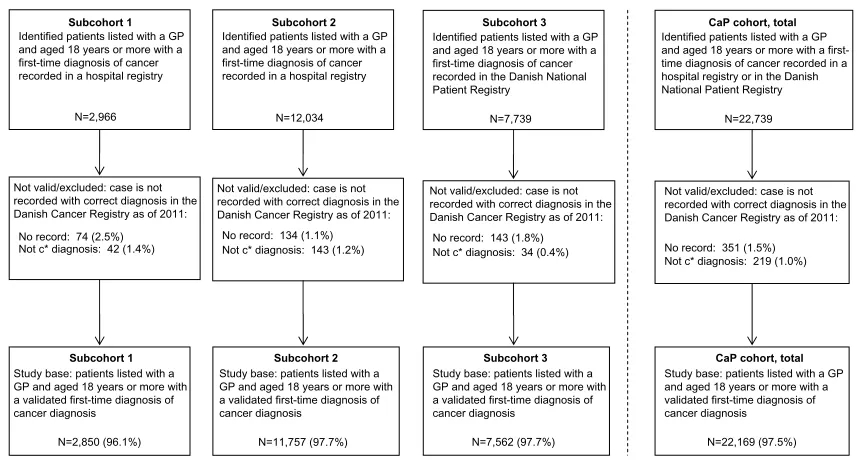
included 7,739 patients from all over Denmark from May 1, 2010 to August 31, 2010 (Figure 1).11
Registry data for this study was linked by means of the civil registry number, a unique personal identifier assigned to all Danish citizens at birth or immigration. The civil reg-istry number is recorded alongside any personal data in all registries in Denmark, enabling combination of information across registries.12
Not valid/excluded: case is not recorded with correct diagnosis in the Danish Cancer Registry as of 2011:
No record: 74 (2.5%) Not c* diagnosis: 42 (1.4%)
Subcohort 1
Identified patients listed with a GP and aged 18 years or more with a first-time diagnosis of cancer recorded in a hospital registry
CaP cohort, total
Identified patients listed with a GP and aged 18 years or more with a first-time diagnosis of cancer recorded in a hospital registry or in the Danish National Patient Registry
N=22,739
Subcohort 2
Identified patients listed with a GP and aged 18 years or more with a first-time diagnosis of cancer recorded in a hospital registry
N=12,034
Subcohort 3
Identified patients listed with a GP and aged 18 years or more with a first-time diagnosis of cancer recorded in the Danish National Patient Registry
Not valid/excluded: case is not recorded with correct diagnosis in the Danish Cancer Registry as of 2011:
No record: 143 (1.8%) Not c* diagnosis: 34 (0.4%) Not valid/excluded: case is not
recorded with correct diagnosis in the Danish Cancer Registry as of 2011:
No record: 134 (1.1%) Not c* diagnosis: 143 (1.2%)
Not valid/excluded: case is not recorded with correct diagnosis in the Danish Cancer Registry as of 2011:
No record: 351 (1.5%) Not c* diagnosis: 219 (1.0%)
Subcohort 1
Study base: patients listed with a GP and aged 18 years or more with a validated first-time diagnosis of cancer diagnosis
N=2,850 (96.1%)
CaP cohort, total
Study base: patients listed with a GP and aged 18 years or more with a validated first-time diagnosis of cancer diagnosis
N=22,169 (97.5%)
Subcohort 3
Study base: patients listed with a GP and aged 18 years or more with a validated first-time diagnosis of cancer diagnosis
N=7,562 (97.7%)
Subcohort 2
Study base: patients listed with a GP and aged 18 years or more with a validated first-time diagnosis of cancer diagnosis
N=11,757 (97.7%)
N=2,966 N=7,739
Figure 1 Patient flow for each subcohort and the CaP cohort in total (far right).
Note: c*,C01–C99, except C44, according to the Tenth Edition of the International Classification of Diseases (ICD-10).
Abbreviations: CaP,Danish Cancer in Primary Care; gP, general practitioner.
Clinical Epidemiology downloaded from https://www.dovepress.com/ by 118.70.13.36 on 20-Aug-2020
Dovepress CaP cohort as an existing clinical epidemiology data source
During the inclusion periods, data on consecutive cancer patients were identified in the regional Patient Administrative System and the Danish National Patient Register through the civil registry number. The Patient Administrative System and the Danish National Patient Register hold similar information on dates of all inpatient and outpatient visits and discharge diagnoses classified according to The Tenth Edition of the International Classification of Diseases (ICD-10). The Patient Administrative System and Danish National Patient Register enabled prospective inclusion of new cases with cancer, while allowing exclusion of patients with a cancer recurrence (previous nonmelanoma skin cancer was allowed). In the first subcohort, patients were also eligible for inclusion if they had had other kinds of cancer before the inclusion period, except for malignant neoplasm of ill-defined, secondary, and unspecified sites (C76–80).2 We verified the cancer diagnosis
using data from the Danish Cancer Registry, which holds records of all incident cancer cases in Denmark.13
We used a version of the Danish National Health Service Register with information on which practice the patient was listed with. This enabled us to identify each patient’s GP and send a questionnaire to the GP 2–5 weeks after identification of the patient. The GPs received compensation of DKK 240 (about EUR 32) for their participation in the first and sec-ond subcohorts, whereas no remuneration was provided for the third subcohort. Nonresponders received a reminder, including a new questionnaire, after 3–5 weeks.
Approximately 3 months after diagnosis, we sent postal questionnaires to all patients who were alive and not flagged in the Danish Civil Registration System12 with a rejection to
be contacted for research purposes. In the second subcohort, we contacted only a sample of two- thirds of these patients due to inclusion errors.11 Nonresponders received a reminder,
including a new questionnaire, after 3 weeks. No monetary or gift incentives to encourage participation were provided to patients.
Variables
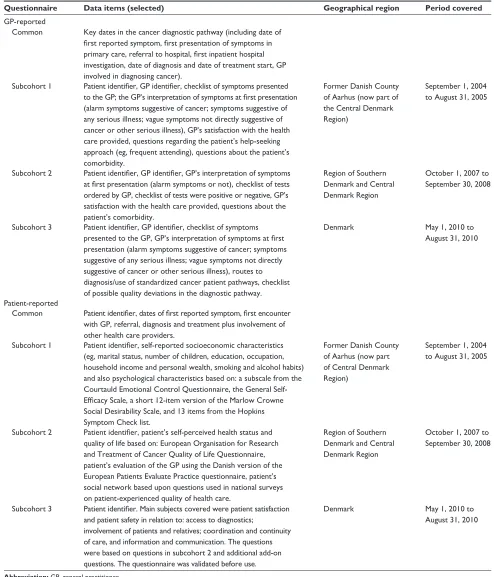
The CaP cohort contains data from a mix of surveys and registries. The survey data originate from six questionnaires with recurring and varying items and themes (Table 1).
In all three GP questionnaires, GPs were asked to provide a detailed description of the patient’s diagnostic pathway on the basis of their contemporaneously updated electronic medical records. Eleven items recurred in all three GP ques-tionnaires; all concerned diagnostic pathway information, which is not routinely collected by registers. This informa-tion included milestone dates regarding first presentainforma-tion of
symptoms, initiation of diagnostics, referral(s), diagnosis, and start of treatment as defined in the Aarhus Statement.8
All GP questionnaires requested information on the symp-toms presented by the patients at the first consultation and instructed the GP to interpret these symptoms (thus enabling us to define alarm symptoms as yes/no). The GP question-naires used in the three subcohorts were 12, eight, and four pages long, respectively. The first and second questionnaire differed from the third, mostly by covering more issues on patient comorbidity and GP satisfaction with the health care provided.
All three patient questionnaires included questions about milestone dates of the first reported symptom, first encoun-ter with a GP, first hospital visit, and diagnosis according to the Aarhus Statement.8 The patient questionnaires used
in the three subcohorts were 16, 12, and 28 pages long, respectively. The first questionnaire covered patient attitudes and psychological characteristics; the second covered patient satisfaction, network, and help-seeking attitudes; and the third questionnaire covered patient safety and satisfaction. Table 1 provides an overview of selected data items.
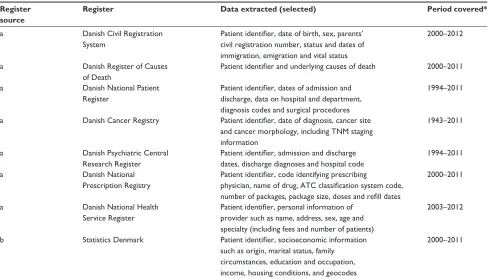
We supplemented the questionnaire data with regis-ter information on seven core administrative health data elements: use of general practice, hospitalizations, outpatient treatments, psychiatric hospital contacts, drug prescriptions, cause and date of death, and information on personal charac-teristics14 (Table 2). This allowed us to include information
on, eg, tumor stage, comorbidity, treatment, recurrences, and different measures of socioeconomic status. These data are summarized in Tables 3 and 4. The main items included in this paper are tumor stage, comorbidity, educational level, and disposable income.
Tumor stage
We classified tumor stage according to the TNM staging sys-tem using established cancer-specific algorithms to catego-rize tumors with missing TNM components as either local, regional, or distant disease based on the TNM information in the Danish Cancer Registry.15–20 TNM staging information
for the residual category of patients with “other cancer” was categorized using the following rough principle: local (T1–4/ N0/M0), regional (T1–4/N1–2+x/M0), distant (T1–4/N0-2/ M1+x), and unknown for the remaining cancers.
Comorbidity
The patient’s complete hospital discharge history 10 years before the date of diagnosis as recorded in the Danish National Patient Register was used to compute a modified
Clinical Epidemiology downloaded from https://www.dovepress.com/ by 118.70.13.36 on 20-Aug-2020
Dovepress
Jensen et al
Table 1 Overview of information obtained from gP and patient questionnaires collected for the Danish Cancer in Primary Care cohort
Questionnaire Data items (selected) Geographical region Period covered
gP-reported
Common Key dates in the cancer diagnostic pathway (including date of first reported symptom, first presentation of symptoms in primary care, referral to hospital, first inpatient hospital investigation, date of diagnosis and date of treatment start, gP involved in diagnosing cancer).
subcohort 1 Patient identifier, GP identifier, checklist of symptoms presented to the GP; the GP’s interpretation of symptoms at first presentation (alarm symptoms suggestive of cancer; symptoms suggestive of any serious illness; vague symptoms not directly suggestive of cancer or other serious illness), GP’s satisfaction with the health care provided, questions regarding the patient’s help-seeking approach (eg, frequent attending), questions about the patient’s comorbidity.
Former Danish County of Aarhus (now part of the Central Denmark Region)
september 1, 2004 to august 31, 2005
subcohort 2 Patient identifier, GP identifier, GP’s interpretation of symptoms at first presentation (alarm symptoms or not), checklist of tests ordered by gP, checklist of tests were positive or negative, gP’s satisfaction with the health care provided, questions about the patient’s comorbidity.
region of southern Denmark and Central Denmark region
October 1, 2007 to september 30, 2008
subcohort 3 Patient identifier, GP identifier, checklist of symptoms presented to the GP, GP’s interpretation of symptoms at first presentation (alarm symptoms suggestive of cancer; symptoms suggestive of any serious illness; vague symptoms not directly suggestive of cancer or other serious illness), routes to diagnosis/use of standardized cancer patient pathways, checklist of possible quality deviations in the diagnostic pathway.
Denmark May 1, 2010 to
august 31, 2010
Patient-reported
Common Patient identifier, dates of first reported symptom, first encounter with gP, referral, diagnosis and treatment plus involvement of other health care providers.
subcohort 1 Patient identifier, self-reported socioeconomic characteristics (eg, marital status, number of children, education, occupation, household income and personal wealth, smoking and alcohol habits) and also psychological characteristics based on: a subscale from the Courtauld Emotional Control Questionnaire, the general self- Efficacy Scale, a short 12-item version of the Marlow Crowne social Desirability scale, and 13 items from the hopkins symptom Check list.
Former Danish County of Aarhus (now part of Central Denmark Region)
september 1, 2004 to august 31, 2005
subcohort 2 Patient identifier, patient’s self-perceived health status and quality of life based on: European Organisation for research and Treatment of Cancer Quality of life Questionnaire, patient’s evaluation of the gP using the Danish version of the European Patients Evaluate Practice questionnaire, patient’s social network based upon questions used in national surveys on patient-experienced quality of health care.
region of southern Denmark and Central Denmark region
October 1, 2007 to september 30, 2008
subcohort 3 Patient identifier. Main subjects covered were patient satisfaction and patient safety in relation to: access to diagnostics;
involvement of patients and relatives; coordination and continuity of care, and information and communication. The questions were based on questions in subcohort 2 and additional add-on questions. The questionnaire was validated before use.
Denmark May 1, 2010 to
august 31, 2010
Abbreviation: gP, general practitioner.
Charlson Comorbidity Index score according to Quan et al.21 We grouped levels of patient comorbidity into “no
comorbidity” (no recorded disease), “moderate comorbid-ity” (index scores of 1 and 2), and “high comorbidcomorbid-ity” (index scores of 3 or more).
Educational level
We used information on education from Statistics Denmark to classify the educational level of the patients in accordance with the International Standard Classification of Education (ISCED).22 We grouped levels of education into “low”
Clinical Epidemiology downloaded from https://www.dovepress.com/ by 118.70.13.36 on 20-Aug-2020
Dovepress CaP cohort as an existing clinical epidemiology data source
Table 2 Overview of information from national registers linked to the Danish Cancer in Primary Care cohort
Register source
Register Data extracted (selected) Period covered*
a Danish Civil registration
system
Patient identifier, date of birth, sex, parents’ civil registration number, status and dates of immigration, emigration and vital status
2000–2012
a Danish register of Causes
of Death
Patient identifier and underlying causes of death 2000–2011
a Danish national Patient
register
Patient identifier, dates of admission and discharge, data on hospital and department, diagnosis codes and surgical procedures
1994–2011
a Danish Cancer registry Patient identifier, date of diagnosis, cancer site and cancer morphology, including TnM staging information
1943–2011
a Danish Psychiatric Central
research register
Patient identifier, admission and discharge dates, discharge diagnoses and hospital code
1994–2011
a Danish national
Prescription registry
Patient identifier, code identifying prescribing
physician, name of drug, ATC classification system code, number of packages, package size, doses and refill dates
2000–2011
a Danish national health
service register
Patient identifier, personal information of provider such as name, address, sex, age and specialty (including fees and number of patients)
2003–2012
b statistics Denmark Patient identifier, socioeconomic information
such as origin, marital status, family circumstances, education and occupation, income, housing conditions, and geocodes
2000–2011
Notes: a, available from Statens Serum Institut (http://www.ssi.dk/English); b, available from Statistics Denmark (http://dst.dk/en/statistik/dokumentation.aspx),* as of september 2013.
Abbreviation: aTC, anatomical Therapeutic Chemical.
(ISCED levels 1 and 2), “medium” (ISCED levels 3 and 4), and “high” (ISCED levels 5 and 6).
Disposable income
We used information from Statistics Denmark to determine the level of Organisation for Economic Cooperation and Development household disposable income in EUR.23 We
grouped the income into tertiles.
Follow-up
The cohort is followed up in terms of emigration, death, hospitalization, medication, and socioeconomics, and data are updated regularly by the register holders. These updates are linked to the cohort by Statistics Denmark on a monthly, quarterly, or yearly basis.
statistical analysis
To test for differences between groups due to dropout, we compared key clinical features and basic characteristics of patients listed with participating and nonparticipating GPs. We also tested for differences in patient characteristics between responding and nonresponding patients. This was done for each cohort and for all cohorts combined using nonparamet-ric tests (Chi-square, Mann-Whitney, and Kruskal-Wallis). All analyses were done using Stata version 13 software (StataCorp, College Station, TX, USA). Participation rates
stratified by the key variables are reported, in addition to the baseline characteristics of the study subjects.
Ethics approval
The project was approved by the Danish Data Protection Agency (record 2009-41-3471). The Danish National Board of Health (today the Danish Health and Medicines Authority) gave permission to obtain information from the GPs’ medical records. According to Danish law, approval by the regional committee on health research ethics was not required, as no biomedical intervention was performed.
Results
Participation rates
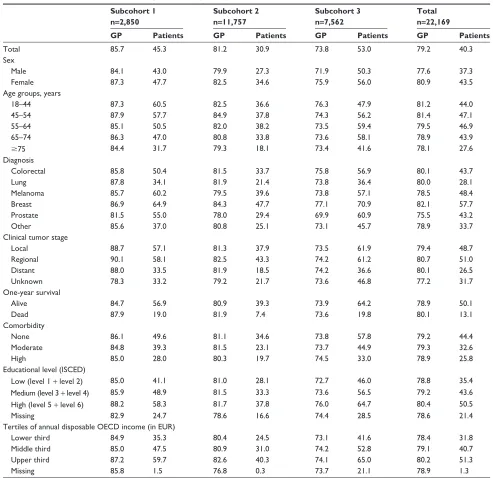
In total, we identified 22,739 incident cancer cases. In 570 (2.5%) of these cases, the diagnosis could not be verified by the Danish Cancer Registry (Figure 1). In 4,603 (21%) of the 22,169 verified cases, GPs did not participate, resulting in a GP participation rate of 79%. The GP participation rate varied between the subcohorts from 86% to 74% (Table 3). In addition, 8,937 patients filled in a questionnaire, which resulted in a patient participation rate of 40%. The patient participa-tion rate varied from 31% to 53% (Table 3). Patient response rates for questionnaires sent (ie, percentage of responding patients who were contacted, alive, and not flagged in the Civil Registration System with a standing rejection to be contacted
Clinical Epidemiology downloaded from https://www.dovepress.com/ by 118.70.13.36 on 20-Aug-2020
Dovepress
Jensen et al
for research purposes) were 53% for subcohort 1, 63% for subcohort 2, and 64% for subcohort 3. Table 3 displays dif-ferences in GP and patient participation rates according to sociodemographic and health characteristics for each subcohort. Characteristics of study subjects, including GP and patient participation, are shown for each subcohort in Table 4.
Differences in patient characteristics
of participating and nonparticipating gPs
Patients listed with participating GPs did not differ from patients listed with nonparticipating GPs in regard to one-year
survival, comorbidity, or educational level. However, com-pared with nonparticipating GPs, patients listed with partici-pating GPs were more likely to be women, younger, to have a higher disposable income, to have more regional or distant spread of tumors, and were also more likely to have breast cancer and less likely to have prostate cancer (Table 3). In the first subcohort, patients with participating GPs were more likely to be diagnosed with lung cancer and to have worse one-year survival, but did not differ in age or disposable income compared with patients with nonparticipating GPs. In the second subcohort, patients with participating GPs were
Table 3 Participation rates according to demographic characteristics in the Danish Cancer in Primary Care cohort at baseline by subcohort, in total and listed for gP and patient surveys, respectively
Subcohort 1 n=2,850
Subcohort 2 n=11,757
Subcohort 3 n=7,562
Total n=22,169
GP Patients GP Patients GP Patients GP Patients
Total 85.7 45.3 81.2 30.9 73.8 53.0 79.2 40.3
sex
Male 84.1 43.0 79.9 27.3 71.9 50.3 77.6 37.3
Female 87.3 47.7 82.5 34.6 75.9 56.0 80.9 43.5
age groups, years
18–44 87.3 60.5 82.5 36.6 76.3 47.9 81.2 44.0
45–54 87.9 57.7 84.9 37.8 74.3 56.2 81.4 47.1
55–64 85.1 50.5 82.0 38.2 73.5 59.4 79.5 46.9
65–74 86.3 47.0 80.8 33.8 73.6 58.1 78.9 43.9
$75 84.4 31.7 79.3 18.1 73.4 41.6 78.1 27.6
Diagnosis
Colorectal 85.8 50.4 81.5 33.7 75.8 56.9 80.1 43.7
lung 87.8 34.1 81.9 21.4 73.8 36.4 80.0 28.1
Melanoma 85.7 60.2 79.5 39.6 73.8 57.1 78.5 48.4
Breast 86.9 64.9 84.3 47.7 77.1 70.9 82.1 57.7
Prostate 81.5 55.0 78.0 29.4 69.9 60.9 75.5 43.2
Other 85.6 37.0 80.8 25.1 73.1 45.7 78.9 33.7
Clinical tumor stage
local 88.7 57.1 81.3 37.9 73.5 61.9 79.4 48.7
regional 90.1 58.1 82.5 43.3 74.2 61.2 80.7 51.0
Distant 88.0 33.5 81.9 18.5 74.2 36.6 80.1 26.5
Unknown 78.3 33.2 79.2 21.7 73.6 46.8 77.2 31.7
One-year survival
alive 84.7 56.9 80.9 39.3 73.9 64.2 78.9 50.1
Dead 87.9 19.0 81.9 7.4 73.6 19.8 80.1 13.1
Comorbidity
none 86.1 49.6 81.1 34.6 73.8 57.8 79.2 44.4
Moderate 84.8 39.3 81.5 23.1 73.7 44.9 79.3 32.6
high 85.0 28.0 80.3 19.7 74.5 33.0 78.9 25.8
Educational level (ISCED)
Low (level 1 + level 2) 85.0 41.1 81.0 28.1 72.7 46.0 78.8 35.4
Medium (level 3 + level 4) 85.9 48.9 81.5 33.3 73.6 56.5 79.2 43.6
High (level 5 + level 6) 88.2 58.3 81.7 37.8 76.0 64.7 80.4 50.5
Missing 82.9 24.7 78.6 16.6 74.4 28.5 78.6 21.4
Tertiles of annual disposable OECD income (in EUR)
lower third 84.9 35.3 80.4 24.5 73.1 41.6 78.4 31.8
Middle third 85.0 47.5 80.9 31.0 74.2 52.8 79.1 40.7
Upper third 87.2 59.7 82.6 40.3 74.1 65.0 80.2 51.3
Missing 85.8 1.5 76.8 0.3 73.7 21.1 78.9 1.3
Abbreviations: GP, general practitioner; OECD, Organisation for Economic Cooperation and Development; ISCED, International Standard Classification of Education.
Clinical Epidemiology downloaded from https://www.dovepress.com/ by 118.70.13.36 on 20-Aug-2020
Dovepress CaP cohort as an existing clinical epidemiology data source
more likely to be diagnosed with colorectal cancer, but did not differ in age, tumor stage, or disposable income compared with patients of nonparticipating GPs (Table 3).
Differences in patient characteristics of
participating and nonparticipating patients
Participating patients in all three subcohorts were more likely to be women, 45–74 years of age, diagnosed with breast
cancer or malignant melanoma, to have higher one-year survival rates, more localized tumors, higher educational background, and higher disposable income (Table 3).
Other findings so far
Analysis of the first subcohort showed that not only system interval (time from referral until start of treatment), but also patient interval (time from symptom onset until patient
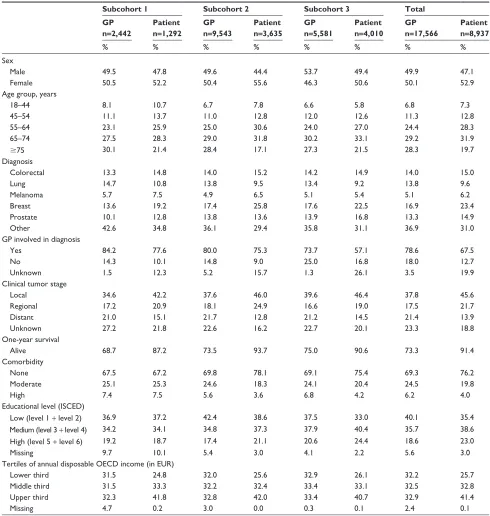
Table 4 Baseline characteristics of study subjects in the Danish Cancer in Primary Care cohort according to gP and patient surveys, respectively
Subcohort 1 Subcohort 2 Subcohort 3 Total
GP n=2,442
Patient n=1,292
GP n=9,543
Patient n=3,635
GP n=5,581
Patient n=4,010
GP n=17,566
Patient n=8,937
% % % % % % % %
sex
Male 49.5 47.8 49.6 44.4 53.7 49.4 49.9 47.1
Female 50.5 52.2 50.4 55.6 46.3 50.6 50.1 52.9
age group, years
18–44 8.1 10.7 6.7 7.8 6.6 5.8 6.8 7.3
45–54 11.1 13.7 11.0 12.8 12.0 12.6 11.3 12.8
55–64 23.1 25.9 25.0 30.6 24.0 27.0 24.4 28.3
65–74 27.5 28.3 29.0 31.8 30.2 33.1 29.2 31.9
$75 30.1 21.4 28.4 17.1 27.3 21.5 28.3 19.7
Diagnosis
Colorectal 13.3 14.8 14.0 15.2 14.2 14.9 14.0 15.0
lung 14.7 10.8 13.8 9.5 13.4 9.2 13.8 9.6
Melanoma 5.7 7.5 4.9 6.5 5.1 5.4 5.1 6.2
Breast 13.6 19.2 17.4 25.8 17.6 22.5 16.9 23.4
Prostate 10.1 12.8 13.8 13.6 13.9 16.8 13.3 14.9
Other 42.6 34.8 36.1 29.4 35.8 31.1 36.9 31.0
gP involved in diagnosis
Yes 84.2 77.6 80.0 75.3 73.7 57.1 78.6 67.5
no 14.3 10.1 14.8 9.0 25.0 16.8 18.0 12.7
Unknown 1.5 12.3 5.2 15.7 1.3 26.1 3.5 19.9
Clinical tumor stage
local 34.6 42.2 37.6 46.0 39.6 46.4 37.8 45.6
regional 17.2 20.9 18.1 24.9 16.6 19.0 17.5 21.7
Distant 21.0 15.1 21.7 12.8 21.2 14.5 21.4 13.9
Unknown 27.2 21.8 22.6 16.2 22.7 20.1 23.3 18.8
One-year survival
alive 68.7 87.2 73.5 93.7 75.0 90.6 73.3 91.4
Comorbidity
none 67.5 67.2 69.8 78.1 69.1 75.4 69.3 76.2
Moderate 25.1 25.3 24.6 18.3 24.1 20.4 24.5 19.8
high 7.4 7.5 5.6 3.6 6.8 4.2 6.2 4.0
Educational level (ISCED)
Low (level 1 + level 2) 36.9 37.2 42.4 38.6 37.5 33.0 40.1 35.4
Medium (level 3 + level 4) 34.2 34.1 34.8 37.3 37.9 40.4 35.7 38.6
High (level 5 + level 6) 19.2 18.7 17.4 21.1 20.6 24.4 18.6 23.0
Missing 9.7 10.1 5.4 3.0 4.1 2.2 5.6 3.0
Tertiles of annual disposable OECD income (in EUR)
lower third 31.5 24.8 32.0 25.6 32.9 26.1 32.2 25.7
Middle third 31.5 33.3 32.2 32.4 33.4 33.1 32.5 32.8
Upper third 32.3 41.8 32.8 42.0 33.4 40.7 32.9 41.4
Missing 4.7 0.2 3.0 0.0 0.3 0.1 2.4 0.1
Abbreviations: GP, general practitioner; OECD, Organisation for Economic Cooperation and Development; ISCED, International Standard Classification of Education.
Clinical Epidemiology downloaded from https://www.dovepress.com/ by 118.70.13.36 on 20-Aug-2020
Dovepress
Jensen et al
contacts the GP) was a major contributor to the total time interval (time from symptom onset until start of treatment) for Danish cancer patients.1,2,10 Further analyses indicated
that around half of all cancer patients presented with non-specific or atypical symptoms24 that complicate and delay
the diagnostic pathway. A study based on data from the second subcohort showed that the secondary care interval did decrease around the time of the implementation of cancer patient pathways in Denmark, but not only as a result of the cancer patient pathways.25
A study on social support, sex, and patient delay found that female cancer patients with a partner and other support had significantly shorter patient intervals, whereas avoidance from others was associated with longer patient intervals. In male patients, none of the social support scales increased the risk of longer patient intervals.26
Other risk factor studies have focused on the influence of socioeconomic status, patient confidence in the GP, GP characteristics, and the possible influence of presence of alarm symptoms on the lengths of various time intervals in the cancer diagnostic pathway.1,3,27,28
By using data from the first subcohort and questioning previously used methodology, researchers have now chal-lenged the conclusion that quickly diagnosed patients have higher mortality rates than other patients.29–31 These studies
show that even a delay of a few weeks in the diagnostic pro-cess seems to make a difference in terms of a lower 5-year survival.29
Discussion
Comparison of different incident cancer cohorts is difficult as cohorts often are sampled in many different ways, and studies tend to use different sources to collect information. Yet, many local databases and cohorts of incident cancer patients exist.32–37 All of these databases comprise relevant
data for research within the field of early cancer diagnosis. Nevertheless, the CaP cohort is unique in the sense that it combines many data sources and hence is the only known cohort to contain concurrent data from primary and secondary health care sectors as well as from patients in combination with socioeconomic data on patient level.
Remarkably few clinical cancer cohorts contain information collected at different points in time.32,34,38,39 To
our knowledge, none of these cohorts have any patient-gathered information and, consequently, cannot be used to analyze differences in patient preferences or patient satisfac-tion, which is possible in the CaP cohort.
The major strengths of the CaP cohort are the population-based design, which is enabled by the uniformly organized Danish health care system, the applied validation process using histological confirmation of diagnoses, the cross-sectional nature of the data collection, and the complete follow-up; all of which reduce selection and information bias. Moreover, the consistent use of international standards for measurements of key points of time in the six surveys further advances state of the art research in cancer diagnosis.
The cohort was identified using a predefined algorithm, which has been shown to be accurate in terms of high posi-tive predicposi-tive values for sampling incident cancer patients.11
Also, the case mix of patients in each subcohort was found to be similar to the case mix in the Danish Cancer Registry at each given period of time. This implies that inference with the source population can be considered valid and also indicates that the observed differences in sex, age, tumor sites, and tumor staging distribution among subcohorts (Table 4) reflect true differences in the source populations. Nonetheless, case mix should be taken into account and adjusted for when all subcohorts are analyzed in combination.
The overall GP response rate of 79% is very high com-pared with a similar survey.37 The overall patient response
rate of 40% may initially seem low,40,41 but is mainly related
to prequestionnaire mortality. In addition, not all eligible patients were contacted in the second subcohort. The GP participation rate declined from 2004 to 2010, which may be related to the fact that no remuneration was given in the last survey.42 However, this decline could also be due to a general
downward trend in study participation.43 The simultaneous
collection of data from GPs and patients and subsequent linkage to complete register data allow researchers not only to carefully evaluate reasons for nonresponse, but also to substantiate claims for data substitution, eg, register data entered for missing GP-reported data.
A particular problem challenging all studies within this area of research is that time points and hence time intervals are difficult to measure precisely. In order to comply with and further optimize international standards, we followed the Aarhus Statement.8 Advances within this area may bring new
and improved ways of defining milestones and intervals, and the detailed data of this cohort may then provide a valuable resource for evaluation. In the context of questionnaire-based studies, GPs may enjoy an advantage over patients since GPs can provide more reliable dates. This may be particularly true for Danish GPs since they are legally bound to keep detailed contemporaneously updated electronic medical
Clinical Epidemiology downloaded from https://www.dovepress.com/ by 118.70.13.36 on 20-Aug-2020
Dovepress CaP cohort as an existing clinical epidemiology data source
records of their patients, including laboratory test results and hospital discharge letters. However, a risk of inaccurate reporting may exist because of the retrospective nature of the data collection. Recall bias may occur either because GPs and patients unintentionally recall very early events, which were, in fact, unrelated to the cancer or because they intentionally downplay the significance of delay if feeling responsible for the outcome; this may partly explain why disagreements between patient-reported and doctor-reported intervals and dates exist.44
implications and future research
Findings to date predominantly concern descriptions, causes, and consequences of delayed diagnosis of cancer. Determinants in the use of referral guidelines is one clear focus; the impact of the introduction of cancer patient pathways is another. Attempts are made to link the data to clinical databases in order to supplement and further advance the national guidance of clinical processes and procedures in cancer diagnosis and treatment. Last, but not least, the cohort is used in international collaborations aiming to improve the methodology and increase the power and generalizability of cancer diagnosis research. Further studies are ongoing. More information on current projects, publications, and initiatives can be found at the CaP web site (http://www.cap.au.dk).
Data are stored and maintained electronically at Statistics Denmark, and data can be accessed by collaborative part-ners via a secured virtual private network. Proposals for collaboration should be submitted to Professor Peter Vedsted, Director of the Research Centre for Cancer Diagnosis in Primary Care at the Research Unit for General Practice, Aarhus University.
Conclusion
We have presented a unique cohort comprising data on three core datasets of newly diagnosed cancer patients and a wide range of relevant register data. Despite possible biases, the cohort is a potential high resource for research within the field of early cancer diagnosis, and we therefore encourage researchers to consider the CaP cohort as a resource for epidemiological and health services research.
Acknowledgments
This work was supported by the Novo Nordisk Foundation, the Danish Cancer Society, the Health Foundation (2012B123), the Tryg Foundation (7-12-0958), and the
Central Denmark Region’s “Praksisforskningsfond” (1-15-1-72-13-09).
Author contributions
HJ was involved in the conception of the study, participated in its design, performed the statistical analyses, and drafted the manuscript. MLT, MBL, and PV all contributed to the conception, development, and design of the study and provided critical revision of the intellectual content of the manuscript. All authors have read and approved the final manuscript.
Disclosure
The authors report no conflicts of interest in this work.
References
1. Hansen RP. Delay in the diagnosis of cancer. PhD thesis. Aarhus, Denmark: Faculty of Health Sciences, University of Aarhus; 2008. Available from: http://folkesundhed.au.dk/fileadmin/www. folkesundhed.au.dk/forskningsenheden_for_almen_praksis/ publikationer/udgivelser/afhandlinger/cd.pdf. Accessed June 12, 2014.
2. Hansen RP, Vedsted P, Sokolowski I, Sondergaard J, Olesen F. Time intervals from first symptom to treatment of cancer: a cohort study of 2,212 newly diagnosed cancer patients. BMC Health Serv Res. 2011;11:284.
3. Larsen MB, Hansen RP, Olesen F, Vedsted P. Patients’ confidence in their GP before and after being diagnosed with cancer. Br J Gen Pract. 2011;61(586):215–222.
4. Coleman M, Forman D, Bryant H, et al. Cancer survival in Australia, Canada, Denmark, Norway, Sweden, and the UK, 1995–2007 (the International Cancer Benchmarking Partnership): an analysis of population-based cancer registry data. Lancet. 2010;377(9760):127–138. 5. Storm HH, Engholm G, Hakulinen T, et al. Survival of patients
diagnosed with cancer in the Nordic countries up to 1999–2003 fol-lowed to the end of 2006. A critical overview of the results. Acta Oncol. 2010;49(5):532–544.
6. International Agency for Research on Cancer. GLOBOCAN 2008, Cancer Incidence and Mortality Worldwide. Available from: http:// www.iarc.fr/en/media-centre/iarcnews/2010/globocan2008.php. Accessed June 12, 2014.
7. Andersen JS, Olivarius NF, Krasnik A. The Danish National Health Service Register. Scand J Public Health. 2011;39(Suppl 7):34–37. 8. Weller D, Vedsted P, Rubin G, et al. The Aarhus statement: improving
design and reporting of studies on early cancer diagnosis. Br J Cancer. 2012;106(7):1262–1267.
9. Probst HB, Hussain ZB, Andersen O. Cancer patient path-ways in Denmark as a joint effort between bureaucrats, health professionals and politicians – a national Danish project. Health Policy. 2012;105(1):65–70.
10. Olesen F, Hansen RP, Vedsted P. Delay in diagnosis: the experience in Denmark. Br J Cancer. 2009;101 Suppl 2:S5–S8.
11. Larsen MB, Jensen H, Hansen RP, Olesen F, Vedsted P. Identification of patients with incident cancers using administrative registry data. Dan Med J. 2014;61(2):A4777.
12. Pedersen CB. The Danish Civil Registration System. Scand J Public Health. 2011;39(Suppl 7):22–25.
13. Gjerstorff ML. The Danish Cancer Registry. Scand J Public Health. 2011;39(Suppl 7):42–45.
Clinical Epidemiology downloaded from https://www.dovepress.com/ by 118.70.13.36 on 20-Aug-2020
Clinical Epidemiology
Publish your work in this journal
Submit your manuscript here: http://www.dovepress.com/clinical-epidemiology-journal
Clinical Epidemiology is an international, peer-reviewed, open access journal focusing on disease and drug epidemiology, identification of risk factors and screening procedures to develop optimal preventative initiatives and programs. Specific topics include: diagnosis, prognosis, treatment, screening, prevention, risk factor modification, systematic
reviews, risk & safety of medical interventions, epidemiology & bio-statical methods, evaluation of guidelines, translational medicine, health policies & economic evaluations. The manuscript management system is completely online and includes a very quick and fair peer-review system, which is all easy to use.
Dovepress
Dove
press
Jensen et al
14. Thygesen LC, Daasnes C, Thaulow I, Bronnum-Hansen H. Introduction to Danish (nationwide) registers on health and social issues: structure, access, legislation, and archiving. Scand J Public Health. 2011; 39(Suppl 7):12–16.
15. Nguyen-Nielsen M, Froslev T, Friis S, Borre M, Harving N, Sogaard M. Completeness of prostate cancer staging in the Danish Cancer Registry, 2004–2009. Clin Epidemiol. 2012;4 Suppl 2:17–23.
16. Deleuran T, Sogaard M, Froslev T, et al. Completeness of TNM staging of small-cell and non-small-cell lung cancer in the Danish cancer registry, 2004–2009. Clin Epidemiol. 2012;4 Suppl 2: 39–44.
17. Ostenfeld EB, Froslev T, Friis S, Gandrup P, Madsen MR, Sogaard M. Completeness of colon and rectal cancer staging in the Danish Cancer Registry, 2004–2009. Clin Epidemiol. 2012;4 Suppl 2: 33–38.
18. Holland-Bill L, Froslev T, Friis S, et al. Completeness of bladder cancer staging in the Danish Cancer Registry, 2004–2009. Clin Epidemiol. 2012;4 Suppl 2:25–31.
19. Ording AG, Nielsson MS, Froslev T, Friis S, Garne JP, Sogaard M. Completeness of breast cancer staging in the Danish Cancer Registry, 2004–2009. Clin Epidemiol. 2012;4 Suppl 2:11–16.
20. Froslev T, Grann AF, Olsen M et al. Completeness of TNM cancer staging for melanoma in the Danish Cancer Registry, 2004–2009. Clin Epidemiol. 2012;4 Suppl 2:5–10.
21. Quan H, Li B, Couris CM, et al. Updating and validating the Charlson comorbidity index and score for risk adjustment in hospital discharge abstracts using data from 6 countries. Am J Epidemiol. 2011;173(6):676–682.
22. United Nations Educational, Scientific and Cultural Organization. International Standard Classification of Education, 2011. Available from: https://www.stat.si/doc/sosvet/Sosvet_19/Sos19_s1925-2013. pdf. Accessed June 12, 2014.
23. Statistics Denmark. Quality Declarations. 2013. Available from: http:// dst.dk/en/Statistik/dokumentation.aspx. Accessed July 7, 2014. 24. Nielsen TN, Hansen RP, Vedsted P. [Symptom presentation in cancer
patients in general practice]. Ugeskr Laeger. 2010;172(41):2827–2831. Danish.
25. Larsen MB, Hansen RP, Hansen DG, Olesen F, Vedsted P. Secondary care intervals before and after the introduction of urgent referral guidelines for suspected cancer in Denmark: a comparative before-after study. BMC Health Serv Res. 2013;13(1):348.
26. Pedersen AF, Olesen F, Hansen RP, Zachariae R, Vedsted P. Social support, gender and patient delay. Br J Cancer. 2011;104(8): 1249–1255. 27. Hansen RP, Olesen F, Sorensen HT, Sokolowski I, Sondergaard J.
Socioeconomic patient characteristics predict delay in cancer diagnosis: a Danish cohort study. BMC Health Serv Res. 2008;8:49.
28. Pedersen AF, Hansen RP, Vedsted P. Patient delay in colorectal cancer patients: associations with rectal bleeding and thoughts about cancer. PLoS One. 2013;8(7):e69700.
29. Torring ML, Frydenberg M, Hansen RP, Olesen F, Vedsted P. Evidence of increasing mortality with longer diagnostic intervals for five common cancers: a cohort study in primary care. Eur J Cancer. 2013;49(9):2187–2198.
30. Torring ML, Frydenberg M, Hamilton W, Hansen RP, Lautrup MD, Vedsted P. Diagnostic interval and mortality in colorectal cancer: U-shaped association demonstrated for three different datasets. J Clin Epidemiol. 2012;65(6):669–678.
31. Torring ML, Frydenberg M, Hansen RP, Olesen F, Hamilton W, Vedsted P. Time to diagnosis and mortality in colorectal cancer: a cohort study in primary care. Br J Cancer. 2011;104(6):934–940.
32. Prades J, Espinas JA, Font R, Argimon JM, Borras JM. Implementing a cancer fast-track programme between primary and specialised care in Catalonia (Spain): a mixed methods study. Br J Cancer. 2011;105(6):753–759.
33. Toustrup K, Lambertsen K, Birke-Sorensen H, Ulhoi B, Sorensen L, Grau C. Reduction in waiting time for diagnosis and treatment of head and neck cancer – a fast track study. Acta Oncol 2011;50(5):636–641. 34. Valentin-Lopez B, Ferrandiz-Santos J, Blasco-Amaro JA,
Morillas-Sainz JD, Ruiz-Lopez P. Assessment of a rapid referral pathway for sus-pected colorectal cancer in Madrid. Fam Pract. 2012;29(2):182–188. 35. Jones R, Latinovic R, Charlton J, Gulliford MC. Alarm symptoms in
early diagnosis of cancer in primary care: cohort study using General Practice Research Database. BMJ. 2007;334(7602):1040.
36. Christensen KG, Fenger-Gron M, Flarup KR, Vedsted P. Use of general practice, diagnostic investigations and hospital services before and after cancer diagnosis – a population-based nationwide registry study of 127,000 incident adult cancer patients. BMC Health Serv Res. 2012;12(1):224.
37. Rubin G, Elliott AM, McPhail S. National audit of cancer diagnosis in primary care. Royal College of General Practitioners; 2011. Available from: http://www.rcgp.org.uk/news/2011/november/∼/media/Files/ News/National_Audit_of_Cancer_Diagnosis_in_Primary-Care.ashx. Accessed June 12, 2014.
38. Potter S, Govindarajulu S, Shere M, et al. Referral patterns, cancer diagnoses, and waiting times after introduction of two week wait rule for breast cancer: prospective cohort study. BMJ. 2007;335:288. 39. Neal RD, Din NU, Hamilton W, et al. Comparison of cancer diagnostic
intervals before and after implementation of NICE guidelines: analysis of data from the UK General Practice Research Database. Br J Cancer. 2014;110(3):584–592.
40. Lyratzopoulos G, Abel GA, McPhail S, Neal RD, Rubin GP. Gender inequalities in the promptness of diagnosis of bladder and renal cancer after symptomatic presentation: evidence from secondary analysis of an English primary care audit survey. BMJ Open. 2013;3(6). 41. Allgar VL, Neal RD. Delays in the diagnosis of six cancers: analysis of
data from the National Survey of NHS Patients: Cancer. Br J Cancer. 2005;92(11):1959–1970.
42. Edwards P, Cooper R, Roberts I, Frost C. Meta-analysis of randomised trials of monetary incentives and response to mailed questionnaires.
J Epidemiol Community Health. 2005;59(11):987–999.
43. Galea S, Tracy M. Participation rates in epidemiologic studies. Ann Epidemiol. 2007;17(9):643–653.
44. Larsen MB, Hansen RP, Sokolowski I, Vedsted P. Agreement between patient-reported and doctor-reported patient intervals and date of first symptom presentation in cancer diagnosis- a population-based questionnaire study. Cancer Epidemiol. 2014;38(1):100–105.
Clinical Epidemiology downloaded from https://www.dovepress.com/ by 118.70.13.36 on 20-Aug-2020