Journal of Pain Research 2017:10 1871–1878
Journal of Pain Research
Dove
press
submit your manuscript | www.dovepress.com 1871
O R I G I N A L R E S E A R C H open access to scientific and medical research
Open Access Full Text Article
The Fear of Pain Questionnaire-III and the
Fear of Pain Questionnaire-Short Form:
a confirmatory factor analysis
Sara M Vambheim1
Peter Solvoll Lyby1,2
Per M Aslaksen1
Magne Arve Flaten3
Ole Åsli1
Laila M Martinussen4 1Department of Psychology, UiT, The
Arctic University of Norway, Tromsø;
2CatoSenteret Rehabilitation Center,
Son; 3Department of Psychology,
NTNU, The Norwegian University of Science and Technology, Trondheim, Norway; 4Management Engineering,
DTU, Technical University of Denmark, Lyngby, Denmark
Background: The Fear of Pain Questionnaire-III (FPQ-III) is a widely used instrument to
assess the fear of pain (FOP) in clinical and nonclinical samples. The FPQ-III has 30 items and is divided into three subscales: Severe Pain, Minor Pain and Medical Pain. Due to findings of poor fit of the original three-factor FPQ-III model, the Fear of Pain Questionnaire-Short Form (FPQ-SF) four-factor model has been suggested as an alternative. The FPQ-SF is a revised version of the FPQ-III, reduced to 20 items and subdivided into four subscales: Severe Pain, Minor Pain, Injection Pain and Dental Pain.
Aims and methods:The purpose of the study was to investigate the model fit, reliability and
validity of the FPQ-III and the FPQ-SF in a Norwegian nonclinical sample, using confirmatory factor analysis (CFA). The second aim was to explore the model fit of the two scales in male and female subgroups separately, since previous studies have uncovered differences in how well the questionnaires measure FOP across sex; thus, the questionnaires might not be sex neutral. It has been argued that the FPQ-SF model is better because of the higher fit to the data across sex. To explore model fit across sex within the questionnaires, the model fit, validity and reliability were compared across sex using CFA.
Results: The results revealed that both models’ original factor structures had poor fit. However,
the FPQ-SF had a better fit overall, compared to the FPQ-III. The model fit of the two models differed across sex, with better fit for males on the FPQ-III and for females on the FPQ-SF.
Conclusion: The FPQ-SF is a better questionnaire than the FPQ-III for measurement of FOP
in Norwegian samples and across sex subgroups. However, the FPQ-III is a better questionnaire for males than for females, whereas the FPQ-SF is a better questionnaire for females than for males. The findings are discussed and directions for future investigations outlined.
Keywords: fear of pain, FPQ-III, FPQ-SF, confirmatory factor analysis, pain, sex
Introduction
Fear of pain (FOP) is associated with emotional reactions occurring in the anticipation of pain or during pain.1 FOP is related to increased pain perception2–4 and reduced capacity for pain inhibition,1 and is a central mechanism in several pain disorders.5,6 Females have higher FOP7–9 and are more sensitive to pain and less sensitive to pain inhibition than males.1,5,10,11 Furthermore, the prevalence of several chronic pain condi-tions is higher in females than in males.5 Thus, the association between FOP and pain and sex differences in FOP and pain are well established.
FOP is related to avoidant pain behaviors, for example, avoidance of situations that involve or may involve pain experience. It has been argued that FOP is more disabling than the actual pain.12 Testing the applicability of FOP questionnaire is, therefore, of
Correspondence: Sara M Vambheim Department of Psychology, UiT, The Arctic University of Norway, N-9037 Tromsø, Norway
Tel +47 97 56 9020
Email sara.m.vambheim@uit.no
Journal name: Journal of Pain Research Article Designation: ORIGINAL RESEARCH Year: 2017
Volume: 10
Running head verso: Vambheim et al
Running head recto: Factor analysis of FPQ-III and FPQ-SF DOI: http://dx.doi.org/10.2147/JPR.S133032
Journal of Pain Research downloaded from https://www.dovepress.com/ by 118.70.13.36 on 24-Aug-2020
For personal use only.
This article was published in the following Dove Press journal: Journal of Pain Research
8 August 2017
Dovepress
Vambheim et al
great importance. In order to accurately capture FOP, the FOP questionnaires should mirror FOP across sex and age. Furthermore, the validation of FOP questionnaires is crucial for the development of personalized medicine and treatments.
The Fear of Pain Questionnaire-III (FPQ-III) was devel-oped by McNeil and Rainwater in 1998.13 Since then, it has been translated into several different languages, and has become widely used in both clinical6 and nonclinical samples.1 The FPQ-III consists of 30 items and three sub-scales: fear of Severe Pain, Minor Pain and Medical Pain. Asmundson et al14 examined the factor structure, consistency and validity of the FPQ-III in a Canadian sample of 589 undergraduates, and concluded that the model had unac-ceptable fit. Similar findings have been made by others.8,14,15 The Fear of Pain Questionnaire-Short Form (FPQ-SF) was, therefore, suggested as an alternative and better adjusted questionnaire for measurements of FOP.14 This questionnaire is reduced to 20 items and is divided into four subscales: fear of Severe Pain, Minor Pain, Injection Pain and Dental Pain. It has been argued that the FPQ-SF enables factor struc-ture invariance across sex, and thus is better suited for mea-suring FOP in both males and females.14 The psychometric properties of the FPQ-III have been investigated previously, and sex differences were reported in FPQ-III Total and the three subscales: Severe Pain, Minor Pain and Medical Pain.8,9 However, van Wijk and Hoogstraten developed a German version of the FPQ-III and found no sex differences in their sample. Thus, translational, linguistic and cultural issues may contribute to increase or decrease sex differences in endorsed FOP.16 Therefore, the main aim of this study was to investigate the FPQ-III’s and FPQ-SF’s model fit, reliabil-ity and validreliabil-ity in a Norwegian sample, in order to explore the questionnaires’ applicability. The secondary aim was to investigate the models’ sex neutrality, that is, how well the questionnaires measure FOP across sex groups. We hypoth-esized that the FPQ-SF would have a better model fit than the FPQ-III. We also expected sex differences in the model fit of the FPQ-III, but not the FPQ-SF. Higher fit was expected for women than for men in the FPQ-III model. Furthermore, higher FOP scores were expected in females than in males.
Methods
Participants
A total of 807 healthy participants were included in the study: 339 males, age range 18–40 years, mean 23.4, standard deviation (SD)=4.1, and 468 females, age range 18–40 years, mean =22.1, SD=3.4. The participants were undergraduate students recruited on campus at the University of Tromsø and screened for medical history of serious diseases or injuries.
Somatic or psychiatric disorders and use of prescription-based medications or allergy medications led to exclusion from participation. Pregnant women were excluded. Participants were instructed to abstain from use of nicotine- and caffeine-containing substances 3 hours before participation. The participants had to speak Norwegian as Norwegian language was used in the questionnaires, instructions, consent and mea-surements of pain, stress and activation collected in the experi-ments. Data from seven different study samples were pooled. All participants filled in the FPQ-III and an informed consent form. The studies were approved by the Regional Committee for Medical Research Ethics North Norway (project numbers: 2013/966, 2012/1888, 2610.00001, 49/2005, 5.2006.2452; 20277, 17/2006).
Measures
The FPQ-III measures pain-related fear on a 30-item ques-tionnaire. Each question presents a pain-related situation, and participants are asked to rate FOP on a 5-point Likert scale (1= not afraid at all, 5= extremely afraid). The FPQ-III is further divided into three factorial distinct subscales consist-ing of 10 questions: Severe Pain (eg, beconsist-ing involved in a car accident), Minor Pain (eg, biting your tongue) and Medical Pain (eg, receiving an injection in your mouth). McNeil and Rainwater reported that the psychometric properties of the FPQ-III were considered satisfactory,7 with good internal consistency and test–retest reliability. Similar findings have been reported by others.16–18 A Norwegian version of the FPQ-III, translated by Lyby et al, was used in this study.4
The FPQ-SF is a reduced version of the FPQ-III. The FPQ-SF was developed by Asmundson et al,14 who reported good internal consistency and construct validity. This reduced version of the FPQ-III consists of 20 items and has four factorial distinct subscales: Severe, Minor, Injection (hav-ing a blood sample drawn) and Dental Pain (hav(hav-ing a tooth pulled). The questionnaire is organized in a similar format as the FPQ-III, with a 5-point Likert scale. To date, there is limited knowledge about the FPQ-SF’s reliability and validity.
Procedure
The participants were recruited from the University of Tromsø. All subjects were participants in pain studies and filled in the FPQ-III and a written consent form prior to test-ing. Data obtained from the pain experiments are published elsewhere.1,4,10,19,20
Statistical analyses
Firstly, SPSS version 24 was used to run independent samples
t-tests to examine whether there were sex differences on
Journal of Pain Research downloaded from https://www.dovepress.com/ by 118.70.13.36 on 24-Aug-2020
Dovepress Factor analysis of FPQ-III and FPQ-SF
subscale level. p values from the analysis of variance were corrected for multiple comparisons by the Holm– Bonferroni procedure. Secondly, IBM SPSS AMOS version 22 (IBM Corporation, Armonk, NY, USA), maximum likelihood estimation was used to conduct confirmatory factor analysis (CFA) in order to examine the fit of the two models to the data and the possible sex differences in model fit.21 The fit of the models to the data was evaluated by the c2/degrees of freedom ratio, the root mean square error of approximation (RMSEA), the goodness-of-fit index (GFI), the expected cross-validation index (ECVI) and the comparative fit index (CFI). Traditionally, a good fit model should have 2:1 or 5:1 c2/degrees of freedom ratio, RMSEA <0.08 or 0.10 (preferably <0.05), GFI >0.90, lower values of ECVI indicating a closer fit and CFI >0.90 (preferably >0.95).21–23 Two multigroup CFAs (chi-square difference test) were used to examine if the measurement models differed across the two sex groups. Three (FPQ-III) and four (FPQ-SF) factors respectively were held constant simultaneously across the sex groups (i.e., configural invariance) and the factor loadings were constrained to be equal across the sex groups (i.e., a test if there are equal factor loadings or metric invariance) in the multigroup analysis. Lastly, IBM SPSS version 24 (IBM Corporation) was used to calculate Cronbach’s a values for the factors in the two models as well as to determine the intercorrelations between the sum scores of factors in the
FPQ-III and the FPQ-SF. Acceptable high Cronbach’s a is 0.7 and above.24
Results
Descriptive statistics
Descriptive statistics for FPQ-III and FPQ-SF total and subscale mean scores and standard deviations for males and females are presented in Table 1. Independent samples t-tests revealed that females scored significantly higher than males on all subscales of the FPQ-III: Severe Pain (t (1.805)=−8.60,
p<0.001), Minor Pain (t (1.805)=3.49, p=0.001) and Medical Pain (t (1.805)=−4.25, p<0.001) and the Holm–Bonferroni adjusted a level=0.01. Furthermore, females scored sig-nificantly higher than males on all subscales of the FPQ-SF: Severe Pain (t (1.805)=−7.99, p<0.001), Minor Pain (t (1.805)=−3.93, p=0.001), Injection Pain (t (1.805)=4.00,
p<0.001) and Dental Pain (t (1.805)=−3.15, p=0.002).
Fit indices
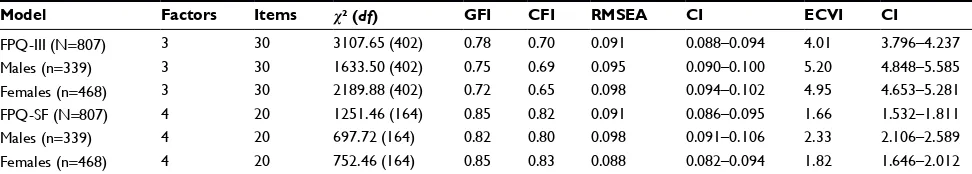
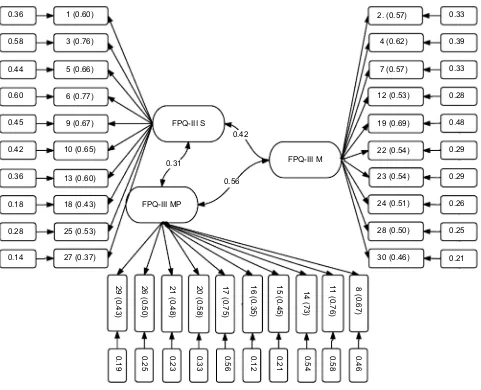
Fit indices for the two tested models are presented in Table 2. In line with the main hypothesis, the FPQ-SF had the best over-all fit. The second hypothesis was not fully confirmed, as the results revealed that model fit differed across sex for both the FPQ-III and the FPQ-SF. The FPQ-III had a slightly better fit for males, and the FPQ-SF had a slightly better fit for females. Further analysis (multigroup CFA) showed that the differences in model fit across the sex groups were significant in the FPQ-III model (p<0.000) and nonsignificant in the FPQ-III model (p=0.054) as hypothesized. Additionally, the FPQ-SF had a better overall fit, as indicated by the fit indices presented in Table 2. However, neither of the models showed very good fit, although the fit was adequate according to some of the prede-termined criteria (RMSEA and ECVI). The factorial structures with standardized parameter estimates (factor loadings and squared multiple correlations) for the FPQ-III and FPQ-SF in the whole sample are presented schematically in Figures 1 and 2. Standardized parameter estimates (factor loadings and squared multiple correlations) for men and women separately
Table 1 Descriptive statistics of the FPQ-III and the FPQ-SF
Males (n=339)
Females (n=468)
Both (N=807)
Mean SD Mean SD Mean SD
FPQ-III 73.4 14.3 80.7 13.8 77.6 14.3
Severe pain 32.4 6.9 36.9 6.1 34.7 6.7
Minor pain 18.2 5.1 19.5 5.2 18.9 5.2
Medical pain 22.7 6.1 24.7 6.4 23.8 6.4
FPQ-SF 46.8 10.0 51.8 9.6 49.7 10.1
Severe pain 19.0 4.7 21.6 4.2 20.5 4.6
Minor pain 14.6 4.2 15.7 4.4 15.0 4.4
Injection pain 5.5 2.4 6.3 2.9 6.0 2.7
Abbreviations: FPQ-III, Fear of Pain Questionnaire-III; FPQ-SF, Fear of Pain Questionnaire-Short Form; SD, standard deviation.
Table 2 Fit indices of the FPQ-III and the FPQ-SF obtained by means of CFA
Model Factors Items c² (df) GFI CFI RMSEA CI ECVI CI
FPQ-III (N=807) 3 30 3107.65 (402) 0.78 0.70 0.091 0.088–0.094 4.01 3.796–4.237
Males (n=339) 3 30 1633.50 (402) 0.75 0.69 0.095 0.090–0.100 5.20 4.848–5.585
Females (n=468) 3 30 2189.88 (402) 0.72 0.65 0.098 0.094–0.102 4.95 4.653–5.281
FPQ-SF (N=807) 4 20 1251.46 (164) 0.85 0.82 0.091 0.086–0.095 1.66 1.532–1.811
Males (n=339) 4 20 697.72 (164) 0.82 0.80 0.098 0.091–0.106 2.33 2.106–2.589
Females (n=468) 4 20 752.46 (164) 0.85 0.83 0.088 0.082–0.094 1.82 1.646–2.012
Note: Criteria for a good fit are 2:1 or 5:1 c²/df, GFI >0.90, CFI >0.90, lower ECVI values indicate a closer fit and RMSEA <0.08 or 0.10 (preferably 0.05).
Abbreviations: CFA, confirmatory factor analysis; CFI, comparative fit index; CI, confidence interval; ECVI, expected cross-validation index; FPQ-III, Fear of Pain Questionnaire-III; FPQ-SF, Fear of Pain Questionnaire-Short Form; GFI, goodness-of-fit index; RMSEA, root mean square error of approximation.
Journal of Pain Research downloaded from https://www.dovepress.com/ by 118.70.13.36 on 24-Aug-2020
Dovepress
Vambheim et al
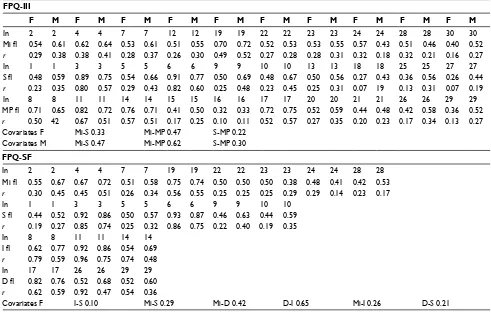
in the two models are presented in Table 3. The factor load-ings presented in Figures 1 and 2 and Table 3 show the items correlation with the latent factor. As can be seen in Figures 1 and 2 and Table 3, for the whole sample, none of the items loaded under the recommended cut-off of 0.3;25 however, some loaded below 0.5.26 In the female subgroup, items 18 and 27 in the Severe FPQ-III subscale loaded below 0.3, and in male and female subgroups several items loaded below 0.5 in both models. None of the items in FPQ-III had loadings above 0.77, but in FPQ-SF several items loaded above 0.77.
Reliability and intercorrelations
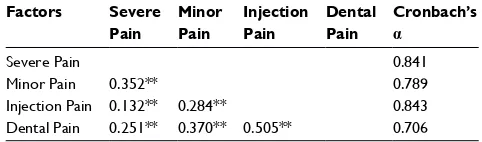
The Cronbach’s a values showed high internal consistency for both the FPQ-III and the FPQ-SF (Tables 4 and 5). Accept-able high Cronbach’s a is 0.7 and above. However, the values are affected by the number of items in each factor.24 Even though the FPQ-SF has fewer items than the FPQ-III, it still had acceptable a values. All intercorrelations between the
factors were significant (Table 5). Positive and significant correlations were found between all the subscales.
Discussion
This study investigated the model fit, reliability, validity and sex neutrality of the FPQ-III and the FPQ-SF factor mod-els. CFA revealed that none of the models had good fit, but the FPQ-SF provided a better overall fit than the FPQ-III. The ECVI, CFI and GFI favored the FPQ-SF, even though both CFI and GFI were below the recommended threshold. RMSEA was within the recommended threshold for both models; however, it was not within a good model fit range. The poor fit of the models is also mirrored in the standardized parameter estimates (factor loadings and squared multiple correlations), in which some items were below the recom-mended factor loading threshold. There were sex differences in the model fit which were significant for the FPQ-III model, but not for the FPQ-SF, as hypothesized.
Figure 1 The factor loadings and squared multiple correlations of the FPQ-III.
Abbreviations: FPQ-III, Fear of Pain Questionnaire-III; FPQ-III M, FPQ-III Minor Pain; FPQ-III MP, FPQ-III Medical Pain; FPQ-III S, FPQ-III Severe Pain.
0.36 1 (0.60) 2. (0.57) 0.33
4 (0.62)
7 (0.57)
12 (0.53)
19 (0.69)
22 (0.54)
23 (0.54)
24 (0.51)
28 (0.50)
30 (0.46)
0.39
0.33
0.28
0.48
0.29
0.29
0.26
0.25
0.21 3 (0.76)
5 (0.66)
6 (0.77)
9 (0.67) FPQ-III S
FPQ-III M
FPQ-III MP 0.31
0.56
8 (0.67)
0.46
0.58
0.54
0.21
0.12
0.56
0.33
0.23
0.25
0.19
11
(0.76)
14 (73)
15 (0.45)
16 (0.35)
17 (0.75)
20 (0.58)
21 (0.48)
26 (0.50)
29 (0.43)
0.42 10 (0.65)
13 (0.60)
18 (0.43)
25 (0.53)
27 (0.37) 0.58
0.44
0.60
0.45
0.42
0.36
0.18
0.28
0.14
Journal of Pain Research downloaded from https://www.dovepress.com/ by 118.70.13.36 on 24-Aug-2020
Dovepress Factor analysis of FPQ-III and FPQ-SF
Figure 2The factor loadings and squared multiple correlations of the FPQ-SF.
Abbreviations: FPQ-SF, Fear of Pain Questionnaire Short Form; FPQ-SF MD, FPQ-SF Dental Pain; FPQ-SF I, FPQ-SF Injection Pain; FPQ-SF M, FPQ-SF Minor Pain; FPQ-SF
S, FPQ-SF Severe Pain.
0.25 1 (0.50)
3 (0.90)
5 (0.55)
6 (0.90) FPQ-SF S FPQ-SF M
2 (0.61) 0.37
0.46
0.31
0.54
0.26
0.27
0.23
0.21
0.63
0.35
0.30 4 (0.68)
7 (0.55)
19 (0.73)
22 (0.51)
23 (0.52)
24 (0.48)
28 (0.46)
17 (0.79)
26 (0.59)
29 (0.55) FPQ-SF MD
0.47
FPQ-SF I 0.10
0.38
0.26 0.31
0.68 9 (0.56)
10 (0.53)
8 (0.78)
11 (0.98)
14 (0.73) 0.80
0.30
0.81
0.31
0.28
0.62
0.86
0.53
Table 3 The factor loadings and squared multiple correlations of the FPQ-III and the FPQ-SF among males and females separately
FPQ-III
F M F M F M F M F M F M F M F M F M F M
In 2 2 4 4 7 7 12 12 19 19 22 22 23 23 24 24 28 28 30 30
Mi fl 0.54 0.61 0.62 0.64 0.53 0.61 0.51 0.55 0.70 0.72 0.52 0.53 0.53 0.55 0.57 0.43 0.51 0.46 0.40 0.52
r 0.29 0.38 0.38 0.41 0.28 0.37 0.26 0.30 0.49 0.52 0.27 0.28 0.28 0.31 0.32 0.18 0.32 0.21 0.16 0.27
In 1 1 3 3 5 5 6 6 9 9 10 10 13 13 18 18 25 25 27 27
S fl 0.48 0.59 0.89 0.75 0.54 0.66 0.91 0.77 0.50 0.69 0.48 0.67 0.50 0.56 0.27 0.43 0.36 0.56 0.26 0.44 r 0.23 0.35 0.80 0.57 0.29 0.43 0.82 0.60 0.25 0.48 0.23 0.45 0.25 0.31 0.07 19 0.13 0.31 0.07 0.19
In 8 8 11 11 14 14 15 15 16 16 17 17 20 20 21 21 26 26 29 29
MP fl 0.71 0.65 0.82 0.72 0.76 0.71 0.41 0.50 0.32 0.33 0.72 0.75 0.52 0.59 0.44 0.48 0.42 0.58 0.36 0.52
r 0.50 42 0.67 0.51 0.57 0.51 0.17 0.25 0.10 0.11 0.52 0.57 0.27 0.35 0.20 0.23 0.17 0.34 0.13 0.27
Covariates F Mi-S 0.33 Mi-MP 0.47 S-MP 0.22
Covariates M Mi-S 0.47 Mi-MP 0.62 S-MP 0.30
FPQ-SF
In 2 2 4 4 7 7 19 19 22 22 23 23 24 24 28 28
Mi fl 0.55 0.67 0.67 0.72 0.51 0.58 0.75 0.74 0.50 0.50 0.50 0.38 0.48 0.41 0.42 0.53
r 0.30 0.45 0.45 0.51 0.26 0.34 0.56 0.55 0.25 0.25 0.25 0.29 0.29 0.14 0.23 0.17
In 1 1 3 3 5 5 6 6 9 9 10 10
S fl 0.44 0.52 0.92 0.86 0.50 0.57 0.93 0.87 0.46 0.63 0.44 0.59
r 0.19 0.27 0.85 0.74 0.25 0.32 0.86 0.75 0.22 0.40 0.19 0.35
In 8 8 11 11 14 14
I fl 0.62 0.77 0.92 0.86 0.54 0.69
r 0.79 0.59 0.96 0.75 0.74 0.48
In 17 17 26 26 29 29
D fl 0.82 0.76 0.52 0.68 0.52 0.60
r 0.62 0.59 0.92 0.47 0.54 0.36
Covariates F I-S 0.10 Mi-S 0.29 Mi-D 0.42 D-I 0.65 Mi-I 0.26 D-S 0.21
Abbreviations: D, dental; F, female; fl, factor loading; FPQ-III, Fear of Pain Questionnaire-III; FPQ-SF, Fear of Pain Questionnaire Short Form; I, injection; In, item number; M, men; Mi, minor; MP, medical pain; r, squared multiple correlations; S, severe.
Journal of Pain Research downloaded from https://www.dovepress.com/ by 118.70.13.36 on 24-Aug-2020
Dovepress
Vambheim et al
The internal consistency of the FPQ-III subscales was good (ranging from 0.82 to 0.85). The internal consistency of the FPQ-SF subscales was good for the Severe and Injec-tion Pain subscales (0.84) and acceptable for the Minor and Medical Pain subscales (0.70 and 0.78). Thus, the findings from the FPQ-III are in line with previous studies.7,17 How-ever, the finding of good internal consistency on all FPQ-SF subscales by Asmundson et al14 was not replicated in this study. Few studies have examined the FPQ-SF. In this study, the FPQ-III was administered to all participants. Future investigations should administer and examine the FPQ-SF, as other results may emerge when subjects respond to this shorter FOP questionnaire.
This study used a Norwegian version of the FPQ-III. Therefore, translation or linguistic issues may have influenced the results. The Norwegian version of the FPQ-III was devel-oped by Lyby et al by translation and back-translation.4 It has been argued that back-translation is highly important in the translation process as it enables identification of translation or linguistic errors or imprecisions.27 However, retransla-tion was not conducted in the translaretransla-tion process with the Norwegian version of the FPQ-III. Future studies could use translation, back-translation and retranslation to ensure an optimal final translation.
A probable explanation of the discrepancies between our findings and findings made in previous studies is that cultural issues influence FOP scoring. Social, cultural and psycho-logic factors mediate pain behavior,28,29 and some cultures value expression of emotional and physiologic distress more
than other cultures.30 Cultural variations have been found in the expression of pain31 and in the effectiveness of analgesic medications.32–34 Additionally, it has been demonstrated that there are cross-cultural sex differences in attitudes toward the expression of pain.35 One study reported that Indian research participants disapproved pain expression to a greater extent than American research participants. Moreover, the results revealed that participants from both countries considered pain expression by males less appropriate than pain expression by females. Hobara included a sample of Japanese and Euro-American participants, and found that Japanese participants were less accepting of pain expression than Euro-American participants.30 Furthermore, participants from the Japanese culture disapproved male pain expression to a larger extent than participants from the Euro-American culture. Such cultural differences may also apply to sex differences in FOP observed in this and other studies, and may be related to differing gender role stereotypes or gender role expecta-tions between cultures. The significant impact of gender role stereotypes is supported by several studies demonstrating that males report lower pain to female experimenters than to male experimenters.36–38 Thus, cultural factors combined with psychosocial factors may increase or decrease pain expres-sion, but the relative contribution of cultural factors remains unknown. Previous studies employing the German and English versions of the FPQ-III have reported considerably lower mean subscale scores compared to the present study.7,16 The mean subscale scores from our sample correspond to, for example, Roelofs et al,9 who used a Dutch version of the FPQ-III. Further investigations that include samples with dif-ferent languages and/or samples from difdif-ferent cultures could help to clarify issues of linguistic and cultural differences. In summary, none of the FOP models seemed to capture FOP well, thus questioning the questionnaires’ applicability in Norway. In other words, these models do not capture the structural constructs of FOP well in Norway.
In line with our hypothesis, there were differences in model fit for males and females. The fit indices showed that FPQ-III had a slightly better fit for males than females, whereas the FPQ-SF had a slightly better fit for females than males. The multigroup CFA analysis confirmed the differ-ences in the FPQ-III model, but not in the FPQ-III model. In the FPQ-SF, 10 items were removed from the original FPQ-III model. Elimination of some of the items where sex differences occur may contribute to sex neutrality. However, the analysis still revealed sex differences on the FPQ-SF subscales, albeit nonsignificant for the whole model. A recent study found that sex differences on the FPQ-III were mainly due to differences in male and female responses to items
Table 4 Subscale intercorrelations (Pearson correlation) and
internal consistency (Cronbach’s a) of the FPQ-III subscales (N=807)
Factors Severe
Pain
Minor Pain
Medical Pain
Cronbach’s a
Severe Pain 0.854
Minor Pain 0.387** 0.821
Medical Pain 0.359** 0.537** 0.828
Notes: Acceptable Cronbach’s a <0.7. **p=0.001.
Abbreviation: FPQ-III, Fear of Pain Questionnaire-III.
Table 5 Subscale intercorrelations (Pearson correlation) and
internal consistency (Cronbach’s a) of the FPQ-SF subscales (N=807)
Factors Severe
Pain
Minor Pain
Injection Pain
Dental Pain
Cronbach’s a
Severe Pain 0.841
Minor Pain 0.352** 0.789
Injection Pain 0.132** 0.284** 0.843
Dental Pain 0.251** 0.370** 0.505** 0.706
Notes: Acceptable Cronbach’s a <0.7. **p<0.01.
Abbreviation: FPQ-SF, Fear of Pain Questionnaire-Short Form.
Journal of Pain Research downloaded from https://www.dovepress.com/ by 118.70.13.36 on 24-Aug-2020
Dovepress Factor analysis of FPQ-III and FPQ-SF
comprising the Severe Pain subscale.39 In that study, it was concluded that sex differences observed on the FPQ-III may have been due to different emotional reactions to or different interpretations of Severe Pain items in males and females. In females, such items may have elicited, for example, anxiety, while in males the items may have elicited, for example, fear. Anxiety may represent fear or worry about incidents that might occur in the future, while fear may be understood as an immediate and temporary reaction. The findings from this study support this, as the largest sex differences were observed on the Severe subscale.
Asmundson et al argued that the FPQ-SF was better adjusted for sex, compared to the FPQ-III.14 Our results sup-port this, as the FPQ-SF has better overall fit as well as better fit among both men and women. The multigroup analysis provides further support that the FPQ-SF is better adjusted for sex than the FPQ-III.
The sex differences in mean subscale FOP scores in our sample, displayed by the independent samples t-tests, revealed higher FOP in females than in males. Similar find-ings have been made previously.1,7,17,30,39 In a study by McNeil and Rainwater, sex differences were found on overall, Severe, Medical and Minor Pain subscales.7 Osman et al reported that females scored significantly higher on FOP than males on two of three subscales.17 Lyby et al found significantly higher overall FOP scores in females than males.1 Thus, there are some inconsistencies in the existing literature regarding where the sex differences in FOP appear, with some studies reporting sex differences on overall FOP and others at one or several of the subscales. However, the direction of the sex difference in FOP is consistent, with higher FOP in females than in males.
Sex differences in FOP scores measured by the FPQ-III have been observed in several different translated versions, including the Norwegian, English, Dutch and French versions of the FPQ-III.1,7–9,30,40 However, absence of sex differences has also been observed, for example, in the responses to the German FPQ-III version by Van Wijk et al.16 The larger sex differences in FOP in some languages compared to others may thus be explained by translational or linguistic issues.
Further investigations could examine possible contrib-uting factors for the observed sex differences in FOP by evaluating psychologic, physiologic, linguistic and/or cul-tural mechanisms. Refining the FPQ-III model may help on the proposed lack of sex neutrality, and thus develop it as a more reliable tool for measurement of FOP in both males and females.
Limitations
The present study has several limitations. First, all par-ticipants responded to the FPQ-III. Therefore, it is possible that other results would emerge if the FPQ-SF had been distributed. Future investigations should, therefore, include samples where the FPQ-SF, and not only the FPQ-III, is applied. Second, only nonclinical samples were included in this study, so the findings may not be generalizable to clini-cal samples. Third, the sample consisted of undergraduate students at the University of Tromsø, thus contributing to sample homogeneity of age and education. The discrepancy in findings in this and other studies may, therefore, be due to inclusion of participants of different age or educational statuses. Fourth, a Norwegian translation of the FPQ-III was used. Thus, the findings may not be directly transferable to FPQ measures in other languages and/or cultures.
Conclusion
The present study shows that none of the FOP models capture FOP well in this Norwegian nonclinical sample. However, the FPQ-SF is a better model than the FPQ-III. Additionally, sex differences were found in the two models fit. The FPQ-SF is a slightly better measurement theory of FOP for females, whereas the FPQ-III is slightly better for males. When testing if the models significantly differed in model fit across sex, the FPQ-SF was not significantly different, but the FPQ-III was. As none of the models proves good fit, adjustment of the FPQ to increase usefulness and ensure accurate FOP measures in Norwegian samples is highly recommended.
Acknowledgment
The present study was supported by the Bial Foundation.
Disclosure
The authors report no conflicts of interest in this work.
References
1. Lyby PS, Aslaksen PM, Flaten MA. Variability in placebo analgesia and the role of fear of pain – an ERP study. Pain. 2011;152(10): 2405–2412.
2. George SZ, Dannecker EA, Robinson ME. Fear of pain, not pain cata-strophizing, predicts acute pain intensity, but neither factor predicts tolerance or blood pressure reactivity: an experimental investigation in pain-free individuals. Eur J Pain. 2006;10(5):457–465.
3. James JE, Hardardottir D. Influence of attention focus and trait anxiety on tolerance of acute pain. Br J Health Psychol. 2002;7(2):149–162. 4. Lyby PS, Aslaksen PM, Flaten MA. Is fear of pain related to placebo
analgesia? J Psychosom Res. 2010;68(4):369–377.
5. Bartley EJ, Fillingim RB. Sex differences in pain: a brief review of clinical and experimental findings. Br J Anaesth. 2013;111(1):52–58.
Journal of Pain Research downloaded from https://www.dovepress.com/ by 118.70.13.36 on 24-Aug-2020
Dovepress
Journal of Pain Research
Publish your work in this journal
Submit your manuscript here: https://www.dovepress.com/journal-of-pain-research-journal
The Journal of Pain Research is an international, peer reviewed, open access, online journal that welcomes laboratory and clinical findings in the fields of pain research and the prevention and management of pain. Original research, reviews, symposium reports, hypoth-esis formation and commentaries are all considered for publication.
The manuscript management system is completely online and includes a very quick and fair peer-review system, which is all easy to use. Visit http://www.dovepress.com/testimonials.php to read real quotes from published authors.
Dove
press
Vambheim et al
6. Meulders A, Vansteenwegen D, Vlaeyen JW. Women, but not men, report increasingly more pain during repeated (un)predictable painful electrocutaneous stimulation: evidence for mediation by fear of pain.
Pain. 2012;153(5):1030–1041.
7. McNeil DW, Rainwater AJ. Development of the fear of pain questionnaire-III. J Behav Med. 1998;21(4):389–410.
8. Albaret MC, Sastre MT, Cottencin A, Mullet E. The fear of pain ques-tionnaire: factor structure in samples of young, middle-aged and elderly European people. Eur J Pain. 2004;8(3):273–281.
9. Roelofs J, Peters ML, Deutz J, Spijker C, Vlaeyen JW. The Fear of Pain Questionnaire (FPQ): further psychometric examination in a non-clinical sample. Pain. 2005;116(3):339–346.
10. Aslaksen PM, Bystad M, Vambheim SM, Flaten MA. Gender differences in placebo analgesia: event-related potentials and emotional modulation.
Psychosom Med. 2011;73(2):193–199.
11. Fillingim RB, King CD, Ribeiro-Dasilva MC, Rahim-Williams B, Riley JL 3rd. Sex, gender, and pain: a review of recent clinical and experimental findings. J Pain. 2009;10(5):447–485.
12. Crombez G, Vlaeyen JW, Heuts PH, Lysens R. Pain-related fear is more disabling than pain itself: evidence on the role of pain-related fear in chronic back pain disability. Pain. 1999;80(1):329–339.
13. Meulders A, Harvie DS, Bowering JK, Caragianis S, Vlaeyen JW, Moseley GL. Contingency learning deficits and generalization in chronic unilateral hand pain patients. J Pain. 2014;15(10):1046–1056. 14. Asmundson GJ, Bovell CV, Carleton NR, McWilliams LA. The Fear
of Pain Questionnaire – Short Form (FPQ-SF): factorial validity and psychometric properties. Pain. 2008;134(1):51–58.
15. Cardoso S, Esculpi D, Carvalho AR, et al. Fear of pain question-naire: adaptação para o português europeu [The European Portuguese adaptation of the Fear of Pain Questionnaire]. Rev Bras Reumatol. 2016;56(5):377–383. Portuguese.
16. van Wijk AJ, Hoogstraten J. Dutch translation of the fear of pain questionnaire: factor structure, reliability and validity. Eur J Pain. 2006;10(6):479–479. 17. Osman A, Breitenstein JL, Barrios FX, Gutierrez PM, Kopper BA.
The fear of pain questionnaire-III: further reliability and validity with nonclinical samples. J Behav Med. 2002;25(2):155–173.
18. Solé E, Castarlenas E, Sánchez-Rodríguez E, et al. The reliability and validity of the Spanish version of the fear of pain questionnaire. J Health Psychol. Epub January 10, 2017.
19. Aslaksen PM, Lyby PS. Fear of pain potentiates nocebo hyperalgesia.
J Pain Res. 2015;8:703.
20. Lyby PS, Forsberg JT, Åsli O, Flaten MA. Induced fear reduces the effec-tiveness of a placebo intervention on pain. Pain. 2012;153(5):1114–1121. 21. Russell DW. In search of underlying dimensions: the use (and abuse)
of factor analysis in personality and social psychology bulletin. Pers Soc Psychol Bull. 2016;28(12):1629–1646.
22. Bollen KA, Long JS. Testing Structural Equation Models. Beverly Hills, CA: SAGE Publications, Inc; 1993.
23. Hu LT, Bentler PM. Cutoff criteria for fit indexes in covariance struc-ture analysis: conventional criteria versus new alternatives. Struct Equ Modeling. 2009;6(1):1–55.
24. Cortina JM. What is coefficient alpha? An examination of theory and applications. J Applied Psychol. 1993;78(1):98–104.
25. Tabachnick BG, Fidell LS, Osterlind SJ. Using Multivariate Statistics.
4th edition. Needham Heights, MA: Allyn & Bacon; 2001.
26. Costello AB, Osborne JW. Best practices in exploratory factor analysis: four recommendations for getting the most from your analysis. Practical Assessment, Research & Evaluation. 2005;10:1–9.
27. Bradley C. Handbook of Psychology and Diabetes: a Guide to Psycho-logical Measurement in Diabetes Research and Practice. New York, NY: Harwood Academic Publishers. 2013.
28. Helman CG. Culture, Health and Illness. 5th ed. London, UK: Hodder Arnold; 2007.
29. Peacock S, Patel S. Cultural influences on pain. Rev Pain. 2008;1(2):6–9. 30. Hobara M. Beliefs about appropriate pain behavior: cross-cultural and sex differences between Japanese and Euro-Americans. Eur J Pain. 2005;9(4):389–389.
31. Wolff BB, Langley S. Cultural factors and the response to pain. Am Anthropol. 1968;70:494–501.
32. Cleeland CS, Gonin R, Baez L, Loehrer P, Pandya KJ. Pain and treat-ment of pain in minority patients with cancer. The eastern Oncology Group Minority Outpatient Pain Study. Ann Intern Med. 1997;127(9): 813–816.
33. Houghton IT, Chan K, Wong YC, Ann CS, Lan OW, Lowe DM. Pethidine pharmacokinetics after intramuscular dose: a comparison in Caucasian, Chinese and Nepalese patients. Anasth Intensive Care. 1992;29(1):52–55.
34. Streltzer J, Wade T. The influence of cultural group on the undertreat-ment of postoperative pain. Psychosom Med. 1981;43(5):397–403. 35. Nayak S, Shiflett SC, Eshun S, Levine FM. Culture and gender effects
in pain beliefs and the prediction of pain tolerance. Cross Cult Res. 2000;34:135–151.
36. Aslaksen PM, Myrbakk IN, Høifødt RS, Flaten MA. The effect of experimenter gender on autonomic and subjective responses to pain stimuli. Pain. 2007;129(3):260–268.
37. Klonoff EA, Landrine H, Brown M. Appraisal and response to pain may be a function of its bodily location. J Psychosom Res. 1993;37(6):661–670.
38. Levine FM, De Simone L. The effects of experimenter gender on pain report in male and female subjects. Pain. 1991;44(1):69–72. 39. Vambheim SM, Øien RA. Sex differences in fear of pain: item level
analysis of the fear of pain questionnaire III. J Pain Res. 2017;10: 825–831.
40. Sullivan MJ, Thorn B, Rodgers W, Ward LC. Path model of psychologi-cal antecedents to pain experience: experimental and clinipsychologi-cal findings.
Clin J Pain. 2004;20(3):164.
Journal of Pain Research downloaded from https://www.dovepress.com/ by 118.70.13.36 on 24-Aug-2020