ARIMA forecasting of PM2.5 and PM10 trends: effects of continuing social distancing on air quality in a Southeast Asian urban area
Andrio Adwibowo*
Abstract It has been hypothesized that social distancing as the prevention measures for
COVID 19 can affect the air quality including
PM2.5 and PM10 in urban areas. According to this
situation, this study aims to compare the PM2.5
and PM10 before and after the implementation of
social distancing. Likewise, this study also
forecasts the benefits of social distancing on
PM2.5 and PM10 if social distancing period is
continued and extended. To achieve these
objectives, an Auto Regressive Integrated
Moving Average (ARIMA) model to investigate
the daily PM2.5 and PM10 trends has been
developed for social distancing periods (March–
May 2020) and after May as well. The model
confirms that if social distancing period is
extended after May 2020 then the PM2.5 and
PM10 are estimated will be 4% and 9% lower. To
confirm that the PM2.5 and PM10 reductions are
only due to social distancing effect, the study
has investigated the possible effects of wind
speed and rainfall on PM2.5 and PM10.
Nonetheless, the reductions do not correlate with
those factors. To conclude social distancing
should be considered as an option to control
PM2.5 and PM10 in urban areas.
Keywords: ARIMA, COVID 19, forecast,
PM2.5, PM10, social distancing
* U. of Indonesia 16424, West Java, Indonesia
Email: [email protected].
Presently, particulate matter (PM) is
considered as one of the pollutants that can have
impacts on urban air quality (Badura 2018).
Volcanic dust or desert dust particles and sea
spray aerosols are known as the origin of PM in
natural settings. Nonetheless, in urban setting
the PM is originated from anthropogenic
activities. Those activities including transport,
agriculture, industrial processes, and household
fuel combustions.
The particulate matters which are also known
as aerosols are divided into 2 types according to
its coarseness. Those suspended particles in the
atmosphere include fine particulate matter
(PM2.5) and coarse particulate matter (PM10).
The particle diameters of PM2.5 and PM10 are
<2.5 µm and <10 µm, and both measured as
µg/m3. The PM2.5 and PM10 have different
sources and characteristics and able to interact
with solar radiation, affect air quality, visibility,
and the climate system including surface
temperature and rain fall as well (Cruz and
Pandis 1997, Sun and Ariya 2006, Zhang and
Cao 2015).
Currently, the presence of fine particulate
pollution especially in urban areas in the form of
recorded PM2.5 and PM10 has become a global
issue due to its impact on human health, air
quality, and the climate system as well.
Correspondingly, routine air quality monitoring
has been established in many countries for
regular measurement of PM2.5 and PM10, for
epidemiological studies as well as for the
management of air quality (Al-Saadi et al.
2005, Gomišcek et al. 2004).
Regarding epidemiological studies, the
presence of current social distancing as parts of
current COVID 19 pandemic prevention has
been considered has an effect on the air quality
including PM2.5 and PM10. A recent study by Xu
et al. (2020) has provided a very comprehensive
coverage regarding the impacts of the COVID
19 event on air quality in central China.
In urban areas mainly in Southeast Asian
countries, there are several literatures that have
discussed extensively the PM2.5 and PM10
contents (Mohddin and Aminuddin 2014, Noor
et al. 2015, Hossen and Hoque 2016).
Nonetheless the COVID 19 event prevention in
the form of social distancing related air quality
studies are still limited. Meanwhile, several
urban areas in Southeast Asian countries have
experienced significant COVID 19 events. One
of the populated urban areas is Jakarta. In here,
social distancing was scheduled from
mid-March through late May 2020. According that
situation, this study aims to compare the PM2.5
and PM10 before and after the implementation of
social distancing. Likewise, an ARIMA model is
used to investigate how far social distancing will
affect the PM2.5 and PM10 if social distancing
period is extended.
Methodology
PM2.5 and PM10 monitoring
The PM2.5 and PM10 were monitored daily
from March to May 2020. The March was
representing the period before social distancing
and April and May were representing the periods
after social distancing. The PM2.5 and PM10 data
were obtained from meteorology agency and
covered Jakarta, the one of populated urban
areas in Southeast Asian. All PM2.5 and PM10
data were measured as µg/m3.
Wind and rainfall monitoring
It has been hypothesized that the
meteorological parameters including wind speed
and rainfall can affect the PM2.5 and PM10 (Wang
and Ogawa 2015, Zhang et al. 2017). In this
study and to complement the PM2.5 and PM10
analysis, the daily wind speed (km/h) and
rainfall (mm/day) data were also collected from
meteorology agency.
ARIMA forecasting
ARIMA is abbreviation for Auto Regressive
Integrated Moving Average. This statistical
approach is a versatile tool in forecasting an
event in many fields (Alsharif et al. 2019,
Tektas 2010). In ARIMA, autoregressive is
stationarized series lags in the forecasting
equation and moving average is the forecast
error lags. The ARIMA forecasting equation is
constructed as follows. First step to construct the
equation is denoting the dth difference of Y by y
below:
If d = 0: yt = Yt
If d = 1: yt = Yt-Yt-1
If d = 2: yt = (Yt-Yt-1)-(Yt-1-Yt-2) = Yt-2Yt-1+
Yt-2.
Based on y terms, the ARIMA forecasting
equation is:
The ARIMA model is used to forecast the
trends of PM2.5 and PM10 after the end of May
2020.
Results
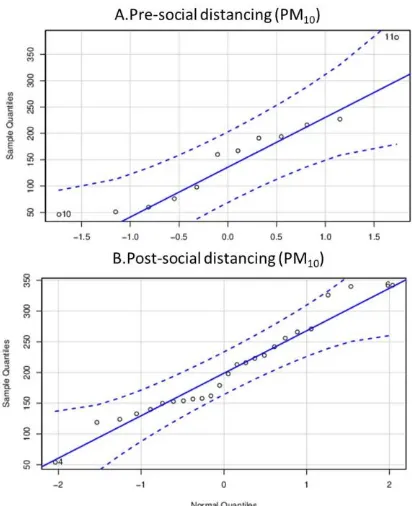
A quantile–quantile (QQ) plot of PM2.5 and
PM10 is shown in Figure 1 and 2. The QQ plots
were presented as comparisons of before and
after social distancing periods. Before social
distancing period, there were high frequencies of
PM2.5 within the ranges of 150-200 ug/m3.
Nonetheless, after social distancing has been
implemented, PM2.5 within the ranges of
100-150 ug/m3 were observed frequently. The similar
patterns were also observed for PM10 for before
and after social distancing periods (Figure 2).
Even though the PM2.5 and PM10 showed a
fluctuation pattern, there were reductions
observed in April and May after social
distancing was implemented.
The Figure 3 and 4 shows how the PM2.5 and
PM10 were correlated with the external factors
including the wind speed and rainfall. The
frequent wind speed ranges were 1-15 km/h
while rainfalls within the range of 1-2 mm/day
were common. Nonetheless, according to the
correlation plots there were no significant effects
of wind speed and rainfall on the both PM2.5 and
PM10.
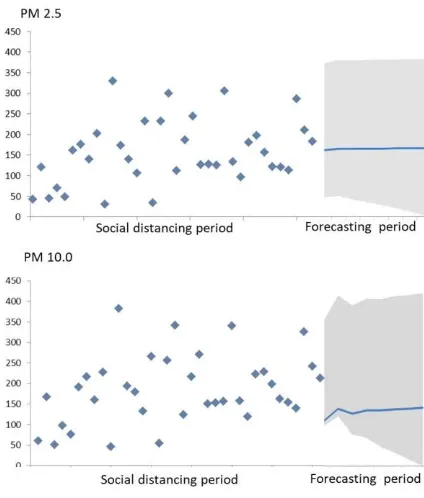
The ARIMA forecasting confirms that the
PM2.5 average will be 4% lower and the trend
remains stable in a period after social distancing
(Figure 5, 6). The lower average value was also
observed for forecasted PM10. For the PM10, it is
estimated that the average will be 9% lower and
it also remains stable.
Figure 1. Normal probability plots (QQ-plot) of daily PM2.5 before/pre/March (A) and after /post/April-May (B) social distancing.
Discussion
The PM2.5 and PM10 measured in this study
were also comparable to other urban areas. The
data provided by Zhang et al. (2017) showed
that in an urban industrialized area, the range of
PM2.5 was 6–209 µg/m3 and PM10 can be higher
with the range was 13–422 µg/m3. Another study
in 10 urban areas found the monthly average
PM2.5 ranges were >150–250 µg/m3 and
>250–300 µg/m3 for PM10 (Li et al. 2020).
In this study the ranges for PM2.5 and PM10 are
32–329 µg/m3 and 46–382 µg/m3 respectively.
Both the PM10 and PM2.5 were observed
lower after social distancing than before social
distancing was implemented. There are several
literatures that have reported the impacts of
social distancing on PM10 and PM2.5. A decrease
in air pollutant concentration as a consequence Figure 3. Correlation plots of daily PM2.5 and
PM10 with wind speed (km/h).
Figure 4. Correlation plots of daily PM2.5 and PM10 with rainfall (mm/day).
Figure 6. ARIMA model of daily PM2.5 and PM10 for social distancing and forecasting periods.
of social distancing in the form of mobility
reduction in São Paulo since March 22, 2020 has
been recorded by Freitas et al. (2020). The
PM2.5 values originated from diesel vehicle
exhaust, soil resuspension, and biomass burning
were on average 3.7 µg/m3 lower than values
without mobility reduction. Similarly, PM10
average concentrations were also 4.6 µg/m3
lower. The similar conditions were also reported
in the Asian urban areas. In 3 cities in China
after the epidemic prevention and control actions
had been taken, the average values of PM2.5 and
PM10 were observed 30% and 40% respectively
lower than the values without epidemic
prevention (Xu et al. 2020).
A comprehensive study of social distancing
impacts on air quality in particular Southeast
Asian country has been reported by Abdullah et
al. (2020). In their study, they reported that
social distancing in Malaysia or widely known
as Movement Control Order (MCO) has been
found to reduce PM2.5 levels. In several cities in
Malaysia, the range variations of PM2.5
reductions were 6–23%, 8–16%, 11–13%,
7–11%, 15–23%, and 9–16%.
The above aforementioned situations
characterized by PM2.5 and PM10 reductions are
best explained by the anthropogenic activities.
Social distancing was fundamental detrimental
factors causing the reduction of daily routine
activities commonly occurs in the urban,
commercial, and industrial areas. Nonetheless,
before social distancing was applied, there are
significant activities lead to the peak of PM10
and PM2.5 Noor et al. (2015) reported that the
PM10 peaks in residential areas were frequently
observed at 9.00 am when people were leaving
their home and reach the maximum peak at
10.00 pm when they were returning from school
and work. During some particular times, the
numbers of people performing their daily routine
increase the motor vehicle numbers along with
their emissions. The evening PM10 peak starts
from 6.00 pm to 11.00 pm. The higher PM10 and
PM2.5 before social distancing period were
evidence of the influence of traffic and other
anthropogenic activities on PM10 and PM2.which
is still allowed at that period (Garcia et al.
2016).
Beside anthropogenic factors, the PM10 and
PM2.5 are related to other regional external
factors. For instance, Noor et al. (2015) reported
that the PM10 variations are influenced by wind,
rainfall, and season. The sudden PM10 peak can
happens due to the wind that contains and
delivers particles from other places.
Nevertheless, PM10 can be so low due to the
rainfall (Sansuddin et al. 2010). A seasonal
variation of rainfall can also affect the PM10
seasonal fluctuation (Juneng et al. 2009). It
requires the increase of rainfall from 20 mm/day
to 100 mm/day to reduce the PM2.5 ranges from
20-35 µg/m3 to 5-7 µg/m3 (Li et al. 2017, Wang
and Ogawa 2015).
Season was also responsible for the PM10
variations (Hamid et al. 2018). It was observed
that during the Southwest Monsoon the annual
thresholds while the PM10 concentration during
the Northeast Monsoon was below the
acceptable levels.
Despite the previous studies have found the
fundamental correlations of the external factors
including seasons, wind, and rainfall,
nonetheless those factors are not significant in
this study. Regarding the seasons, the location
of this study is only having 2 seasons including
the rain and dry seasons. This study was
conducted during the homogenous rainy seasons
with constants and stationary rainfalls. The
recorded rainfalls during study period were
dominated by the 0-2 mm/day ranges followed
by the infrequent 3-8 mm/day ranges. While it
takes a 20-100 mm/day rainfall range to cause
variation and reduction of the PM2.5 (Li et al.
2017).
Regarding the wind that assumed
hypothetically can increase the PM10 and PM2.5
due to the particles contained, this situation is
not observed in this study. The study site was
surrounded by settlement and suburban land
uses rather than industrial, commercial, or
emission generated land uses. Without the
presence of industry in surrounding areas, then
the prevailing winds will contain few particles
and as consequence it will contribute less to the
PM10 and PM2.5.
Besides delivering the particles, the wind can
also remove the particles and reduce the PM2.5.
Li et al. (2017) reported that the reductions of
PM2.5 from 35 to 15 µg/m3 were caused by the
increase of wind speed from 5 to 30 km/h.
While, in this study, the most frequent wind
speed were ranging from 1 to 10 km/h and has
less effects on PM2.5.
Currently, there are several approaches can
be used to forecast PM10 and PM2.5, they include
statistical models, chemical transport, and
machine learning (Deters et al. 2017). Statistical
models emphasized on single variable linear
regression have generally shown a negative
correlation between PM10, PM2.5 and different
meteorological parameters (wind, rainfall, and
temperature). The recent one is the ARIMA
model. Unlike a pure statistical method, ARIMA
model only requires the time series prior data to
generalize the forecast. Likewise, this model can
increase the forecast accuracy while keeping the
number of parameters to a minimum. This is the
reason why ARIMA model is increasingly used
to predict air quality (Abhilash et al. 2018,
Arafat and Amir 2012, Wang et al. 2009).
In this study, a social distancing related
ARIMA forecasting of PM2.5 and PM10 has been
proposed. The finding confirms and forecasts
that PM2.5 and PM10 will decrease. A capability
of ARIMA model to do the forecasting of PM2.5
and PM10 has been discussed by Zhang et al.
(2017). The model can also adopt the
environmental factors that may affect the
dynamic of PM2.5 and PM10. In their study, the
forecasted PM10 was observed fluctuating
according to the seasons. Most recent studies
even though have investigated the forecasted
PM2.5 and PM10, nonetheless none of them have
from conditional factors in the form of policy in
this case social distancing. However, as
indicated by previous studies that environmental
factors may influence the PM2.5 and PM10 trends,
then it is possible that conditional factors like
tested in this study can affect the PM2.5 and PM10
trends. As observed in this study, social
distancing period factor if it is continued and
extended can lower the PM2.5 and PM10 in the
future. Study by Zhang et al. (2018) has
confirmed that policy factors can even
contribute to reduce the PM2.5. In their study, the
forecasted PM2.5 ranges were reduced from 19–
52 μg/m3
to 15–30 μg/m3. This reduction is
assumed related to the local policy on air
quality.
Conclusion
Social distancing period has caused reduction
of PM2.5 and PM10 ranges from 150-200 μg/m3 to
100-150 μg/m3. The wind speed and rainfall
were having less contribution in affecting the
PM2.5 and PM10 in before and after social
distancing periods. The ARIMA forecasting
confirms that by continuing social distancing
period, it is estimated that the PM2.5 and PM10
will be 4% and 9% lower.
Recommendation
Social distancing period is forecasted can lower the PM2.5 and PM10. For this reason, social
distancing should be opted as a promising
solution to control the PM2.5 and PM10 mainly in
the urban areas.
References
Abdullah S, Mansor AA, Liyana NN, Napi M,
Mansor WNW, Ahmed AN, Ismail M, Ramly
ZTA. 2020. Air quality status during 2020
Malaysia Movement Control Order (MCO)
due to 2019 novel coronavirus (2019-nCoV)
pandemic. Sci Total Environ.
Abhilash M, Thakur A, Gupta D, Sreevidya B.
2018. Time Series Analysis of Air Pollution
in Bengaluru Using ARIMA Model. Ambient
Communications and Computer Systems.
413-426.
Al-Saadi J, Szykman J, Pierce RB, Kittaka C,
Neil D, Chu DA, Remer L, Gumley L, Prins
E, Weinstock L. 2005. Improving National
Air Quality Forecasts with Satellite Aerosol
Observations. Bull. Am. Meteorol. Soc. 86:
1249–1261.
Alsharif MH, Younes MK, Kim J. 2019. Time
Series ARIMA Model for Prediction of Daily
and Monthly Average Global Solar
Radiation: The Case Study of Seoul, South
Korea. Symmetry. 11(240)
Arafat RM, Amir HM. 2012. Time Series
Analysis Model for Particulate Matter of Air
Pollution Data in Dhaka City. Asian Journal
of Water, Environment and Pollution. 9(4):
63-69.
Badura M. 2018. Evaluation of Low-Cost
Sensors for Ambient PM2.5 Monitoring.
Journal of Sensors.
Couvidat F, Bessagnet B, Vivanco MG, Real E,
Menut L, Colette A. 2018 . Development of
an inorganic and organic aerosol model
(CHIMERE 2017 β v1.0): seasonal and
Geoscientific Model Development. 11: 165-
194.
Cruz CN, Pandis SN. 1997. A study of the
ability of pure secondary organic aerosol to
act a cloud condensation nuclei. Atmos.
Environ. 31: 2205-2214.
Deters JK, Zalakeviciute R, Gonzalez M, Yves
Rybarczyk Y. 2017. Modeling PM2.5 Urban
Pollution Using Machine Learning and
Selected Meteorological Parameters. Journal
of Electrical and Computer Engineering.
Freitas ED, Ibarra-Espinosa SA, Gavidia-
Calderón ME, Rehbein A, Abou Rafee SA,
Martins JA, Martins LD, Santos UP, Ning
MF, Andrade MF, Trindade RIF. 2020.
Mobility Restrictions and Air Quality under
COVID-19 Pandemic in São Paulo, Brazil.
Preprints. 2020040515.
García MÁ, Sánchez ML, de los Ríos A. 2019.
Analysis of PM10 and PM2.5 Concentrations
in an Urban Atmosphere in Northern Spain.
Arch. Environ. Contam. Toxicol. 76:331–345. Gomišcek B, Hauck H, Stopper S, Preining O.
2004. Spatial and temporal variations of PM1,
PM2.5, PM10 and particle number
concentration during the AUPHEP—Project.
Atmos. Environ., 38: 3917–3934.
Hamid HA, Rahmat MH, Sapani SA. 2018.
The classification of PM10 concentrations in
Johor Based on Seasonal Monsoons
IOP Conference Series: Earth and
Environmental Science. 140.
Hossen MA and Hoque A. 2016,.A. Variation of
Ambient Air Quality Scenario in Chittagong
City: A Case Study of Air Pollution.
Preprints 2016080174.
Juneng L, Latif MT, Tangang FT, Mansor H.
2009.Spatio-temporal characteristics of
PM10 concentration across Malaysia.
Atmospheric Environment. 43: 30.
Li X, Feng Y, Liang H. 2017. The Impact of
Meteorological Factors on PM2.5 Variations
in Hong Kong. IOP Conference Series: Earth
and Environmental Science. 78.
Li X, Zhou X, Tong W. 2020. Spatiotemporal
Analysis of Air Pollution and Its Application
in Public Health. Elsevier.
Mohddin S, Aminuddin N. 2014. The exposure
assessment of airborne particulates matter
(PM10 & PM2.5) towards building occupants:
A case study at KL Sentral, Kuala Lumpur,
Malaysia. IOP Conference Series: Earth and
Environmental Science.
Noor NM, Yahaya AS, Ramli N, Luca F,
Abdullah M, Sandu AV. 2015. Variation of
air pollutant (particulate matter - PM10) in
peninsular Malaysia: Study in the southwest
coast of peninsular Malaysia. Revista de
Chimie -Bucharest- Original Edition-. 66:
1443-1447.
Sansuddin N, Yahaya AS, Ramli N, Yusof N,
Ghazali NA, Al Madhoun W. 2010.
Statistical analysis of PM10 concentrations at
different locations in Malaysia.
Environmental monitoring and assessment. 180: 573-88.
Sun J, Ariya P. 2006. Atmospheric organic and
(CCN) :A review. Atmos. Environ., 40: 795–
820.
Tektas M. 2010. Weather Forecasting Using
ANFIS and ARIMA MODELS.
Environmental Research, Engineering and
Management. 1(51): 5 – 10.
Xu K, Cui K, Young LH, Hsieh YK,
Wang YF, Zhan J, Wan S. 2020.
Impact of the COVID-19 Event on Air
Quality in Central China. Aerosol Air Qual.
Res. 20:915-929
Zhang YL, Cao F. 2015. Fine particulate matter
(PM2.5) in China at a city level. Sci. Rep.5.
Zhang B, Jiao L, Xu G, Zhao S, Tang X, Zhou
Y, Chen G. 2017. Influences of wind and
precipitation on different-sized particulate
matter concentrations (PM2.5, PM10, PM2.5–10).
Meteorology and Atmospheric Physics.
Zhang H, Zhang S, Wang P, Qinc Y, Wang H.
2017. Forecasting of particulate matter time
series using wavelet analysis and wavelet-
ARMA/ARIMA model in Taiyuan, China.
Journal Of The Air & Waste Management
Association. 67 (7): 776–788.
Zhang L, Lin J, Qiu R, Hu X, Zhang H, Chen Q,
Tan H, Lin D, Wang J. 2018. Trend analysis
and forecast of PM2.5 in Fuzhou, China using
the ARIMA model. Ecological Indicators. 95:
702-710.
Wang J, Ogawa S. 2015. Effects of
Meteorological Conditions on PM2.5
Concentrations in Nagasaki, Japan. Int. J.
Environ. Res. Public. Health. 12(8):
9089–9101.
Wang W, Guo Y. 2009. Air Pollution PM2.5
Data Analysis in Los Angeles Long Beach
with Seasonal ARIMA Model. International
Conference on Energy and Environment