A STUDY ON CONSUMER PREFERENCE OF WATER PURIFIER IN THIRUVARUR DISTRICT
C.PRABHA ASSISTANT PROF. IN COMMERCE STET WOMEN’S COLLEGE MANNARGUDI
ABSTRACT
India has a rich and varied culture. It will be interesting to understand the nature and characteristics of
the Indian consumers. Whose buying decisions will be based on the influence of the values, beliefs,
customs and practices and behaviour of the particular of which they are apart. Right from the time there
has been exchange of goods and services between the buyer and sellers, the ultimate success of all the
economic activities has primarily depend on the producer manufacturing and selling goods and services
desired by the target consumer. The ultimate decision of whether or not to purchase a product or
service and from whom to buy has always been vested in the hands of the final consumers. One can
imagine north pole, where it is very cold. This only goes to show the marketers have to revolve every
marketing activity around the ultimate consumer. Since the focus of attention is on the consumer, the
marketer is always probing and trying to learn.
INTRODUCTION
To become a successful marketer it is necessary to understand the liking and disliking of consumers.
Gone are the days when the concept of market was ‘let the consumer beware’. Now the whole concept
of market has changed. Now there is concept of ‘consumer’s sovereignty’, which means the consumer is
the king. In other words the marketers face the buyer’s market and not the seller’s market. In modern
marketing when we cannot thing for a moment that business are alone is disregarding the consumer’s
voice. One of the best example of the importance of consumers voice is that the United States mint
produced millions of Susan B. Anthony $1 coin between 1979 and 1981 only to have them over
whelmingly rejected by the people. Those in charge never thought to ask the people first. If this had
been done, it would have been found that this new coin is almost identical in size to the quarter ($25
piece) and hence is readily confused. Further, the Amstar Corporation introduced Domino Liquid Brown
Sugar in 1978, the company spent over $1 million in consumer advertising in confident expectation that
the brand would capture at least a 12 percent market share. These benefits of the liquid form to be of
little importance. From the above examples I become clear that understanding consumer motivation
the understanding of how individuals and organizations behave in a purchase condition. It is really a
psychology applied to a specify buy situation. The term consumer behaviour refers to the behaviour
that consumers display in searching for purchasing using evaluating and disposing of economic products
and service that they expect will satisfy their needs. The study of consumer behaviour helps us to know
that how individuals and organization as buyers make decisions to spend on consumption related items.
In other words the study of consumer behaviour is the study of what they buy, why they but it, when
they buy it, how often they buy it, and how often they use it.
Definition:
“A Consumer Market can be defined as all the individuals and households who buy goods and
service for personal consumption”.
This means all the persons and families which will purchase either goods / services for personal
consumption can be said to be a part of the consumer market.
According to Loudon and Della Bitta
Consumer behaviour is the decision of process and physical activity individuals engage in when
evaluating, using or disposing goods and services”.
Water
When Neil Armstrong saw the Earth from the Moon, it appeared blue! This is because water covers
more than two–thirds of the Earth’s surface. But fresh water represents less than 0.5percentage of the
total water on Earth. The rest is either in the form of seawater or locked up in icecaps or the soil, which
is why one often hears of water scarcity in many areas.Water is continuously moving around the earth
and constantly changing its form. It evaporates from land and water bodies and is also produced by all
forms of life of Earth. This water vapours moves through the atmosphere, condenses to form clouds
and precipitates as rain and snow. In time, the water returns to where it came from, and the process
begins al over again. Although water is constantly moving, its total quantity on Earth’s surface is
Forms of water
Water is found in three different forms–liquid, solid or gas, depending on the temperature but it
constantly changes from one form to another. Changes in temperature will determine which of these
forms predominates in a particular area.
Liquid
Water is usually encountered in the liquid state, because this is the natural state when temperatures are
between 0ºC and 100ºC. ‘Fresh’ or drinking water is found as groundwater in underground aquifers,
and on the surface in ponds, lakes, and rivers. Seas and oceans account for 97percentage of all water on
Earth; but their waters contain dissolved salts and are therefore unfit to drink. In regions of young
volcanic activity, hot water emerges from the earth in hot springs (examples are Garampani in Assam
and Badrinatn in Uttaranchal).
SolidIce is the frozen form of water. It occurs when temperatures are below 0ºC (32ºF). For a given
mass, ice occupies 9percentage more volume than water, which is why when water enters cracks in
rocks and freezes in causes the rock to crack and split. Being less dense than water, ice floats. This
property of ice is vital to aquatic life in cold regions. As the temperature drops, ice forms a protective,
insulating layer on the surfaces of streams, pools and other water bodies, allowing water to remain
liquid in the layers beneath and life to survive. Glaciers, icebergs, and ice caps are all frozen water.
Gas
Water is found in the atmosphere in its gaseous form, water vapour. Steam is nothing but vaporized
water. In certain hot water springs called geysers, sets of steam and hot water rise one hundred feet or
more from the ground. A large amount of water is wasted in agriculture, industry and urban areas. It
has been estimated that with available technologies and better operational practices, agricultural water
demand could be cut by about 50percentage, and that in urban areas by about 33percentage without
affecting the quality or economics of life. But most governments do not have adequate laws or
regulations to protect their water systems. Due to the increase in population there has been a rise in
the demand for food, space for housing, consumer products, etc., which has in turn resulted in
increased industrialization, urbanization, and demands in agriculture thereby leading to both river and
Profile of water
Pacific Ocean in the biggest ocean covering approximately 32.6percentage of the earth’s
surface.
The Artic Ocean is the smallest ocean.
75percentage of the earth surface is covered with water.
More than 97percentage of the earth’s water is in its oceans.
About 2percentage of the available drinking water is frozen leaving only 1percentage for
drinking.
The world’s average rainfall is about 850mm
Water regulates the Earth’s temperature. It is also regulates the temperature of the human
body, carries nutrients and oxygen to cells, cushions joints, protects organs and tissues, and
removes waste.
60percentage – 75percentage of the human body is water – 82percentage of blood is water;
70percentage of the brain and 90percentage of the lungs are made up of water.
Blood in animals and sap implants is composed mainly of water.
To cook 1 cup of rice you need 2 cups of water but to wash the pan in which it has been cooked
you need 4–5 liters of water.
A dripping tap can waste up to 6 liters of water in a day.
More than half the creatures on the Earth are found under water.
Life on earth probably originated in water.
In the summer our bodies require about 2 liters of water daily. Here is the water content of
some foods (approximate)–95percentage in tomato, 91percentage in spinach, 1percentage in
milk, 85percentage in apples and 80percentage in potatoes.
10percentage of the earth’s surface is covered with ice.
There are more than one million people particularly in North Africa and Western and South Asia,
who lack access to a study supply of clean water.
Water Cycle
The different water sources of the earth get their water supply from precipitation, while the
sleet. This is the hydrologic cycle that continues forever thereby maintaining a balance between the
two.
Fresh water
Are you aware that only about 2.5percentage of the water on the earth can be drunk? The
balance 97.5percentage is salt water that we cannot use unless it is desalinated. Of the 2.5percentage
that we can use, about three–fourths is frozen in the ice caps and glaciers, leaving just one quarter for
household use. Fresh water is found in lakes, rivers, streams, underground and glaciers.
Water pollution
When toxic substances enter lakes, streams, rivers, oceans and other water bodies, they get dissolved or
lie suspended in water or get deposited on the bed. This results in the pollution of water whereby the
quality of the water deteriorates, affecting aquatic ecosystems. Pollutants can also seep down and
affect the groundwater deposits.
Water pollution has many sources. The most polluting of them are the city sewage and industrial waste
discharged into the rivers. The facilities to treat waste water are not adequate in any city in India.
Presently, only about 10percentage of the waste water generated is treated; the rest is discharged as it
contaminated and carries disease causing microbes. Agricultural run–off, or the water from the fields
that drains into rivers, is another major water pollutant as it contains fertilizers and pesticides.
Domestic sewage refers to waste water that is discarded from households. Also referred to as sanitary
sewage, such water contains a wide variety of dissolved and suspended impurities.
It amounts to a very fraction of sewage by weight. But it is large by volume and contains impurities such
as organic materials and plant nutrients that tend to rot. The main organic materials are food and
vegetable waste, plant nutrient come from chemical soaps, washing powders, etc. Domestic sewage is
also very likely to contain disease–causing microbes. Thus, disposal of domestic waste water is a
significant technical problem. Sewage generated from the urban areas in India has multiplied mainflod
since 1947.
Today, many people dump their garbage into streams, lakes, rivers, and seas, thus making water bodies
the final resting place of cans, bottles, plastics, and other household products. The various substances
that we use for keeping our houses clean add to water pollution as they contain harmful chemicals. In
the past, people mostly used soaps made from animal and vegetable fat for all types of washing. But
most of today’s cleaning products are synthetic detergents and come from the petrochemical industry.
Most detergents and washing powders contain phosphates, which are used to soften the water among
other things. These and other chemicals contained in washing powders affect the health of all forms of
life in the water.
Effects of water pollution
The effects of water pollution are not only devastating to people but also to animals, fish, and birds.
Polluted water is unsuitable for drinking, recreation, agriculture, and industry. It diminishes the
aesthetic quality of lakes and rivers. More seriously, contaminated water destroys aquatic life and
reduces its reproductive ability. Eventually, it is a hazard to human health. Nobody can escape the
effects of water pollution.
The individual and the community can help minimize water pollution. By simple housekeeping and
Water conservation
Our ancient religious texts and epics given a good insight into the water storage and conservation
systems that prevailed in those days. Over the years rising populations, growing industrialization, and
expanding agriculture have pushed up the demand for water. Efforts have been made to collect water
by building dams and reservoirs and digging wells; some countries have also tried to recycle and
desalinate (remove salts) water. Water conservation has become the need of the day. The idea of
ground water recharging by harvesting rainwater is gaining importance in many cities.
In the forests, water seeps gently into the ground as breaks the fall. This groundwater in turn feeds
wells, lakes, and rivers. Protecting forests means protecting water ‘catchments’. In ancient India,
people believed that forests were the ‘mothers’ of rivers and worshipped the sources of these water
bodies.
Rainwater harvesting
In urban areas, the construction of houses, footpaths and roads has left little exposed earth for water to
soak in. In parts of the rural areas of India, floodwater quickly flows to the rivers, which then dry up
soon after the rains stop. It this water can be held back, it can seep into the ground and recharge the
groundwater supply.This has become a very popular method of conserving water especially in the urban
areas. Rainwater harvesting essentially means collecting rainwater on the roofs of building and storing
it underground for later use. Not only does this recharging arrest groundwater depletion, it also raises
the declining water and can help augment water supply. Rainwater harvesting and artificial recharging
are becoming very important issues. It is essential to stop the decline in groundwater levels, arrest sea–
water ingress, i.e., prevent sea–water from moving landward, and conserve surface water run–off
during the rainy season.
Town planners and civic authority in many cities in India are introducing by laws making rainwater
harvesting compulsory in all new structures. No water or sewage connection would be given if a new
building did not have provisions for rainwater harvesting. Such rules should also be implemented in all
the other cities to ensure a rise in the groundwater level. Realizing the importance of recharging
harvesting in the capital and elsewhere. A number of government buildings have been asked to go in for
water harvesting in Delhi and other cities in India.
Benefits of rainwater harvesting are as follows:
Increases water availability
Checks the declining water table
Is environmentally friendly
Improving plant growth by using rainwater for irrigation because stored rainwater is free from pollutants as well as salts, minerals and other natural and man-made contaminants
Prevents soil erosion and flooding especially in urban areas
Statement of problem
The problem undertaken for the study purpose in consumer behaviour and preference towards
using water purifier. For this purpose preferential status of consumer are analyzed on what basis the
consumer prefers his brand and how his buying motive is created, area analyzed and conducted the
exact buying behaviour of the consumer towards using water purifier.
Scope of the study
The present research study has a very wide scope. It covers various. It is useful in several ways
to various people.
To study the consumer behaviour of water purifier.
To study the consumer awareness about the product.
To analyze the opinion price, quality of water purifier.
Objectives of the study:
To study the socio demographic characteristics of the respondents.
To know the various factors influencing quality of water purifier.
To identify the factors that influence to purchase branded water purifier.
Research Methodology
Since the objectives of the study are mainly concerned with customers attitude, the necessarily date for analysis were from primary and secondary data. Primary data are collected from the customers through questionnaire secondary data are collected from journals and magazines. On analysis of the condition, the researcher found that descriptive research design in appropriate for the study. The questionnaire was pre–tested on 150 respondents.
LIMITATION
The time factors were the major constraints because of which the researcher could not collect
more data in a short period.
It was very difficult to contact the consumers as they were busy with there regular day – to –day
activities.
The researcher as the area surveyed was quite large.
REVIEW OF LITERATURE
Customer satisfaction is “an emotional response to the experiences provided by, associated with
particular products or services purchased, retail outlets, or even molar patterns of behaviour such as
shopping and buyer behaviour, as well as the overall market place” (p.256).
Oliver (2002) The definition offered by Hunt (2010) put forward a definition as, “the summary
psychological state resulting when the emotion surrounding disconfirmed expectations is coupled with
the consumers’ prior feelings about the consumption experience” (p.27).
Customer/consumer satisfaction is “an evaluation that the chosen alternative is consistent with prior
beliefs with respect to that alternative” – Definition by Engel and Blackwell (2003) is “an evaluation
rendered that the (consumption) experience was at least as good as it was supposed to be” (p.459). Tse
and Wilton (2003) (p.501).
Berry and Parasuraman (2004) define as, “the consumer’s response to the evaluation of the
perceived discrepancy between prior expectations (or some other norm of performance) and the actual
It is the result of an evaluative process that contrasts prepurchase expectations with perceptions of
performance during and after the consumption experience.
Schiffman and Kanuk (2005) Woodruff and Gardian (1996) defines customer satisfaction as “The
individual’s perception of the performance of the product or service in relation to his or her
expectations”.
According to Hung (2006), “ satisfaction is a kind of stepping away from an experience and evaluating
it. One could have a pleasurable experience that caused dissatisfaction because even though it was
pleasurable, it wasn’t as pleasurable as it was supposed to be. So satisfaction / dissatisfaction isn’t an
emotion, it’s the evaluation of the emotion”. Define “Satisfaction, then, is the evaluation or feeling that
results from the disconfirmation process. It is not the comparison itself (i.e., the disconfirmation
process), but it is the customer’s response to the comparison. “A customer’s perception of the degree
to which their requirements have been fulfilled.”
According to Business Dictionary, customer satisfaction is, “Degree of satisfaction provided by the
goods or services of a firm as measured by the number of repeat customers.”
Customer’s satisfaction has been the subject of many research ventures and considerable
research evidence is available.
Sam Arthur Dewald (2007) has done the project with the objective of studying demographic
characteristics, to find suitable measures for improvement. The universe the study is 22. And the
researcher researched through 22 respondents and hence census method was followed. The above
research is an unpublished dissertation submitted to the Bharathidasan University.
Sahayam (2008) is an unpublished dissertation submitted to the Bharathidasan University. The
objective of the study the various dimension of customer’s satisfaction and suitable measures for
improvement of service. The researcher has used descriptive techniques. The samples size of the study
is 100. The researcher used one dimension namely service quality.
Masilamani. R (2009), in his study focused to analyse the “Consumer behaviour and Market
Potential of Mobile Services Industries in Trivandrum”. The study reveals that market potential of the
potential buyers. He found that majority of the respondents are not satisfied with the BPL mobile are
coverage.
Ramakrishnan. V (2010) in his study on “Market Potential and Consumer Awareness of the Anglo–
French Textiles with Special Reference to Home Sales Marketing in Pondicherry”. The study reveals that
the advertisement effectiveness towards Anglo–French textile products and also he focused the
frequency of purchase Anglo–French textile goods among the consumer. His conclusion was that the
quality and the price is the factor, which influenced the consumer purchase decisions for the textile
products.
Vignesh Kumar. V (2011) in his study on “Customer Satisfaction on Anabond 202 Super Glue in Madurai,
Chennai and Coimbatore Districts”. In his study focused to know the strength and weakness of Anabond
202 Super Glue and to know the opinion of the respondents towards the services provided by Anabond
Limited. His study found that Anabond is fast moving brand in Madurai, Chennai and Coimbatore.
Satisfaction has been broadly defined by Vavra, T.G. (2012) as a satisfactory post-purchase experience with a product or service given an existing purchase expectation.Howard and Sheth (2013) According to Westbrook and Reilly (2013) define satisfaction as, “The buyer’s cognitive state of being adequately or inadequately rewarded for the sacrifices he has undergone” (p.145).
TABLE NO – 3.1
CLASSIFICATION OF RESPONDENTS ON THE BASIS OF GENDER
S. No. Gender No. of Respondents Percentage
1 Male 74 49
2 Female 76 51
Total 150 100
Source: Primary Data
TABLE NO – 3.2
CLASSIFICATION OF RESPONDENTS ON THE BASIS OF AGE
S. No. Age No. of Respondents Percentage
1 Below 20 years 42 28
2 21 – 30 years 68 45
3 31 and above 40 27
Total 150 100
Source: Primary Data
From the above table shows that 45 percentage of the respondents in the age group of 21-30 years, 28 percentage of the respondents are in the age group of below 20 years and 27 percentage of the respondents are 31 years and above. Majority of the respondents are young generation because those aware the water pollution and methods of precaution so they have purchase the water purifier.
TABLE NO – 3.3
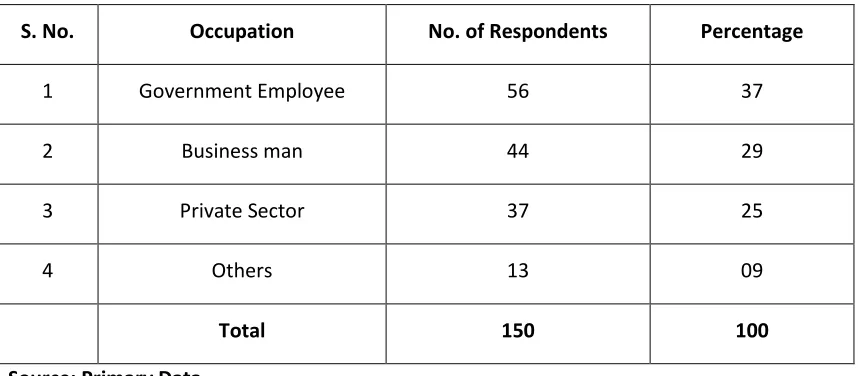
CLASSIFICATION OF RESPONDENTS ON THE BASIS OF OCCUPATION
S. No. Occupation No. of Respondents Percentage
1 Government Employee 56 37
2 Business man 44 29
3 Private Sector 37 25
4 Others 13 09
Total 150 100
Source: Primary Data
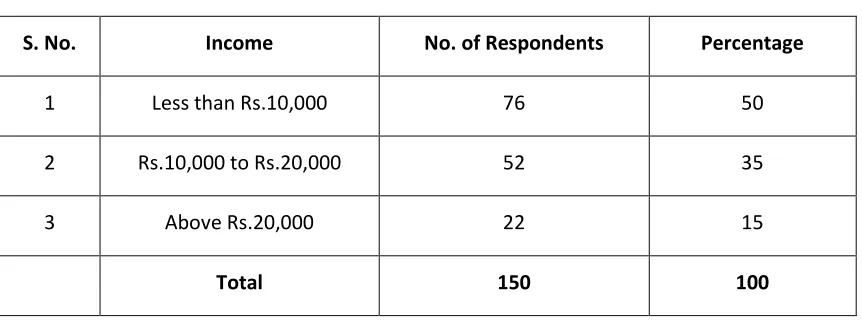
TABLE NO – 3.4
CLASSIFICATION OF RESPONDENTS ON THE BASIS OF INCOME OF THE RESPONDENTS
S. No. Income No. of Respondents Percentage
1 Less than Rs.10,000 76 50
2 Rs.10,000 to Rs.20,000 52 35
3 Above Rs.20,000 22 15
Total 150 100
Source: Primary data
The above table shows that majority 50 percentage of the respondents are earn the income of less than Rs.10000, 35 percentage of the respondents are the income of Rs.10000 to Rs.20000 and 15 percentage of the respondents are the income of above Rs.20000. The branded water purifier is reasonable price in the market, so middle income groups are easily purchase the product.
TABLE NO – 3.5
CLASSIFICATION OF RESPONDENTS ON THE BASIS OF OWING THE WATER PURIFIER
S. No Particular No. of Respondents Percentage
1 Yes 97 65
2 No 53 35
Total 150 100
Source: Primary Data
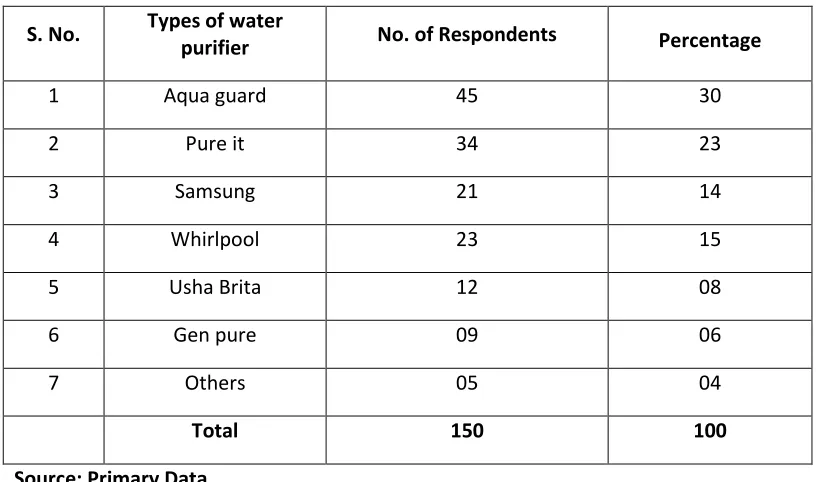
TABLE NO – 3.6
CLASSIFICATION OF RESPONDENTS ON THE BASIS OF PREFER THE WATER PURIFIER
S. No. Types of water
purifier No. of Respondents Percentage
1 Aqua guard 45 30
2 Pure it 34 23
3 Samsung 21 14
4 Whirlpool 23 15
5 Usha Brita 12 08
6 Gen pure 09 06
7 Others 05 04
Total 150 100
Source: Primary Data
From the above table shows that majority 30 percentage of the respondents are prefer the aqua guard and 15 percentage of the respondents are like whirlpool brand of water purifier. The aqua guard water purifier company past 25 years supply the products to the consumer without discrepancies and the whirlpool maintain goodwill in refrigerator and washing machine business, so the consumers are easily attract the product.
TABLE NO – 3.7
CLASSIFICATION OF RESPONDENTS ON THE BASIS OF CAPACITY OF WATER PURIFIER PREFERRED
S. No. Size of water purifier No. of Respondents Percentage
1 Below 10 liters 82 55
2 10-20 liters 42 28
3 20-30 liters 20 13
Source: Primary Data
The above table shows that majority 55 percentage of the respondents like below 10 liters of water purifier and only 4 percentage of the respondents are like above 30 liters. Majority of the respondents are like low quantity of water purifier due to daily change the water and convenience of installation and having highest size of family members purchase the high quantity of water purifier.
TABLE NO– 3.8
CLASSIFICATION OF RESPONDENTS ON THE BASIS OF AMOUNT SPEND FOR THE WATER PURIFIER
S. No. Amount No. of Respondents Percentage
1 Below Rs.5000 65 43
2 Rs.5001 to Rs.10000 43 29
3 Rs.10001 to Rs.20000 27 18
4 Above Rs.20000 15 10
Total 150 100
Source: Primary Data
The above table shows that majority 43 percentage of the respondents are spend below Rs.5000 and 18 percentage of the respondents are spend Rs.10001 to Rs.20000. Majority of the respondents are purchase low quantity of the water purifier so need small amount for the purchase of water purifier and 18 percentage of respondents purchase high quantity of water purifier.
TABLE NO – 3.9
CLASSIFICATION OF RESPONDENTS ON THE BASIS OF OPINION ABOUT THE PRICE
S. No. Opinion about the
price No. of Respondents Percentage
1 High 71 47
2 Moderate 67 45
3 Low 12 08
Source: Primary Data
The above table shows that 47 percentage of the respondents are opinion that the price of the product is high, 45 percentage of the respondents are opinion that the price is moderate and 8 percentage of the respondents are say the price is low.
TABLE NO – 3.10
CLASSIFICATION OF RESPONDENTS ON THE BASIS OF PERIOD OF USING THE BRAND
S. No. Using the brand No. of Respondents Percentage
1 Less 2 years 93 62
2 4 years 32 21
3 More than 4 years 25 17
Total 150 100
Source: Primary Data
The above table shows that 62 percentage of the respondents are using the water purifier less than 2 years, 21 percentage of the respondents are using 2 to 4 years and 17 percentage of the respondents are using above 4 years.
TABLE NO – 3.11
CLASSIFICATION OF RESPONDENTS ON THE BASIS OF SELECT THE PARTICULAR BRAND
S. No. Select the brand No. of Respondents Percentage
1 Quality 56 37
2 Design 32 21
3 Attractive picture 27 18
4 Color 22 15
5 Price 13 09
Total 150 100
Source: Primary Data
TABLE NO – 3.12
CLASSIFICATION OF RESPONDENTS ON THE BASIS OF SATISFACTION OF THE EXPECTATION
S. No. Expectation No. of Respondents Percentage
1 Fully satisfied 63 42
2 Satisfied 52 35
3 Dissatisfied 35 23
Total 150 100
Source: Primary Data
The above table shows that 42 percentage of the respondents are fully satisfied the expectation of the water purifier, 35 percentage of the respondents are satisfied and 23 percentage of the respondents are dissatisfied.
TABLE NO– 3.13
CLASSIFICATION OF RESPONDENTS ON THE BASIS OF PROBLEMS ON AFTER SALES SERVICE
S. No. Complaints No. of Respondents Percentage
1 Quality defect 95 62
2 Non availability of service
mechanic 37 25
3 No spare parts 18 12
Total 150 100
Source: Primary Data
TABLE NO– 3.14
CLASSIFICATION OF RESPONDENTS ON THE BASIS OF FACTORS INFLUENCING THE CONSUMER PURCHASE DECISION
S. No. Purchase decision No. of Respondents Percentage
1 Quality 63 42
2 Price 47 31
3 Advertisement 40 27
Total 150 100
Source: Primary Data
The above table shows that majority 42 percentage of the respondents are influenced by quality of the product, 31 percentage of the respondents are influenced by price and 27 percentage of the respondents are influenced by advertisement.
TABLE NO – 3.15
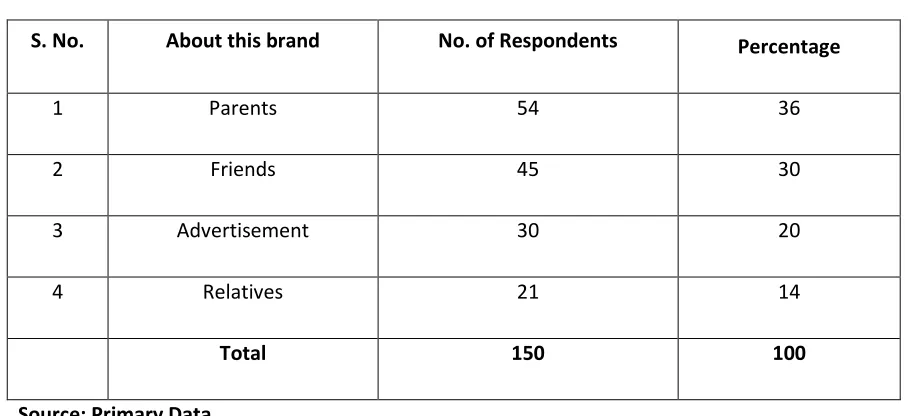
CLASSIFICATION OF RESPONDENTS ON THE BASIS OF KNOW ABOUT THIS BRAND
S. No. About this brand No. of Respondents Percentage
1 Parents 54 36
2 Friends 45 30
3 Advertisement 30 20
4 Relatives 21 14
Total 150 100
Source: Primary Data
FINDINGS, SUGGESTIONS AND CONCLUSION
FINDINGS
Majority 51 percentage of the respondents are male.
Majority 45 percentage of the respondents were in the age group of 21–30.
Majority 37 percentage of the respondent are government employees.
Majority 50 percentage of the respondents were belongs in the income of below Rs. 1000 per month.
Majority 65 percentage of the respondents owing own water purifies.
Majority 30 percentage of the respondents were purchase brand Aqua guard water purifier.
Majority 55 percentage of the respondents consume below 10 liters quantity of water purifier.
43 percentage of the respondents spend below Rs. 5000 for water purifier.
47 percentage of the respondents are opinion that the price of water purifier is high
Majority 62 percentage of the respondents were using water purifier below 2 Years.
Majority 37 percentage of the respondents prefer the product by quality.
Majority 42 percentage of the respondents are fully satisfied the expectation of the product.
Majority of the respondents feel that the defect was found by means of quality(62 percentage).
42 percentage of the respondents are influence the product by quality
Majority 36 percentage of the respondents know the product from parents.
SUGGESTION
Most of the respondents were belong to female, so the management should take some
necessary steps to attract male. The study revealed that considerable percentage of respondents were
in the age group of 20–30 Years, hence it is recommended to the management to pay attention to the
age group of above 30 years. It is found from the study that significance percentage of consumer to
know the product through sales representatives. Hence the management has to modify the
advertisement strategy. The study revealed that considerable percentage of respondents feel that the
defect was found by means of quality so the management have to pay attention to take action to avoid
such complaints. Manufacture should take attention to give all information about the product on the
package of the product. The study found that some considerable percentages of respondents are not
fully satisfied. So the management should take some necessary steps to keep their consumers happy by
means of availability, moderate prices, etc.
CONCLUSION
The modern market is highly competitive and transitional. A company must first decide what it can
sell and what approaches must be made to attract the target customers. The customers do no accept any
satisfaction. So it can be said that the modern market is consumer oriented and any products success or
only the consumers determine failure. Today to achieve success in the market, it has become highly
inevitable to produce goods in such a manner as preferred by the customers, as he is the king around
when the entire marketing activity revolves. The customer satisfaction is more important for this
business too apart from customer creation development the present study is taken to have an idea about