1
International Journal in Management and Social Sciencehttp://ijmr.net.in, Email: irjmss@gmail.com ROLE OF DEMOGRAPHICS IN AFFECTIVE COMMITMENT OF PUBLIC AND PRIVATE
BANKS EMPLOYEES OF PUNJAB
Ms. Monika Sharma
Research Scholar Chandigarh University Gharuan
Dr. Rajiv Khosla
Professor Chandigarh University Gharuan
ABSTRACT
This study explored the relationship between demographic factors (gender, marital status, and age, types
of bank, income, designation, education and experience.) and Affective commitment. The data was
collected from the public and private banks in Punjab. The results of the data showed that gender and
marital status of the employees does not have any significant differences in the level of affective
commitment (AC). While in other six demographics namely age, type of bank, education, experience
and designation of employees there exists a significant differences in the level of Affective Commitment
(AC) across different groups of each of these six demographics. The results of this study also showed
that the Top management is more affective committed as compare to lower management employees.
KEY WORDS: Affective Commitment,
INTRODUCTION
Banking sector makes a significant contribution in the economic prosperity of a country. The 1991
Government policy of economic liberalization brought structural reforms in Indian economic system,
wherein banks have undergone many changes at operational level. Customers are provided with diverse
services by banks and technological progression has given a whole new shape to the banking industry.
Moreover, with coming up of the private sector banks along with foreign banks, the banking operations
in India have under gone a sea change. This transformation has promoted the cause of intense
competition amongst bankers and to be able to beat the cut throat competition a talented pool of people
is required. But Indian banking industry like any other industry is facing an issue of talent scarcity.
Competition for talented people is becoming severe as talented employees of Public sector banks are
being poached by private and foreign banks. This calls for an insight into the behaviour of employees,
2
International Journal in Management and Social Sciencehttp://ijmr.net.in, Email: irjmss@gmail.com Commitment is an important strategic aspect for the organizations. Organizations are successful because
they realize that the retention of employee with higher organizational commitment is a source of
competitive advantage in sustaining the growth and leadership in market place (Penrose, 1959).
Organizational Commitment is the potency of the sense of accountability that an employee has towards
the assignment of the organization. Commitment is a psychological bonding between the organization
and the employees working in it (Mc Donald and Makin, 2000). Individuals who have strong faith in the
organizational aims and objectives, work hard for the well-being of the organization and are more
willing to be the member and the part of the organization are said to be highly committed employees
(Mathews and Shepherd 2002).
Organizational commitment is an important variable that is largely affecting the potential stay of
talented pool of employees in an organization. Moreover it is also affecting the employee‟s job
performance which in turn largely affects the performance of an organization (Chaturvedi, 2014).
Organizational Commitment is very closely connected to the intention of an employee to remain with
the organization and retention, and can be described as an “employees identification with and involvement of an employee with a particular organization” (Crewson,1997), and the strength of a person‟s attachment with the organization (Grusky,1966).Commitment of the workforce is the critical
characteristics for reaching towards the heights of success along with organizational efficiency and
effectiveness. Committed workforce is seen as a valuable asset that contributes to develop a competitive
edge for the organization(Meyer and Allen,1991).Employees with more commitment towards the
organization than those who are least committed exhibit : Organizational citizenship; employees goes an
extra mile (Mowday et al.,1979); Higher job performance in terms of productivity, attendance and
supervisor‟s ratings (Larson and Fukami,1984) and more job satisfaction, less absenteeism, less stress
and less intentions to leave the organization (Mathieu and Zajac,1990)
DEFINITIONS OF ORGANIZATIONAL COMMITMENT
The concept of organizational commitment has undergone significant change over the years are as
follows.
According to Katz (1964),focused on employees performance that is indispensable for organizational
efficiency and effectiveness include employees:- Inward bound and lasting with the employing
organization, carrying out specific role requirements, and engaging in innovative and spontaneous
activity that goes beyond role prescription. Hall, Schneider and Nygren (1970) focused on the power of
3
International Journal in Management and Social Sciencehttp://ijmr.net.in, Email: irjmss@gmail.com of exchange, in other words it is a “result of individual organizational transactions and alterations are
side bets or investment over time”. Employees are committed to the organization because of some
side-bet or we can say that an investment accrued over a period of time and it would be lost if a person leaves
a job. The broader accepted and in used definition of employees organizational commitment in current
researches is that of Porter, Steers, Mowday and Boulian (1974), they stated that commitment is the
relative strength of an individual‟s identification and involvement in the concerned organization. In
other words organizational commitment is considered to be the linking pin between the individual
employees and the organization. Buchanan (1974) is of the viewpoint that the concept of employees
organizational commitment consist of identifying and adopting the goals and the values of the
organization as its own; psychological absorption by the employees in their work roles last but not the
least the resulting loyalty of an employee towards an organization. Winer (1982) defines Organizational
Commitment as “the aggregate of the internalized normative demands of an employee to execute in a
manner which fulfills the interest and objectives of the organization. Reichers (1985) is of the viewpoint
that, “Organizational Commitment is a behaviour which is visible when the employees of an
organization goes an extra mile for the betterment of the organization and are bound by their actions and
their involvement in the organization”. O‟Reilly and Chatman (1986) defines, “Organizational
Commitment is the psychological bond of an individual towards the goals and values of an organization
also including the sense of loyalty and more and more involvement in the day to day working of an
organization for the betterment of the organization According to Balay (2000) describe commitment is
the sense of attachment and belongingness that one feels for their organization. This feeling connects the
employees and the organization in such a manner that they are around common values and goals. The
sense of commitment that one have can belong to a organization, to a specific job, towards certain
departments or to the working groups. Commitment in the workforce is created only when a sense of
belongingness is created in their minds.
Marthis and Jackson (2000) defined employee organizational commitment as the degree of employee‟s connectivity with the organization and showed serious faith in the goals of the organization. It‟s all
about how you feel about your organizations and the goals of the organization. In other simple words it
is the close connectivity that one feels with the organizational goals and once you are connected you are
committed.
Hacket et.al (2001) viewed organizational commitment as a faith of an employee in the goals, value,
4
International Journal in Management and Social Sciencehttp://ijmr.net.in, Email: irjmss@gmail.com In other words it is the extent of employee‟s attachment and trustworthiness towards the existing
organization.
According to Meyer and Herscovitch (2001) Organizational commitment can be visualized as a binding
force that is experienced as a mind-set or as a psychological state that direct an individual towards a
particular course of action.
Zangaro (2001) is of the viewpoint that employees are considered to be committed towards an
organization if the employees freely carry on their alliance with the organization and devote substantial
efforts in achieving organizational goals.
Meyer & Becker (2004) define a committed employee as an individual who “stays with an organization,
attends work regularly, puts in a full day and more, protects corporate assets, and believes in the
organizational goals”. This employee positively contributes to the organization because of its
commitment towards the organization.
According to Fred Luthans (2006), “Organizational commitment is an outlook which reflects the loyalty
of an employee toward the organization and is an ever-going process through which employees
communicate their interest for lasting success and well-being of their organization”. In the words of
Singh et al. (2008) Organizational Commitment refers to the service given by an employee all over his
work life in the same organization. Nazari et al. (2012) defined organizational commitment as a deep
inner psychological emotion which make employees more and more thankful to remain as an important
part with the same work organization.
Above definition by the researchers on the organization commitment of an employee helps in creating
the principles of a employee organizational commitment and they are as follows:
Meyer and Allen (1984) at first viewed organizational commitment as two dimensional namely
1) Affective Commitment- “Positive feeling of identification with attachment to and involvement in the
work organization”, and secondly
2) Continuance Commitment-“The extent to which an employee feels committed towards their
organization by the virtue of the cost that they feel is associated with leaving”.
Meyer and Allen (1991) after some add-on research work supplement a third dimension namely
Normative Commitment-“the employee‟s feeling of obligation to remain with the organization”.
After coming up of third dimension, organizational commitment is portrayed as tri-dimensional concept.
Many studies related to Affective commitment (AC) have defined AC in numerous ways. Meyer and
Allen (1991) referred affective commitment as the employee‟s emotional connection with an
5
International Journal in Management and Social Sciencehttp://ijmr.net.in, Email: irjmss@gmail.com stay in the organization because of their emotional attachment. Employee high on score of affective
commitment would remain connected with the organization because they want to do so. Jaros et al
(1993) opined that affective commitment is a psychological attachment towards an organization. This is
because affective commitment is linked with enviable organizational outcomes like turnover,
absenteeism, job performance and organizational citizenship behavior. Kumari and Afroz (2013)
undertook a study with an objective of analyzing the role of affective commitment in employee‟s life
satisfaction. The study was conducted on the sample of 200 managerial employees of NTPC India from
Sonbhadra district of Uttar Pradesh. The findings of the study showed that the life satisfaction has been
highly significant related with organizational affective commitment. Kim (2014) undertook a study to
explore the effect of work-life balance on affective commitment and in-role performance and to explore
the mediating role of commitment to link work-life balance and in-role performance in Korean business
context by using the sample of 293 Korean workers. Structural equation modeling and regression
analysis was used to test the hypothesis. Result of the study showed no direct effect of work-life balance
on in-role performance. It was found that with experience of work-life balance, employees affective
commitment increases whereas no statistically significant impact on in-role. Based on the result of
regression analysis, the study also indicated that affective commitment of employees showed significant
mediating construct between work-life balance and in-role performance.
Objectives of the study and research methodology
The present study is undertaken with the following objectives
a) To examine the affective commitment level of employees of public and private sector banks in
Punjab and
b) To study if there exist any associations of employee‟s affective commitment level of bank
employees across various socio-demographic variables i.e. gender, marital status, age, types of bank,
income, designation, education and experience.
Descriptive, cross sectional research design has been adopted for the conduct of the present study. For
this questionnaire was divided into two sections: First section includes demographics and second section
includes affective commitment. The affective commitment eight item scales of Allen and Meyer (1991)
have been used. Stratified random sampling was used to collect the data from 800 employees from
public sector bank (include SBI, Punjab National Bank, Bank of Baroda and Canra Bank) and private
sector banks (include HDFC, ICICI, Axis and Kotak Mahindra bank) in Punjab. Eight major cities of
Punjab, namely Amritsar, Jalandhar, Ludhiana, Patiala, Hoshiarpur, Moga, Abohar and Faridkot were
6
International Journal in Management and Social Sciencehttp://ijmr.net.in, Email: irjmss@gmail.com Banks. Equal numbers of employees from Urban and semi urban/rural branches were targeted. At the
time of analyses and data coding it was found that responses of only 612 employees were found out to
be adequate and complete in all respects. The reliability of the scale was duly checked and from the
reliability analysis of AC. The Cronbach's Alpha Based on Standardized Items value is .901 which is
highly significant. Moreover the inter correlation coefficients between eight items of AC are highly
significant. The others test pertaining to reliability of AC scale are significant. Hence it is safe to use this
scale to measure AC dimension of employee‟s commitment level.
DATA ANALYSIS
The following eight dimensions have been defined to represent Affective Commitment. The major
contributors to these eight dimensions are Meyer and Allen.
Table 1 Dimensions of Affective Commitment (AC)
All these eight dimensions in table 1 showed emotional connection of an employee with the job and the
bank. In other words we can say that one can treat our bank as family and the problem of the bank as our
own. The perception of 612 bank employees pertaining to these eight dimensions has been studied in
detail.
First of all Factor Analysis techniques has been used to understand relative importance of various
dimensions of Affective Commitment (AC).
Table 2 Descriptive Statistics of AC
Dimensions Mean Standard Deviation Analysis of N
AC1 2.6993 1.56197 612
AC2 2.5131 1.40777 612
AC3 2.5343 1.21521 612
AC4 2.7794 1.18723 612
AC5 2.9248 1.35544 612
AC6 2.6634 1.16176 612
AC7 2.6732 1.03668 612
AC8 3.0163 1.35863 612
AC1 I would be very happy to spend rest of my career with this bank.
AC2 I enjoy discussing my bank with people outside it.
AC3 I really feel as if this bank‟s problems are my own.
AC4 I do not think I could become as attached to another as I am to this bank.
AC5 I feel like part of the family at my bank.
AC6 I feel emotionally attached to the bank.
AC7 This bank has a great deal of personal meaning for me.
7
International Journal in Management and Social Sciencehttp://ijmr.net.in, Email: irjmss@gmail.com It is seen that all eight dimensions of AC have mean greater than 2.5 and hence all items have great
importance. But AC8 (3.016) has shown highest mean followed by AC5 (2.924).
Table 3 Correlation Matrix
AC1 AC2 AC3 AC4 AC5 AC6 AC7 AC8
Correlation
AC1 1.000 .724 .720 .591 .643 .517 .486 .560
AC2 .724 1.000 .723 .624 .587 .511 .481 .570
AC3 .720 .723 1.000 .607 .531 .471 .453 .513
AC4 .591 .624 .607 1.000 .521 .442 .425 .482
AC5 .643 .587 .531 .521 1.000 .540 .535 .738
AC6 .517 .511 .471 .442 .540 1.000 .486 .536
AC7 .486 .481 .453 .425 .535 .486 1.000 .533
AC8 .560 .570 .513 .482 .738 .536 .533 1.000
Sig.
(1-tailed)
AC1 .000 .000 .000 .000 .000 .000 .000
AC2 .000 .000 .000 .000 .000 .000 .000
AC3 .000 .000 .000 .000 .000 .000 .000
AC4 .000 .000 .000 .000 .000 .000 .000
AC5 .000 .000 .000 .000 .000 .000 .000
AC6 .000 .000 .000 .000 .000 .000 .000
AC7 .000 .000 .000 .000 .000 .000 .000
AC8 .000 .000 .000 .000 .000 .000 .000
Determinant = .009
From the above table it is clearly indicated that all the eight dimensions of Affective Commitment (AC)
are highly and significantly correlated with each other. All the respondents that have given their
perception about affective commitment and all its eight dimensions in a very uniform manner. This is
8
International Journal in Management and Social Sciencehttp://ijmr.net.in, Email: irjmss@gmail.com Table 4 KMO and Bartlett’s Test
Kaiser-Meyer-Olkin Measure of Sampling Adequacy .913
Approx.Chi-Square 2871.541
Bartlett‟s Test of Sphericity df 28
Sig. .000
The technique of Factor analysis have been applied to understand the relative importance of eight
dimensions of affective commitment (AC) and to classify this eight dimensions into further sub group if
any. The table pertaining to KMO and Bartlett‟s test clearly shows that the technique of factor analysis
have high level of goodness of fit as shown by significance level of 100 percent.
Table 5 Communalities
Initial Extraction
AC1 1.000 .715
AC2 1.000 .708
AC3 1.000 .653
AC4 1.000 .561
AC5 1.000 .667
AC6 1.000 .505
AC7 1.000 .478
AC8 1.000 .621
Extraction Method: Principal Component Analysis.
The communalities table given above clearly indicates that among all eight indicators, only five namely,
AC1, AC2, AC3, AC5 and AC8 have turned out to be relatively more important dimensions of Affective
Commitment. AC6 and AC7 have turned out to relatively less importance as compared to others.
Table 6 Total Variance Explained
Componen t
Initial Eigen values Extraction Sums of Squared loadings
Total % of
variance
Cumulative % Total % of variance Cumulative %
1 4.909 61.358 61.358 4.909 61.358 61.358
2 .797 9.969 71.327
3 .534 6.681 78.008
4 .513 6.411 84.419
5 .447 5.586 90.005
6 .306 3.823 93.828
7 .271 3.387 97.215
8 .223 2.785 100.000
9
International Journal in Management and Social Sciencehttp://ijmr.net.in, Email: irjmss@gmail.com From the table pertaining to total variance explained, it clearly shows that only one component factor
has been derived and it could explain 61.35 percentage of variance across eight components of affective
commitment. This might be due to the fact that all the eight items are highly and significantly correlated
amongst themselves and no further sub grouping is feasible. Hence all the items do represent the
personal attachment aspect of commitment.
Table 4.7 Component - Factor Loadings
COMPONENT
1
AC1 .845
AC2 .841
AC5 .817
AC3 .808
AC8 .788
AC4 .749
AC6 .711
AC7 .691
Extraction Method: Principal component Analysis.
1 Components extracted
From the component matrix it clearly follows that all the dimensions of AC have factor loadings of more
than 0.70 values (AC7 is 0.69) which clearly shows that all the dimensions can be identified as personal
attachment. But it is also seen from the matrix that two dimensions namely AC6 and AC7 have shown
relatively less value as compared to others six items.
From the factor Analysis results, it clearly emerges that all the eight indicators have shown high factor
loading and only one factor has been derived which can be termed as “personal attachment”. So the
exploratory factor analysis does confirm all the items listed in the AC. So the personal factors are crucial
in understanding of employee‟s commitment. The organizations must look into personal aspects of employees in order to increase the level of employee‟s commitment. In other words the policies of banks
should be more directed towards enhancing the personal needs of the employees, as it will improve the
10
International Journal in Management and Social Sciencehttp://ijmr.net.in, Email: irjmss@gmail.com In this section, an attempt has been made to study if there exist any relationship between AC and other
demographics of employee like gender, age ,marital status, occupation etc. for this cross tab between
various demographics and AC have been made and chi-Square and cramer has been calculated.
The following table shows the relationship between affective commitment (AC) and gender:
Table 8 Affective Commitment relationship with Gender (Gender * AC)
Affective Commitment (AC)
Total
Less than 2.5 Greater than 2.5
Gender
Male 153 169 322
Female 163 127 290
Total 316 296 612
Pearson Chi Square 4.615 Asymp.Sig. (2-sided) .032 Exact Sig. (2-sided) value 0.35
The analysis of table 8 does highlights no association exists between gender and Ac of employees
Table 9 Affective Commitment relationship with Marital status (Marital status * AC)
Affective Commitment (AC)
Total
Less than 2.5 Greater than 2.5
Marital Status
Unmarried 124 106 230
Married 192 190 382
Total 316 296 612
Pearson Chi Square .766 Asymp.Sig. (2-sided) .381 Exact Sig. (2-sided) value 0.404
From table 9 it clearly follows that there are 230 unmarried employees out of 612 i.e. 37.5% of the
employees are unmarried. Out of unmarried employees 124 have shown less than 2.5 of affective
commitment (AC) while 106 out of 230 that are 46% of unmarried have higher AC level. On the other
hand if we see married employees it clearly follows that 192 i.e.50.6% showed less than 2.5 of AC while
190 i.e. 49.7% have higher AC level. In other words we can say that married employees are more
emotionally attached then unmarried employees
From Chi-square test it is revealed that there doesn‟t exist a significant difference between affective
11
International Journal in Management and Social Sciencehttp://ijmr.net.in, Email: irjmss@gmail.com Table 10 Affective Commitment relationship with Age (Age * AC)
Affective Commitment (AC)
Total
Less than 2.5 Greater than 2.5
Age
Less than 30 157 77 234
30-50 118 125 243
Above 50 41 94 135
Total 316 296 612
Pearson Chi Square 47.757 Asymp.Sig. (2-sided) .000 Exact Sig. (2-sided) value 0.0004From
The table 10 it clearly shows that 157 (67%) employees out of 234 are in the age category of less than
30 years have shown less than 2.5 score on AC as compared to 77 (32.9) employees out of 234 in same
category of less than 30 years have shown more than 2.5 on AC. In the category of 30 to 50 age 125
employees out 243 i.e. 51.7 percent have shown greater than 2.5 score on AC and in the age category of
above 50 years 94 employees out of 135 i.e. 69.6 percent have shown more AC.
This analysis shows that there exists significant association between the level of AC and the age of
respondents i.e. with high age the level of AC also goes up.
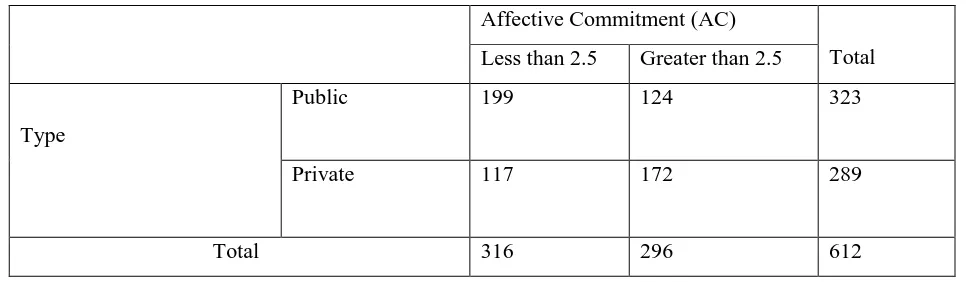
Table 11 Affective Commitment relationship with Type (Type * AC)
Affective Commitment (AC)
Total
Less than 2.5 Greater than 2.5
Type
Public 199 124 323
Private 117 172 289
Total 316 296 612
Pearson Chi Square 27.2587 Asymp.Sig. (2-sided) .000 Exact Sig. (2-sided) value 0.000
From this table it is clearly indicated that out of 612 bank employees 323 i.e. 52.7% are from public
sector banks and 289 i.e.47.2% are from private sector bank. Out of Public Sector bank employees 199
i.e. 61.6% have shown less than 2.5 of affective commitment (AC) and 124 employees i.e. 38.3% have
shown more than 2.5 of affective commitment whereas from private sector bank 117 employee i.e.
12
International Journal in Management and Social Sciencehttp://ijmr.net.in, Email: irjmss@gmail.com shown more than 2.5 of affective commitment. In other words it is seen that private bank employees are
more committed on affective commitment scale, as compared to public sector employees.
From this table it is indicated that there exist a significant difference between affective commitment of
public and private sector bank (Type) employees.
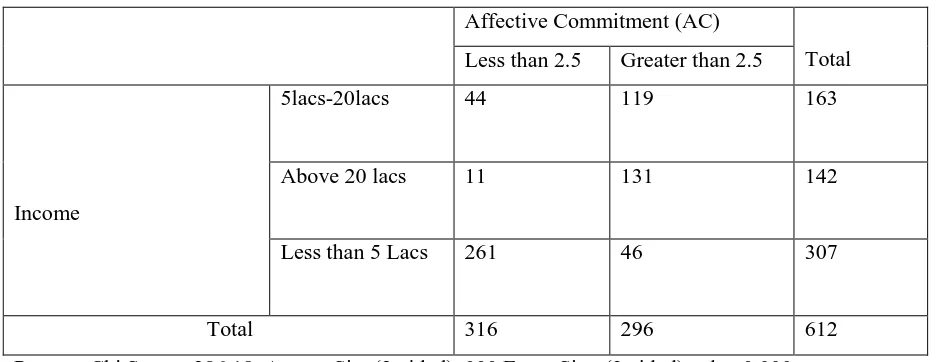
Table 12 Affective Commitment relationship with Income (Income * AC)
Affective Commitment (AC)
Total
Less than 2.5 Greater than 2.5
Income
5lacs-20lacs 44 119 163
Above 20 lacs 11 131 142
Less than 5 Lacs 261 46 307
Total 316 296 612
Pearson Chi Square 286.18 Asymp.Sig. (2-sided) .000 Exact Sig. (2-sided) value 0.000
Table 12 indicated that 131 employees (92.2%) out of 142 in the income group of above 20 lacs have shown
more Affective commitment. Similarly 119 employees (73%) out of 163 in the income group of 5 lacs to 20
lacs have more AC, whereas 261 employees out of 307 i.e.85% in the income group of less than 5 lacs have
low level of AC.
From the Chi-square test it is clearly indicated that there exist a significant relationship between income
and the affective commitment. This means that as the income goes up and up affective commitment goes
up.
Table 12 Affective Commitment relationship with Designation (Designation * AC)
Affective Commitment (AC)
Total
Less than 2.5 Greater than 2.5
Designation
Low 138 54 192
Middle 169 159 328
Top 9 83 92
Total 316 296 612
13
International Journal in Management and Social Sciencehttp://ijmr.net.in, Email: irjmss@gmail.com From the table it emerges that 138 out of 192 employees i.e. 71.8% which are in low cadre have less
level of AC. While 169 out of 238 i.e. 71 % employees are in middle level group which have less level
of AC whereas 83 employees (90.2%) out of 92 from top level group have high level of AC. This do
shows that the level of AC is low amongst low management employees and relatively very high AC
amongst top management employees.
From the table 12 it clearly follows that there exist a significant difference in the level of designation of
employees and the level of AC.
The Table 13 Affective Commitment relationship with Education (Education * AC)
Affective Commitment (AC)
Total
Less than 2.5 Greater than 2.5
Education
Graduation 173 33 206
Post-Graduation 104 139 243
Professional 39 124 163
Total 316 296 612
Pearson Chi Square 144.012 Asymp.Sig. (2-sided) .000 Exact Sig. (2-sided) value 0.000
From the above table it is seen that 124 employees out 163 i.e.76.07 with professional qualification
shows more affective commitment. Whereas 173 employees out of 206 i.e. 83.9% with graduation have
less affective commitment. 139 employees (57.2%) out of 243 with post-graduation degree have more
AC.
From Chi-square test it is clear that there exist a significant relationship between education and affective
commitment
Table 14 Affective Commitment relationship with Experience (Experience * AC)
Pearson Chi Square 201.904 Asymp.Sig. (2-sided) .000 Exact Sig. (2-sided) value 0.00
Conclusion and Suggestion
Affective Commitment (AC)
Total
Less than 2.5 Greater than 2.5
Experience
Less than 5 years 196 35 231
5yrs-20yrs 101 126 227
Above 20 yrs 19 135 154
14
International Journal in Management and Social Sciencehttp://ijmr.net.in, Email: irjmss@gmail.com From the analysis of the AC with the various demographics given above it is clearly indicated that in
terms of gender and marital status of the employees does not have any significant differences in the level
of affective commitment (AC). While in other six demographics namely age, type of bank, education,
experience and designation of employees there exists a significant differences in the level of Affective
Commitment (AC) across different groups of each of these six demographics. Therefore an effort has to
be made by banks management to reduce variations across demographics affective commitment level of
the employees.
REFRENCES
1) Allen, N., and Meyer, J.,(1990),The Measurement and Antecedents of Affective, Continuance and
Normative Commitment to the Organization. Journal of Occupational Psychology,63:pp 1-18.
2) Meyer, J.P., & Allen, N.J. (1984). Testing the side-bet theory of organizational commitment: Some
methodological considerations. Journal of Applied Psychology, 69,372-378.
3) Meyer, J.P. and Allen, N.J.(1991). „A Three Component Conceptualization of Organisational
Commitment‟. Human Resource Management review, 11, 299-326.
4) Angle, H., and Perry, J.(1983).Organizational Commitment: Individual and Organizational
Influence. Work and Occupation, 10(2), 123-146.
5) Becker, H.S. (1960). Notes on the concept of commitment. American Journal of Sociology, 66,
32-42.
6) DeCottis, T.& Summers, T.(1987)A path analysis of a model of the antecedents and consequences
of organizational commitment. Human Relations, 40, 445-470.
7) Grusky, O. (1966). Career mobility and organizational commitment. Administrative Sciences
Quarterly, 10, 488-503.
8) Hrebiniak, L.G., & Alutto, J.A. (1972). Personal and role related factors in the development of
organizational commitment. Administrative Science Quarterly, 17, 555-573.
9) Iqbal, Adnan.(2010). „An empirical assessment of Demographic factors, Organizational ranks and
Organizational Commitment‟, International Journal of Business Management.Vol.5, No.3.
10) Jermier, J.&Berkes, L.(1979).Leader behaviour in a police command bureaucracy: A closer look at
the quasi-military model. Administrative Science Quarterly, 24, 1-23.
11) Khan et al. (2010). The Impacts of Organizational Commitment on Employee Job Performance,
15
International Journal in Management and Social Sciencehttp://ijmr.net.in, Email: irjmss@gmail.com 12) Kim, Hougyun.(2014).Transformational Leadership, Organizational Clan Culture, Organizational
Affective Commitment, and Organizational Citizenship Behavior: A Case of South Korea's Public
Sector.Public Organization Review,14(3)
13) Kumari, Neha. & Afroz, Nishat (2013) The Impact of Affective Commitment in Employees Life
Satisfaction. Global Journal of Management and Business Research Interdisciplinary, Vol 13 (7).
14) Nazari, K., Bte Lope Pihie, Z.A., Basri, R.B.,& Idris, K.B.(2012). An Empirical Investigation of
lecturers‟ Organizational Commitment in Technical and Vocational Colleges in Iran. International
Refereed Research Journal, Vol. 3, No.1, pp.1-10.
15) Singh, B., Gupta, P.K., & Venugopal, S.(2008).Organizational commitment: .Journal of the Indian
Academy of Applied Psychology,Vol.34,Issue1.pp 57-68.
16) Stephen J. Jaros, John M. Jermier, Jerry W. Koehler and Terry Sincich (1993) Effects of
Continuance, Affective, and Moral Commitment on the Withdrawal Process: An Evaluation of Eight
Structural Equation Models, The Academy of Management Journal .Vol. 36, No. 5