Nexus Between Non-Performing Assets And
Macroeconomic Variables – A Study Of Indian
Banking Sector
Dr.K.Sudarsan, Mr. Kathari Santosh
Abstract: This research paper is to establish the relationship among Non-Performing Assets with Macroeconomic Variables and also to study the macroeconomic variables (GDP, Unemployment Rate, Interest Rates and Inflation Rate) impact on NPAs of Indian banking sector d uring 1996-97 to 2015-16. Employing Correlation and Multiple Regression Analysis to test show that research model is of good and statistically significant. The study uses the data of Indian Banking Sector form official web sources of Reserve Bank of India. The present study was depends on the secondary data and is processed through SPSS 20.0 to get the results. Only Unemployment rate is statistically insignificant relationship with Net NPAs of Foreign Banks. Keywords: Non-Performing Assets – Economic Variables – Multiple Regression - Banking Sector – India
————————————————————
1.
INTRODUCTION
The link between the Non-Performing Loans (NPLs or NPAs henceforth) and loss of banks, is regarded a fact in literature of banking. Increase in NPAs rate is referred often as the failure of credit policy too. By viewing other side of the picture, it is also evident that financial crisis is also the effect of high NPAs rate in the banking sector. Financial crisis of late 2000s, which started from the US and it is spread into whole world having trading relationship with the US and is also labeled as cause of default in mortgages / loans. Increases in NPAs rate are the main reason of reduction in the earnings of banks. The reason behind the bad debts is low repaying capacity of borrowers, which in turn is the result of uneconomic use of loans, low per
capita, and high interest rate. Extra flexible credit rationing policy could also be the reason of high NPAs rate. Hence, it is clear why NPAs rate is the most crucial one for banks. The aim of this study is to analyze the sensitivity of NPAs to macroeconomic indicators in India. In particular, it employs regression analysis and a time series dataset covering 20 years (1996-97 to 2015-16) to examine the relationship between NPAs rate and several key macroeconomic variables along with the amount of total assets.
Definitions of NPAs
As per the Reserve Bank of India, the definition of NPAs is ―an asset, including a leased asset, becomes NPAs when it ceases to generate income for the bank‖.
A Non Performing Asset (NPAs) is a loan or an advance where;
Sl. No. Asset Duration
1. Interest and / or installment of principal remains overdue in
respect of term loan More than 90 days
2. Account remains out of order More than 90 days
3. Bill remains overdue More than 90 days
4. The installment of principal or interest thereon remains overdue
A. two crop seasons for short duration crops B. One crop season for long duration crops 5. The amount of liquidity facility remains outstanding in respect
of securitization transaction More than 90 days
6. In respect of derivative transactions overdue from the specified due date for payment Unpaid for a period of 90 days 7. If the interest due and charged during any quarter is not
serviced fully Within 90 days from the end of the quarter
Classification of NPAs
As per the RBI guidelines banks should classify NPAs in the following manner based on the period for which the asset has remained non-performing and the realisablility of the dues with effect from March 31, 2005.
Sl. No. Category of NPAs Duration
1. Substandard assets Less than or equal to 12 months 2. Doubtful assets Period of 12 months
3. Loss assets Identified by the bank or internal or external auditors or the RBI inspection but the amount has not been written off wholly.
Review of Literature
Jimerrez and Saurina (2006) found that NPLs are determined by GDP growth rate, real interest rate and lenient credit terms in the Spanish banking sector. Svetozar Tanaskovic and Maja Jandric (2014) suggested that there is a negative relationship between increases in GDP and a rise in the NPL ratio. The foreign currency loans ratio and the level of exchange rate are positively related with the
______________________
increase of NPL ratio and they are statistically significant in all models. Dimitrios P. Louzis, Angelos T. Vouldis, Vasilios L. Metaxas (2012) found that the macroeconomic variables, specifically the real GDP growth rate, the unemployment rate, the lending rates and public debt have a strong effect on the level of NPLs. Chaiporn Vithessonthi (2016) found that for commercial banks in Japan during the sample period, credit growth positively correlates with NPLs prior to the onset of the global financial crisis of 2007 and negatively correlates with NPLs after the onset of the global financial crisis of 2007. He underscores empirically the fact that an increase in bank credit growth does not always lead to higher levels of NPLs. Amit Ghosh (2015) found that the real GDP and personal income growth, unemployment rates, housing price indices and homeownership rates significantly affect NPLs, underscoring its counter cyclical nature. Thus improving the economic health of each state is imperative to reduce NPLs. Finally, a reduction in the US federal government’s public debt will help lower NPLs. Lobna Abid, Med Nejib Ouertani, and Sonia Zouari-Ghorbel (2014) found that the macroeconomic variables, precisely the real GDP growth rate, inflation rate and the real lending rate have an effect on the level of NPLs. William R. Keeton and Charles S. Morris (1987) concluded that too much loaning in a sector is the major cause of high bad debts, upon the bad performance in that sector. Study also highlighted that risk taking behavior of banks also lead to the greater loan losses ratios based on NPAs net of charge offs rate as the proxy for loan losses. Joseph F. Sinkey, JR and Mary Brady Greenawalt (1991) concluded that excessive financing and high interest rate is regarded the main reason for high rate of NPAs in US the banking sector on the basis of loan loss ratio by the proxy constituting charges offs plus NPAs divided by total loans. Vicente Salas and Jesus Saurina (2002) analysed for NPAs by combining the macroeconomic and firm specific factors by employing the Spanish commercial banks’ data. They concluded that there is the problem of management inefficiency that leads to greater NPAs rate, but bank size is not related to the NPAs rate, rather these are firm specific factors that generate more loan losses and raise the NPAs rate. Munib Badar et al. (2013) found that NPAs has pair wise co integration with money supply and interest rate, NPAs can be forecast with exchange rate and inflation and there is a weak relationship between NPAs with inflation and exchange rate which leads to long relationship. Caprio and Klingebie (1996) described that poor management, supervision, regulations, corporate governance and unnecessary government intervention are the major causes of banking sector insolvencies during 1980s to 1990s based on multiple episodes of banking crises. Louzin, Vouldis and Metaxas (2010) stated that real GDP growth rate, lending and unemployment rates influence the level of NPAs in Greek banking sector. Dimitrios Angelos and Vasilios (2011) stated that both macroeconomic variables such as real GDP growth rate, unemployment rate and lending rate possess the ability to affect the level of NPAs and banks specific variables such as performance and quality of management with risk management practices or system are also responsible for variations in NPAs on the basis of panel data. Dash and Kabra (2010) found that the real income variation negatively associated with NPAs and further probe that high interest rates, real effective
exchange rate brought high level of NPAs. Sofolis and Eftychia (2011) found that inflation, unemployment rate, external debt to gross domestic product, money supply and investment with construction expenditure jointly with country’s (Greek) crises specific variables influence the credit risk of banking system on the basis of univariate regression. Asari et al (2011) concluded that there is a strong long-run relationship between interest rate and NPAs while inflation and interest rate have insignificant relationship in the long-run. But in case of short-run both interest rate and inflation couldn’t influence NPAs. Kevin Greenidge and Tiffany Grosvenor (2010) concluded that the macroeconomic factors (growth rate in GDP, inflation rate and weighted average loan rate) have an impact on the level of NPAs based on auto regressive distributive lag model. Munib Badar et al. (2013) found that NPAs has pair wise co integration with money supply and interest rate, NPAs can be forecast with exchange rate and inflation and there is a weak relationship between NPAs with inflation and exchange rate which leads to long relationship. Statement of the ProblemThe above literature is evident that there are few studies on determinants or macroeconomic variables (GDP growth rate, real interest rate, foreign exchange rate, unemployment, personal income growth, housing price indices, homeownership rates, inflation rate and money supply) for NPAs of banks in various countries. Some of the above mentioned macroeconomic variables are affecting the NPAs of banks. The major macroeconomic variables for Indian economy are GDP, unemployment rate, inflation rate and interest rate. So the present study is undertaken on relationship between macroeconomic variables and NPAs in Indian banking sector to identify which macroeconomic variables are affecting NPAs of Scheduled Commercial Banks (SCBs), Public Sector Banks (PSBs), Private Sector Banks (PriSBs) and Foreign Banks (FBs).
Objectives of the Present Study
This investigation of study is focused on the effect of non-performing loans of banks towards economic variable. The study period is from 1996-97 to 2015-16.
To determine the relationship between Non-Performing Assets and Macroeconomic Variables.
To study the macroeconomic variables (GDP, Unemployment Rate, Interest Rates and Inflation Rate) impact on NPAs of Indian banking sector during 1996-97 to 2015-16.
Significance of the Study
Research Methodology
The study is descriptive and investigative in nature. It evaluates the impact of macroeconomic variables on NPAs in Scheduled Commercial Banks, Public Sector Banks, Private Sector Banks and Foreign Banks in India during 1996-97 to 2015-16. By going through the path of objectives set for the study, the relevant secondary data has been collected through various sources like, Reserve Bank of India website, Trend and Progress in banking various issues. The data was analyzed by applying correlation and multiple regression as a statistical tools. Correlation is used to establish an empirical relationship
between macroeconomic variables and NPAs of banks. The results are drawn by using the SPSS 20.0.
Variables
The major economic variables are GDP, Unemployment rate, Interest rate and inflation rate in India (here after termed as macroeconomic variables). These variables are major causes for the default risk of corporate / borrowers of banks. So the present study variables are;
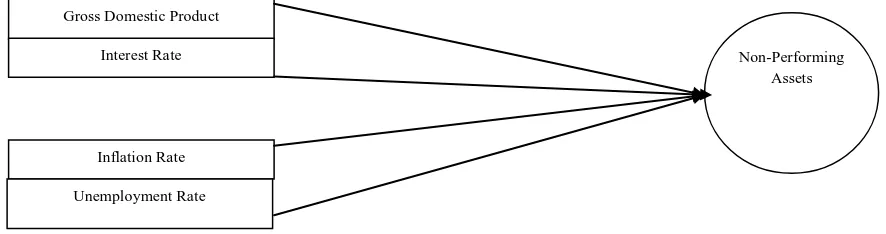
Dependent Variable: Non-Performing Assets (NPAs) Independent Variables: Gross Domestic Product (GDP), Interest Rate, Inflation Rate and Unemployment Rate
Figure No: 1 Theoretical Framework
Gross Domestic Product
Gross domestic product is a monetary measure of the market value of all the final goods and services produced in a period of time. It is used to determine the economic performance of a whole country or region and to do international comparisons. So it is a symbol of country’s economic growth. A low GDP rate indicates a stagnant economy and vice-versa. The GDP is used as a proxy for the present study. There is a negative relationship between GDP rate and NPAs.
Unemployment Rate
Unemployment refers to the situation of actively looking for employment but not being presently employed. Unemployment rate is a measure of prevalence of unemployment. It is calculated as percentage by dividing the number of unemployed individuals by all individuals presently in the labour force. An economy usually experiences a relatively high unemployment rate during recession and a relatively low during boom. There is a positive relationship between unemployment rate and NPAs.
Interest Rate
Interest rate is the rate of bank or other lender charges to borrow its money. It is the risk free rate of return. It usually remains in access of monetary regulators to manipulate in pursuance of monetary objectives. It is set by the RBI as
per the requirement to offset inflationary pressures. Generally, all Indian banks fix rate of interest on deposits and loans (advances) based on the RBI interest rate. There is a positive relationship between interest rate and NPAs. For the present study collected interest rates announced by the RBI in a year and calculated average interest rate per annum are taken into consideration.
Inflation Rate
Inflation rate is an overall increase in the consumer price index, which is a weighted average of prices for different goods. It is used for the present study as the proxy of inflation as a most comprehensive measure of inflation which defines as a change in the price of consumer goods and service purchased by households. Increase in Consumer Price Index (CPI) urge monetary regulators to apply contractionary measures by increasing the interest rates to control inflation which increase the cost of borrowing and finally cause for NPAs. There is a positive relationship between inflation and NPAs. For the present study year wise CPI disclosed by the RBI.
Relationship between macroeconomic variables and Net NPAs
The following figure presents the relationship between macroeconomic variables and Net NPAs of Scheduled Commercial Banks during 1996-97 to 2015-16.
Non-Performing Assets Gross Domestic Product
Inflation Rate Interest Rate
The above graph is evident for the relationship between macroeconomic variables and Net NPAs of Scheduled Commercial Banks. So the present study is carried out on the basis of this evident and review of literature.
Results and Discussion
The statistical tools use in the study is Multiple Linear Regression Model. This model is to learn more about the relationship between several independent or predictor variables and a dependent or criterion variable. This model of analysis is done to examine the simultaneous effects of several independent variables on a dependent variable that is interval scaled. In other used since is can explain the correlation between variable and also response variable by fitting liner equation to observe data.
Multiple Linear Regression Model Equation:
The following regression equation for bank group-wise Gross NPAs and Macroeconomic variables
Y = b0 + b1X1 + b2X2 + b3X3 + b4X4 + e
Where ; Y = Gross NPAs
X1 = Gross Domestic Product
X2 = Interest Rate
X3 = Inflation Rate
X4 = Unemployment Rate
The following regression equation for bank group-wise Net NPAs and Macroeconomic variables
Y= b0 + b1X1 + b2X2 + b3X3 + b4X4 + e
Where ; Y = Net NPAs
X1 = Gross Domestic Product
X2 = Interest Rate
X3 = Inflation Rate
X4 = Unemployment Rate
Table No.1 : Correlation among Bank Group-wise NPAs and Macroeconomic Variables
1 2 3 4 5 6 7 8 9 10 11 12
1 GDP (Billion) 1.00
2 Interest Rate -.45* 1.00
3 Inflation Rate .33 .05 1.00
4 Unemployment Rate -.52* .05 .16 1.00 5 SCB Gross NPAs .71** -.15 -.08 -.85** 1.00
6 SCB Net NPAs .68** -.12 -.09 -.86** 1.00** 1.00
7 PSB Gross NPAs .68** -.13 -.10 -.85** 1.00** 1.00** 1.00
8 PSB Net NPAs .68** -.11 -.10 -.85** 1.00** 1.00** 1.00** 1.00
9 PriSB Gross NPAs .85** -.31 .06 -.81** .96** .95** .95** .94** 1.00
10 PriSB Net NPAs .74** -.26 -.02 -.87** .96** .96** .96** .96** .97** 1.00
11 FB Gross NPAs .86** -.26 .13 -.72** .92** .91** .91** .91** .96** .91** 1.00
12 FB Net NPAs .78** -.35 .42 -.30 .57** .57** .55* .55* .69** .63** .82** 1.00 *. Correlation is significant at the 0.05 level (2-tailed).
**. Correlation is significant at the 0.01 level (2-tailed).
0.00 5.00 10.00 15.00 20.00 25.00 30.00 35.00 40.00
Figure No:2 The relationship between Macroeconomic Variables and Net NPAs of Scheduled Commercial during 1996-97 to 2015-16
GDP (100 Billion) Interest Rate Inflation Rate
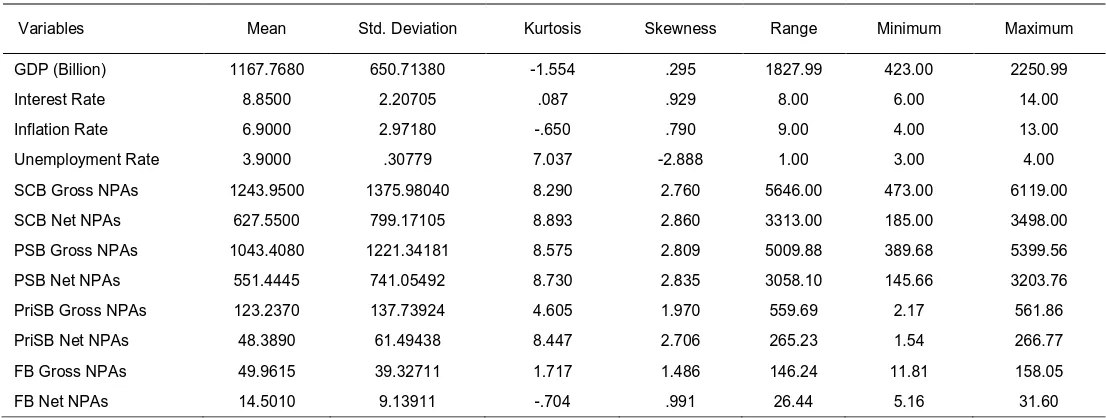
Table No.2 : Descriptive Statistics
Variables Mean Std. Deviation Kurtosis Skewness Range Minimum Maximum
GDP (Billion) 1167.7680 650.71380 -1.554 .295 1827.99 423.00 2250.99
Interest Rate 8.8500 2.20705 .087 .929 8.00 6.00 14.00
Inflation Rate 6.9000 2.97180 -.650 .790 9.00 4.00 13.00
Unemployment Rate 3.9000 .30779 7.037 -2.888 1.00 3.00 4.00
SCB Gross NPAs 1243.9500 1375.98040 8.290 2.760 5646.00 473.00 6119.00
SCB Net NPAs 627.5500 799.17105 8.893 2.860 3313.00 185.00 3498.00
PSB Gross NPAs 1043.4080 1221.34181 8.575 2.809 5009.88 389.68 5399.56
PSB Net NPAs 551.4445 741.05492 8.730 2.835 3058.10 145.66 3203.76
PriSB Gross NPAs 123.2370 137.73924 4.605 1.970 559.69 2.17 561.86
PriSB Net NPAs 48.3890 61.49438 8.447 2.706 265.23 1.54 266.77
FB Gross NPAs 49.9615 39.32711 1.717 1.486 146.24 11.81 158.05
FB Net NPAs 14.5010 9.13911 -.704 .991 26.44 5.16 31.60
Scheduled Commercial Banks
The following tables present the multiple regression results of macroeconomic variables and Gross NPAs of Scheduled Commercial Banks during 1996-97 to 2015-16.
Table No.3: Results of Multiple Regression Analysis
Model Summary
Model R R Square Adjusted R
Square F Change Sig. F Change Durbin-Watson
1 0.918 0.844 0.802 20.226 .000 2.329
Dependent Variable: Gross NPAs
Table No.4: Regression Coefficients
Variable Un-standardized Coefficients B
Standardized Coefficients
Beta
t -value Sig. H0 : Rejected/
Accepted
VIF
(Constant) 9450.694 3.211 0.006
GDP 1.124 0.532 3.113 0.007 Rejected 2.798
Interest Rate 78.422 0.126 0.991 0.338 Accepted 1.546
Inflation Rate -80.416 -0.174 -1.355 0.196 Accepted 1.576
Unemployment Rate -2476.657 -0.554 -3.897 0.001 Rejected 1.938
Dependent Variable: Gross NPAs
Table No.3 indicates the model summary of multiple regression analysis. The result of the model shows that the value of R is 0.918, which indicates a high correlation between dependent (Gross NPAs) and independent variables. The value of R square is 0.844. The p value of the model is 0.000 which is less than 0.05 indicating that the regression model is statistically significant and a fit model. Note: As a rule of thumb the value of Durbin-Watson test is less than one or greater than three not acceptable. But the model summary of Durbin-Watson statistics of Table No.3, 5, 7, 9, 11, 13, 15 and 17 is between one and
significance. This indicates that there is a statistically insignificant relationship between Inflation rate Gross NPAs and also Interest rate and Gross NPAs.
The following regression equation was obtained:
Y = 9450.694 + 1.124X1 + 78.422X2 –
80.416X3 – 2476.657X4 + e
Note: As a rule of thumb, if the VIF values are more than 10 are not acceptable and show a sign of multicollinearity. This regression model is free from multicollinearity as all VIF values are less than 10 for all explanatory variables shown in Table No.4, 6, 8, 10, 12, 14, 16 and 18. The following tables present the multiple regression results of macroeconomic variables and Net NPAs of Scheduled Commercial Banks during 1996-97 to 2015-16.
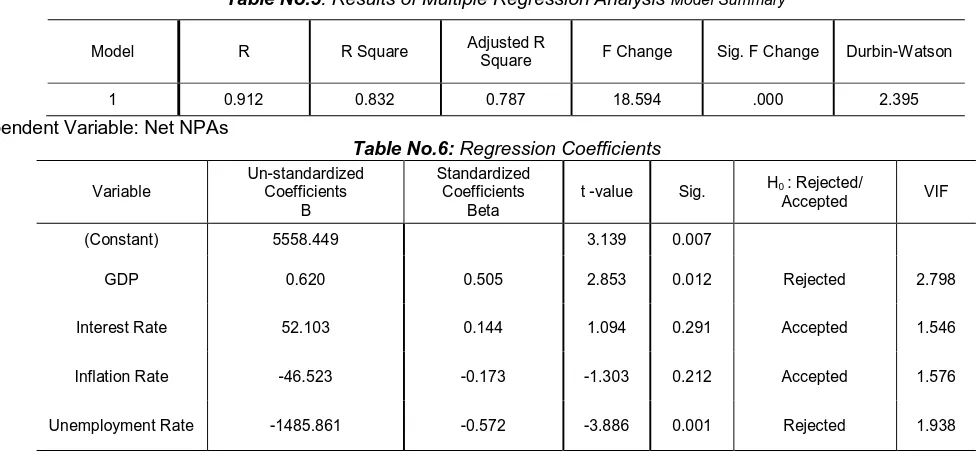
Table No.5: Results of Multiple Regression Analysis Model Summary
Model R R Square Adjusted R
Square F Change Sig. F Change Durbin-Watson
1 0.912 0.832 0.787 18.594 .000 2.395
Dependent Variable: Net NPAs
Table No.6: Regression Coefficients
Variable
Un-standardized Coefficients
B
Standardized Coefficients
Beta
t -value Sig. H0 Accepted: Rejected/ VIF
(Constant) 5558.449 3.139 0.007
GDP 0.620 0.505 2.853 0.012 Rejected 2.798
Interest Rate 52.103 0.144 1.094 0.291 Accepted 1.546
Inflation Rate -46.523 -0.173 -1.303 0.212 Accepted 1.576
Unemployment Rate -1485.861 -0.572 -3.886 0.001 Rejected 1.938
Dependent Variable: Net NPAs
Table No.5 indicates the model summary of multiple regression analysis. The result of the model shows that the value of R is 0.912, which indicates a high correlation between dependent (Net NPAs) and independent variables. The value of R square is 0.832. The p value of the model is 0.000 which is less than 0.05 indicating that the regression model is statistically significant and a fit model. Table No.6 illustrates the results of regression analysis for Net NPAs and Macroeconomic variables. Results of multiple regression reveals that the p value of GDP and Unemployment rate is 0.012 and 0.001 respectively; these are less than 0.05 at 5 % level of significance. This indicates that there is a statistically significant relationship between GDP and Net NPAs and also Unemployment rate
and Net NPAs. The p value of Interest rate and Inflation rate is 0.212 and 0.291 respectively; these are more than 0.05 at 5 % level of significance. This indicates that there is a statistically insignificant relationship between Inflation rate Net NPAs and also Interest rate and Net NPAs.
The following regression equation was obtained: Y = 5558.449 + 0.620X1 + 52.103X2 – 46.523X3
-1485.861X4 + e
Public Sector Banks
The following tables present the multiple regression results of macroeconomic variables and Gross NPAs of Public Sector Banks during 1996-97 to 2015-16.
Table No.7: Results of Multiple Regression Analysis
Model Summary
Model R R Square Adjusted R
Square F Change Sig. F Change Durbin-Watson
1 0.913 0.833 0.788 18.706 .000 2.320
Table No.8: Regression Coefficients
Variable
Un-standardized Coefficients
B
Standardized Coefficients
Beta
t -value Sig. H0 Accepted: Rejected/ VIF
(Constant) 8402.916 3.113 0.007
GDP 0.972 0.518 2.935 0.010 Rejected 2.798
Interest Rate 80.575 0.146 1.110 0.285 Accepted 1.546
Inflation Rate -76.509 -0.186 -1.405 0.180 Accepted 1.576
Unemployment Rate -2225.671 -0.561 -3.819 0.002 Rejected 1.938
Dependent Variable: Gross NPAs
Table No.7 indicates the model summary of multiple regression analysis. The result of the model shows that the value of R is 0.913, which indicates a high correlation between dependent (Gross NPAs) and independent variables. The value of R square is 0.833. The p value of the model is 0.000 which is less than 0.05 indicating that the regression model is statistically significant and a fit model. Table No.8 illustrates the results of regression analysis for Gross NPAs and Macroeconomic variables. Results of multiple regression reveals that the p value of GDP and Unemployment rate is 0.010 and 0.002 respectively; these are less than 0.05 at 5 % level of significance. This indicates that there is a statistically
significant relationship between GDP and Gross NPAs and also Unemployment rate and Gross NPAs. The p value of Interest rate and Inflation rate is 0.285 and 0.180 respectively; these are more than 0.05 at 5 % level of significance. This indicates that there is a statistically insignificant relationship between Inflation rate Gross NPAs and also Interest rate and Gross NPAs. The following regression equation was obtained:
Y = 8402.916 + 0.972X1 + 80.575X2 – 76.509X3 –
2225.671X4 + e
The following tables present the multiple regression results of macroeconomic variables and Net NPAs of Public Sector Banks during 1996-97 to 2015-16.
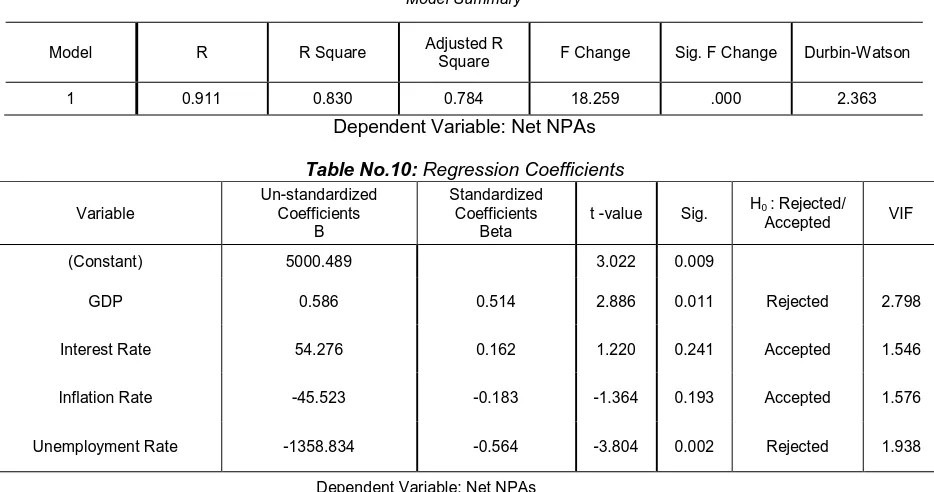
Table No.9: Results of Multiple Regression Analysis
Model Summary
Model R R Square Adjusted R
Square F Change Sig. F Change Durbin-Watson
1 0.911 0.830 0.784 18.259 .000 2.363
Dependent Variable: Net NPAs
Table No.10: Regression Coefficients
Variable
Un-standardized Coefficients
B
Standardized Coefficients
Beta
t -value Sig. H0 : Rejected/
Accepted VIF
(Constant) 5000.489 3.022 0.009
GDP 0.586 0.514 2.886 0.011 Rejected 2.798
Interest Rate 54.276 0.162 1.220 0.241 Accepted 1.546
Inflation Rate -45.523 -0.183 -1.364 0.193 Accepted 1.576
Unemployment Rate -1358.834 -0.564 -3.804 0.002 Rejected 1.938
Dependent Variable: Net NPAs
Table No.9 indicates the model summary of multiple regression analysis. The result of the model shows that the value of R is 0.911, which indicates a high correlation between dependent (Net NPAs) and independent variables. The value of R square is 0.830. The p value of the model is 0.000 which is less than 0.05 indicating that the regression model is statistically significant and a fit model. Table No.10
and Net NPAs. The p value of Interest rate and Inflation rate is 0.241and 0.193 respectively; these are more than 0.05 at 5 % level of significance. This indicates that there is a statistically insignificant relationship between Inflation rate Net NPAs and also Interest rate and Net NPAs. The following regression equation was obtained:
Y = 5000.489 + 0.586X1 + 54.276X2 – 45.523X3 – 1358.834X4 + e
Private Sector Banks
The following tables present the multiple regression results of macroeconomic variables and Gross NPAs of Private Sector Banks during 1996-97 to 2015-16.
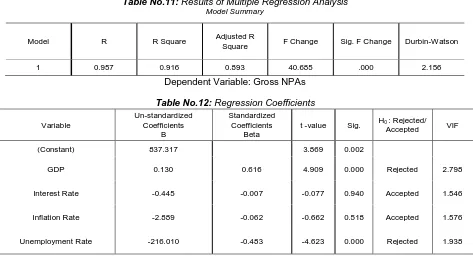
Table No.11: Results of Multiple Regression Analysis
Model Summary
Model R R Square Adjusted R
Square F Change Sig. F Change Durbin-Watson
1 0.957 0.916 0.893 40.685 .000 2.156
Dependent Variable: Gross NPAs
Table No.12: Regression Coefficients
Variable
Un-standardized Coefficients
B
Standardized Coefficients
Beta
t -value Sig. H0 : Rejected/
Accepted VIF
(Constant) 837.317 3.869 0.002
GDP 0.130 0.616 4.909 0.000 Rejected 2.798
Interest Rate -0.445 -0.007 -0.077 0.940 Accepted 1.546
Inflation Rate -2.889 -0.062 -0.662 0.518 Accepted 1.576
Unemployment Rate -216.010 -0.483 -4.623 0.000 Rejected 1.938
Dependent Variable: Gross NPAs
Table No.11 indicates the model summary of multiple regression analysis. The result of the model shows that the value of R is 0.957, which indicates a high correlation between dependent (Gross NPAs) and independent variables. The value of R square is 0.916. The p value of the model is 0.000 which is less than 0.05 indicating that the regression model is statistically significant and a fit model.Table No.12 illustrates the results of regression analysis for Gross NPAs and Macroeconomic variables. Results of multiple regression reveals that the p value of GDP and Unemployment rate is 0.000 and 0.000 respectively; these are less than 0.05 at 5 % level of significance. This indicates that there is a statistically
significant relationship between GDP and Gross NPAs and also Unemployment rate and Gross NPAs. The p value of Interest rate and Inflation rate is 0.940 and 0.518 respectively; these are more than 0.05 at 5 % level of significance. This indicates that there is a statistically insignificant relationship between Inflation rate Gross NPAs and also Interest rate and Gross NPAs. The following regression equation was obtained:
Y = 837.317 + 0.130X1 – 0.445X2 – 2.889X3 – 216.010X4 + e
The following tables present the multiple regression results of macroeconomic variables and Net NPAs of Private Sector Banks during 1996-97 to 2015-16.
Table No.13: Results of Multiple Regression Analysis
Model Summary
Model R R Square Adjusted R
Square F Change Sig. F Change Durbin-Watson
1 0.932 0.868 0.833 24.663 .000 2.454
Table No.14: Regression Coefficients
Variable
Un-standardized Coefficients
B
Standardized Coefficients
Beta
t -value Sig. H0 Accepted: Rejected/ VIF
(Constant) 525.465 4.349 0.001
GDP 0.038 0.400 2.550 0.022 Rejected 2.798
Interest Rate -1.204 -0.043 -0.370 0.716 Accepted 1.546
Inflation Rate -1.032 -0.050 -0.423 0.678 Accepted 1.576
Unemployment Rate -129.091 -0.646 -4.948 0.000 Rejected 1.938
Dependent Variable: Net NPAs
Table No.13 indicates the model summary of multiple regression analysis. The result of the model shows that the value of R is 0.932, which indicates a high correlation between dependent (Net NPAs) and independent variables. The value of R square is 0.868. The p value of the model is 0.000 which is less than 0.05 indicating that the regression model is statistically significant and a fit model. Table No.14 illustrates the results of regression analysis for Net NPAs and Macroeconomic variables. Results of multiple regression reveals that the p value of GDP and Unemployment rate is 0.022 and 0.000 respectively; these are less than 0.05 at 5 % level of significance. This indicates that there is a statistically significant relationship between GDP and Net NPAs and also Unemployment rate
and Net NPAs. The p value of Interest rate and Inflation rate is 0.716 and 0.678 respectively; these are more than 0.05 at 5 % level of significance. This indicates that there is a statistically insignificant relationship between Inflation rate Net NPAs and also Interest rate and Net NPAs.
The following regression equation was obtained:
Y = 525.465 + 0.038X1 – 1.204X2 – 1.032X3 – 129.091X4 + e
Foreign Banks
The following tables present the multiple regression results of macroeconomic variables and Gross NPAs of Foreign Banks during 1996-97 to 2015-16.
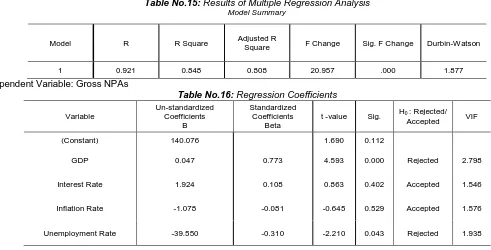
Table No.15: Results of Multiple Regression Analysis
Model Summary
Model R R Square Adjusted R Square F Change Sig. F Change Durbin-Watson
1 0.921 0.848 0.808 20.957 .000 1.877
Dependent Variable: Gross NPAs
Table No.16: Regression Coefficients
Variable
Un-standardized Coefficients
B
Standardized Coefficients
Beta
t -value Sig. H0 : Rejected/
Accepted VIF
(Constant) 140.076 1.690 0.112
GDP 0.047 0.773 4.593 0.000 Rejected 2.798
Interest Rate 1.924 0.108 0.863 0.402 Accepted 1.546
Inflation Rate -1.078 -0.081 -0.645 0.529 Accepted 1.576
Unemployment Rate -39.550 -0.310 -2.210 0.043 Rejected 1.938
Dependent Variable: Gross NPAs
Table No.15 indicates the model summary of multiple regression analysis. The result of the model shows that the value of R is 0.921, which indicates a high correlation between dependent (Gross NPAs) and independent variables. The value of R square is 0.848. The p value of the model is .000 which is less than 0.05 indicating that the regression model is statistically significant and a fit model.
also Unemployment rate and Gross NPAs. The p value of Interest rate and Inflation rate is 0.402 and 0.529 respectively; these are more than 0.05 at 5 % level of significance. This indicates that there is a statistically insignificant relationship between Inflation rate Gross NPAs and also Interest rate and Gross NPAs.
The following regression equation was obtained:
Y = 140.076 + 0.047X1 + 1.924X2 – 1.078X3 – 39.550X4 + e
The following tables present the multiple regression results of macroeconomic variables and Net NPAs of Foreign Banks during 1996-97 to 2015-16.
Table No.17: Results of Multiple Regression Analysis
Model Summary
Model R R Square Adjusted R
Square F Change Sig. F Change Durbin-Watson
1 0.798 0.637 0.540 6.570 .003 1.709
Dependent Variable: Net NPAs
Table-18: Regression Coefficients
Variable
Un-standardized Coefficients
B
Standardized Coefficients
Beta
t -value Sig.
H0 :
Rejected/ Accepted
VIF
(Constant) -5.900 -0.198 0.846
GDP 0.010 0.730 2.806 0.013 Rejected 2.798
Interest Rate -0.128 -0.031 -0.159 0.875 Accepted 1.546
Inflation Rate 0.539 0.175 0.898 0.384 Accepted 1.576
Unemployment Rate 1.495 0.050 0.232 0.819 Accepted 1.938
Dependent Variable: Net NPAs
Table No.17 indicates the model summary of multiple regression analysis. The result of the model shows that the value of R is 0.798, which indicates a high correlation between dependent (Net NPAs) and independent variables. The value of R square is 0.637. The p value of the model is 0.003 which is less than 0.05 indicating that the regression model is statistically significant and a fit model. Table No.18 illustrates the results of regression analysis for Net NPAs and Macroeconomic variables. Results of multiple regression reveals that the p value of GDP is 0.013, which is less than 0.05 at 5 % level of significance. This indicates that there is a statistically significant relationship between GDP and Net NPAs. The p value of Interest rate, Inflation rate and Unemployment rate is 0.875, 0.384 and 0.819
respectively; these are more than 0.05 at 5 % level of significance. This indicates that there is a statistically insignificant relationship between Interest rate and Net NPAs, Inflation rate and Net NPAs and also Unemployment rate and Net NPAs. It is interesting to say that there is an insignificant relationship between Unemployment rate and Net NPAs of Foreign Banks, but it is significant in Scheduled Commercial Banks, Public Sector Banks and Private Sector Banks. It is an evident that the Foreign Banks are performing well in terms of controlling the Net NPAs in Indian banking sector.
The following regression equation was obtained: Y = -5.900 + 0.010X1 – 0.128X2 + 0.539X3 – 1.495X4 + e
CONCLUSION
Based on the above results the following summary of hypotheses results were drawn.
Table No.19: Summary of Hypotheses Results (H0 : Accept/Reject)
Dependant Variables Scheduled Commercial
Banks Public Sector Banks Private Sector Banks Foreign Banks
GNPAs NNPAs GNPAs NNPAs GNPAs NNPAs GNPAs NNPAs
GDP Reject Reject Reject Reject Reject Reject Reject Reject
From the above table it is observed that there is a statistically significant relationship between Gross Domestic Product (GDP) and NPAs (both GNPAs and NNPAs) and Inflation Rate and NPAs (both GNPAs and NNPAs) of Public and Private Sector Banks. But interesting one is the Unemployment rate is statistically insignificant relationship with Net NPAs of Foreign Banks. It is evident that, Indian Unemployment rate didn’t impact on the Foreign Banks operations in India. Hence, there is a statistically insignificant relationship between Interest rate and NPAs and also Inflation Rate and NPAs of Foreign Banks. It means there is no significant relationship between them. So the RBI and Government of India should try to provide employment to the public by encouraging emerging enterprises or corporates. It leads to increase the GDP and employment rate. If the GDP is growing up, the NPAs will decline. Then the Indian banking sector will become healthy as well as the Indian economy also.
REFERENCES
[1] Asari et al. (2011). An Analysis of Non-Performing Loan, Interest Rate and Inflation Rate Using Stata Software, World Applied Sciences Journal, 12, 41-48. [2] Amit Ghosh (2015). Banking-Industry Specific and Regional Economic Determinants of Non-Performing Loans: Evidence form US States, Journal of Financial Stability, 20, 93-105.
[3] Chaiporn Vithessonthi (2016). Deflation, Bank Credit Growth, and Non-Performing Loans: Evidence from Japan, International Review of Financial Analysis, 45, 295-305.
[4] Caprio and Klingebie (1996). Bank Insolvencies: Cross-Country Experience, Policy Research Working Paper, 1620, World Bank.
[5] Dimitrios P. Louzis et al. (2012). Macroeconomic and Bank-Specific Determinants of Non-Performing Loans in Greece: A Comparative Study of Mortgage, Business and Consumer Loan Portfolios, Journal of Banking and Finance, 36 (4), 1012-1027.
[6] Dash and Kabra (2010). The Determinants of Non-performing Assets in Indian Commercial Bank an Econometric Study, Middle Eastern Finance and Economics, 7, 94-106.
[7] Jimenez, G. and Saurina. J (2006). Credit Cycles, Credit Risk and Prudential Regulation, International Journal for Central Banking, 2 (2), 65-98.
[8] Joseph F. Sinkey JR and Mary Brady Greenawalt (1991). Loan-Loss Experience and Risk-Taking Behavior at Large Commercial Banks, Journal of Financial Services Research, 5, 43-59.
[9] Kevin Greenidge and Tiffany Grosvenor (2010). Forecasting Non-Performing Loans in Barbados, Business, Finance & Economics in Emerging Economies, 5 (1), 79-108.
[10] Louzin, Vouldis and Metaxas V.I. (2010). Macroeconomic and Bank Specific Determinants of Nonperforming Loans in Greece: A Comparative Study of Mortgage, Business and Consumer Loan Portfolios Bank of Greece, Working Paper -118. [11] Lobna Abid et al. (2014). Macroeconomic and
Bank-Specific Determinants of Household’s Non-Performing Loans in Tunisia: A Dynamic Panel Data, Procedia Economics and Finance, 13, 58-68.
[12] Munib Badar et al. (2013). Impact of Macro Economic Forces on Nonperforming Loans and Empirical Study of Commercial Banks in Pakistan, Elixir International Journal, 56A, 13807-13814.
[13] Svetozar Tanaskovic and Maja Jandric (2014). Macroeconomic and Institutional Determinants of Non-Performing Loans, Journal of Central Banking Theory and Practice, 1, 47-62.
[14] Sofoklis D. Vogiazas and Eftychia Nikolaidou (2011). Investigating the Determinants of Nonperforming Loans in the Romanian Banking System: An Empirical Study with Reference to the Greek Crisis, Economics Research International, 11, 1-14.
[15] Vicente Salas and Jesus Saurina (2002). Credit Risk in Two Institutional Regimes: Spanish Commercial and Savings Banks, Journal of Financial Services Research, 22(3), 203-224.
[16] William R. Keeton and Charles S. Morris (1987). Why Do Banks’ Loan Losses Differ? Economic Review, Federal Reserve Bank of Kansas City, 3-21.
[17] Websites
1. https://ycharts.com/indicators/india_unemployment _rate_annual
2. http://www.inflation.eu/inflation-rates/india/historic-inflation/cpi-inflation-india.aspx
3. https://m.theglobaleconomy.com/India/data_gdp_gr owth/
4. www.rbi.org
Appendix
Economic Variables
Year GDP (Billion) Interest Rate Inflation Unemployment Rate
1997 423.19 13.82 7.25 4.39
1998 428.77 12.01 13.17 4.12
1999 466.84 11.86 4.84 4.22
2000 476.64 11.77 4.02 4.31
2001 493.93 10.95 3.77 3.78
2002 523.77 9.44 4.31 4.32
2003 618.37 7.34 3.81 3.93
2005 834.22 6.11 4.25 4.4
2006 949.12 7.34 5.79 4.33
2007 1,238.70 7.89 6.39 3.72
2008 1,224.10 8.12 8.32 4.15
2009 1,365.37 7.69 10.83 3.91
2010 1,708.46 7.23 12.11 3.55
2011 1,822.99 7.92 8.87 3.54
2012 1,828.98 8.52 9.3 3.62
2013 1,863.21 8.36 10.92 3.57
2014 2,042.56 8.45 6.37 3.53
2015 2,073.00 8.51 5.88 3.49
2016 2,250.99 7.89 4.97 3.46
Non-Performing Assets of Banks
Year SCB Gross NPAs
SCB Net NPAs
PSB Gross NPAs
PSB Net NPAs
PriSB Gross NPAs
PriSB Net NPAs
FB Gross
NPAs FB Net NPAs
1997 473 223.4 435.77 202.85 2.17 1.54 11.81 5.16
1998 508.15 237.61 456.53 212.32 3.92 2.91 19.76 6.66
1999 587.22 280.2 517.10 242.11 8.71 6.11 23.57 8.66
2000 604.08 300.73 530.33 261.87 9.46 6.38 26.14 8.55
2001 637.41 324.61 546.72 279.77 16.17 9.29 31.06 7.85
2002 708.61 355.54 564.73 279.58 68.11 36.63 27.26 9.20
2003 687.17 296.92 540.90 248.77 72.32 13.65 28.45 9.03
2004 648.12 243.96 515.37 193.35 59.83 19.86 28.94 9.33
2005 593.73 217.54 483.99 169.04 45.82 23.53 21.92 6.39
2006 510.97 185.43 413.58 145.66 40.52 17.96 19.28 8.08
2007 504.86 201.01 389.68 151.45 62.87 31.37 22.63 9.27
2008 563.09 247.3 404.52 178.36 104.40 49.07 28.59 12.47
2009 683.28 315.64 449.57 211.55 138.54 62.52 64.44 29.96
2010 846.98 387.23 599.26 293.75 140.17 52.34 71.33 29.77
2011 979 417 746.00 360.00 145.00 34.00 50.00 12.00
2012 1423.26 650.19 1172.62 592.05 187.68 44.01 62.97 14.12
2013 1935.09 986.09 1644.61 899.52 210.71 59.94 79.77 26.63
2014 2633.72 1423.83 2272.64 1303.62 245.42 88.62 115.65 31.60
2015 3233.35 1758.41 2784.68 1599.51 341.06 141.28 107.61 17.62
2016 6119.47 3498.2 5399.56 3203.76 561.86 266.77 158.05 27.67