OPTIMISATION OF CONTAINMENT GEOMETRY NODALISATION
WITH THE LUMPED PARAMETER CODE ASTEC FOR HYDROGEN
DISTRIBUTION STUDIES IN IPHWRs
Sunil Ganju, R. K. Singh and K. K. Vaze
Reactor Safety Division, Bhabha Atomic Research Centre, Mumbai, India-400085
E-mail of corresponding author: [email protected]
ABSTRACT
Release of hydrogen in the event of a severe accident in a nuclear power plant can be a potential threat to the integrity of the containment building. Being much lighter than air, stratification or non-uniform distribution of H2 within the complex, multi-compartment geometry of the nuclear reactor containment is very high. The objective
of the present study is to optimise the containment nodalisation scheme for the Indian Pressurised Heavy Water Reactors (IPHWRs) and perform safety analysis using the lumped parameter code ASTEC (Accident Source Term Evaluation Code). The guidelines evolved for the optimal nodalisation of the containment geometry and the subsequent results for a hydrogen distribution behaviour analysis in the containment of IPHWRs are presented in the paper.
INTRODUCTION
The behaviour of large amounts of hydrogen which may be released into the containment of a nuclear reactor under certain postulated accident scenarios, has been a subject of safety research worldwide. The H2, which
gets released into the containment building, being much lighter than air, is expected to move upwards due to buoyancy and hence there is a possibility of non-uniform hydrogen distribution within the multi-compartment containment geometry. Knowledge about the post-accident spatial and temporal behaviour of hydrogen-air-steam mixtures inside the containment is essential to assess the possibility of a hydrogen burn and its location.
As a part of technology development programme for hydrogen related safety issues in IPHWRs, several analytical studies are underway at BARC. Under the framework of the co-operation agreement between IRSN, France and BARC, India, an analytical tool available at BARC for such studies is the integral severe accident analysis code ASTEC [1, 2, 3]. This code is a lumped parameter code jointly developed by IRSN, France and GRS, Germany for evaluating various accident scenarios in a nuclear reactor This code has been validated [4] by simulating several single / multi-compartment hydrogen distribution experiments, viz., NUPEC-M-7-1 [5], HDR E11.2/11.4 [6] and BMC Gx4 [7]. At BARC, ASTEC has been used [8] for the study and analysis of the thermal hydraulics and the hydrogen distribution behaviour in the containment of IPHWRs.
It has been noted from earlier studies performed for PWRs [9] that while using the lumped parameter codes, simulation of convective processes like hydrogen distribution is sensitive to the nodalisation scheme adopted. It has been highlighted that an appropriate, problem oriented discretisation of the containment is a key requirement to obtain reliable results with lumped parameter codes. In principle, a quasi-3-D representation of the containment is possible only with a detailed nodalisation containing a large number of nodes. But this requires a large effort to generate the input data and the calculation becomes expensive in terms of CPU-time. On the contrary, physically inconsistent results can be the consequence of a coarse nodalisation. Therefore, a compromise between a detailed and a coarse nodalisation has to be found.
METHODOLOGY TO EVOLVE CONTAINMENT NODALISATION SCHEME
Input formulation
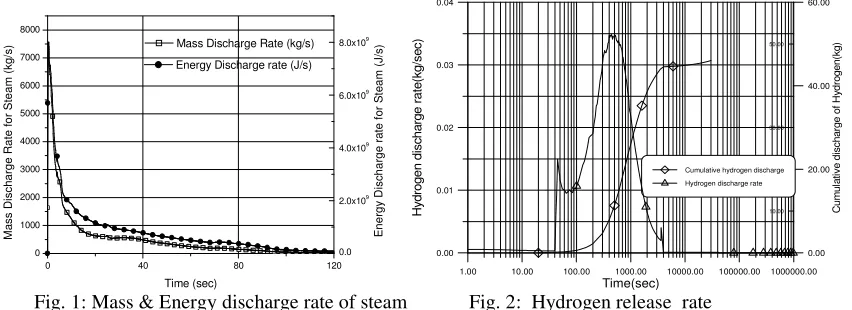
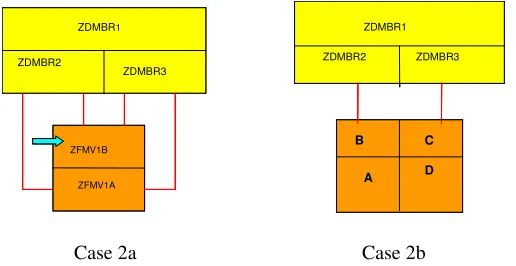
The studies have been performed using the computer code ASTEC. The accident scenario considered for the present studies is derived from an accident scenario considered in the safety analysis of IPHWRs. The considered transient, Large Break LOCA in one of the reactor inlet headers with non-availability of the Emergency Core Cooling System (ECCS), leads to release of hydrogen from the metal-water reaction besides the release of steam [8]. The steam discharge and hydrogen injection rates which are used as an input for the present studies are given in Fig. 1 and Fig. 2 respectively. About 46 kg of hydrogen is released over a period of 8.5 hrs out of which over 97 % gets released within 1 hr of the accident. Approximately 63,000 kg of steam is released within 120 seconds.
0 40 80 120 0 1000 2000 3000 4000 5000 6000 7000 8000 M a s s D is c h a rg e R a te f o r S te a m ( k g /s ) Time (sec)
Mass Discharge Rate (kg/s)
0.0 2.0x10⁹ 4.0x10⁹ 6.0x10⁹ 8.0x10⁹ E n e rg y D is c h a rg e r a te f o r S te a m ( J /s )
Energy Discharge rate (J/s)
1.00 10.00 100.00 Time(sec)1000.00 10000.00 100000.00 1000000.00
0.00 0.01 0.02 0.03 0.04 H y d ro g e n d is c h a rg e r a te (k g /s e c ) 10.00 30.00 50.00 0.00 20.00 40.00 60.00 C u m u la ti v e d is c h a rg e o f H yd ro g e n (k g )
Cumulative hydrogen discharge
Hydrogen discharge rate
Fig. 1: Mass & Energy discharge rate of steam Fig. 2: Hydrogen release rate
As mentioned in the previous section, a preliminary study was performed earlier at BARC for the simulation of hydrogen behaviour in the containment geometry of IPHWRs. This study was performed using a coarse nodalisation scheme for the containment nodalisation. For this study, the designation of various zones and the containment nodalisation scheme for simulation in ASTEC are given in Fig. 3. For all the subsequent studies the overall philosophy for the nodalisation of the containment geometry was kept the same. The major compartments in the actual containment geometry were retained and variations in definitions of the sub-volumes and junctions were performed.
Fig. 3: Typical IPHWR containment and its nodalisation in ASTEC
ASTEC notation Designation of IPHWR compartments ZFMV1 Fuelling Machine Vault 1 ZFMV2 Fuelling machine Vault 2 ZPRV1 Pump Room Vault 1 ZPRV2 Pump Room Vault 2 ZSGV1 Steam Generator Vault 1 ZSGV2 Steam Generator Vault 2 ZDMBR Dome & Boiler Room
ZSHFT Vent Shaft Annulus ZSPOOL Suppression Pool
ZVOL2 All compartments in V2 area ASTEC notation Designation of IPHWR
compartments ZFMV1 Fuelling Machine Vault 1 ZFMV2 Fuelling machine Vault 2 ZPRV1 Pump Room Vault 1 ZPRV2 Pump Room Vault 2 ZSGV1 Steam Generator Vault 1 ZSGV2 Steam Generator Vault 2 ZDMBR Dome & Boiler Room
ZSHFT Vent Shaft Annulus ZSPOOL Suppression Pool
Methodology
For lumped parameter codes, the nodalisation scheme should ensure that proper flow paths across the various volumes can be established numerically. For example, simulation of large physical volumes like the Fuelling Machine Vault and the Dome region of the IPHWR containment using a single zone can cause numerical instabilities and effect the establishment of flow paths across various zones. This could lead to an artificial accumulation of hydrogen in a single zone and the code would consequently predict no flow across compartment inter-connections. Similarly, the location of injection of lighter gas in a volume affects the establishment of density induced convection loops across any two volumes. Injection at the top can contribute to a faster transport in to the connected volume if there is junction in the top location. Else, hydrogen stagnation in a zone is possible in case of top injection.
Hence, as a first step, the conditions under which the inter-compartment transport of a species or a gas was governed by numerical convergence issues rather than the physical phenomena, were established. A compartment corresponding to a physical room in the actual containment was sub-divided into progressively increasing smaller volumes. Variations in the junction definitions and the location of lighter gas injection (top or bottom of a volume) location amongst these sub-volumes and subsequently across the neighbouring volumes were made and the effect on the hydrogen distribution was studied. The case studies performed are summarised below:
Case 1: This case was formulated to study the definition of junctions and the effect of sub-division of a single volume on the establishment of convection path. The Fuelling Machine Vault (ZFMV1) was sub-divided into 2 and 4 volumes.
Case 2: This case was formulated to study the effect of sub-division of two neighbouring volumes on the establishment of convection path across two neighbouring volumes of the containment. ZFMV1 was sub-divided into 2 and 4 sub-volumes, ZDMBR was divided into 3 volumes and junction definition across sub volumes was varied.
The nodalisation philosophy for Case 1 is depicted in Fig. 4 (Case 1a, 1b, 1c and 1d) and for Case 2, in Fig. 5 (Case 2a and 2b).
Case 1a Case 1b Case 1c Case 1d
Fig. 4: Block diagrams for nodalisation of FMV1 and DMBR for Case 1
Case 2a Case 2b
Fig. 5: Block diagrams for nodalisation of FMV1 and DMBR for Case 2
FMV1 A
FMV1B ZDMBR
Steam + H2 Steam +
H
FMV1 A FMV1 B
ZDMBR
Steam + H2
FMV1 A FMV1 B ZDMBR
Steam + H2
A B C
D
ZDMBR
ZFMV1
ZDMBR2
ZDMBR3 ZDMBR1
ZFMV1B
ZFMV1A
ZDMBR1
ZDMBR2 ZDMBR3
A B C
D
ZDMBR2
ZDMBR3 ZDMBR1
ZFMV1B
ZFMV1A ZDMBR2
ZDMBR3 ZDMBR1
ZFMV1B
ZFMV1A
ZDMBR1
ZDMBR2 ZDMBR3
A B C
D
ZDMBR1
ZDMBR2 ZDMBR3
A B C
Sensitivity analysis was then undertaken by dividing each zone (volume) into a number of sub-volumes to capture any localised hydrogen build up (stratification). Stratification being a gravity driven phenomenon, a vertical subdivision in volume is more important than a horizontal one. Starting from a 13-zone nodalisation, hydrogen distribution analysis was performed for 32-zone, 46-zone, 60-zone and 74-zone nodalisation of the IPHWR geometry. Within each nodalisation scheme, additional sub-cases were analysed to confirm the consistency of results. The various cases studied are summarised below:
Case 3: Discretisation of containment geometry into 32 zones (a single zone subdivided into 4 sub-zones) Case 4: Discretisation into 46 zones (a single zone subdivided into 6 sub-zones)
Case 5: Discretisation into 60 zones (a single zone subdivided into 8 sub-zones) Case 6: Discretisation into 74 zones (a single zone subdivided into 10 sub-zones)
In the above cases, zone ZSHFT, ZSPOOL and ZVOL2 were retained as a single zone because in the actual accident conditions, ZSPOOL and ZVOL2 are not expected to receive any significant hydrogen. The accumulation of hydrogen in the zone ZSHFT (being an annular region in the containment), is expected to occur late into the accident sequence. Hence sub-dividing this zone does not affect the distribution behavior in the other zones. Emphasis has been given to horizontal splitting as compared to vertical splitting so that the elevation of the original compartment gets sub-divided. The zone of injection of steam and hydrogen has generally been chosen to be from among the topmost zones (unless otherwise specified). The nodalisation philosophy to sub-divide a particular volume into 4 or 6 sub-zones is depicted in Fig. 6. The general philosophy to connect the sub-divided zones belonging to an actual compartment of the containment to another compartment is represented in Fig. 7.
Fig. 6: Sub-division of an actual compartment Fig. 7: Inter-connections between compartments
Typically, following results have been analysed to study the effect of various modifications performed on the nodalisation scheme:
a) Value of the peak hydrogen concentration attained in a compartment b) Time to achieve the peak value.
c) Time required achieving homogenisation of hydrogen across the various volumes. d) CPU time required for the calculation
RESULTS AND DISCUSSION
Case 1
The hydrogen concentration profiles for some studies performed as part of Case 1 are presented in Fig. 8 and Fig. 9. For all the cases simulated, the peak hydrogen concentration is attained in the break compartment region only. After the peak is achieved in the break compartment, buoyancy gradients help to transport the hydrogen into adjacent volumes. This reduces the concentration in the break compartment and the concentration in the other volumes increases. Hydrogen gets distributed from the break compartment into the adjacent volumes (sub volumes of Fuelling Machine Vault, Dome Boiler Room, Pump Room Vaults, Steam Generator Vaults, etc.). Hence, it takes
A B
D C
subdivision into 4 subzones
Steam + H2
A B
D C
A B
D C
subdivision into 4 subzones
Steam + H2
A B
D C
E F
Steam + H2
subdivision into 6 subzones
A B
D C
E F
A B
D C
E F
Steam + H2
subdivision into 6 subzones
B
D C
A A
B C
D A
B C
D
A B A
C
D
ZDMBR
ZSGV1
RRR ZPRV1
ZFMV1
ZSGV1
some time for the concentration to homogenize across the various zones. This time is observed to be around 5000 s for Case 1a (Fig. 8). For this case, the homogenized concentration of 1.5 % (v/v) corresponds to the average hydrogen concentration in the containment excluding the volumes of ZSHFT, ZSPOOL and ZVOL2. Because of junction definitions in this case (there is only one connection from the DMBR zone to the ZSHFT zone); hydrogen does not reach the vent shaft area and consequently to the suppression pool, etc. For Case 1d, where FMV1 is divided into 4 sub-volumes, as is seen from Fig. 9, the peak hydrogen concentration is about 48 % (v/v) and the hydrogen gets accumulated in the sub-volumes of FMV1 only. In this case, the homogenized concentration comes to about 28% (v/v) at about 10000 seconds and this value corresponds to the total amount of hydrogen injected into the FMV1 only. This happens because of numerical convergence problems in establishing a flow path across the two connected zones.
Fig. 8: Hydrogen concentration profiles (Case 1a) Fig. 9: Hydrogen concentration profiles (Case 1d)
Case 2
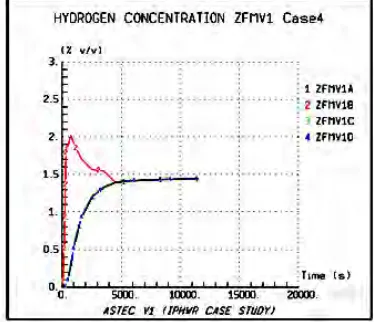
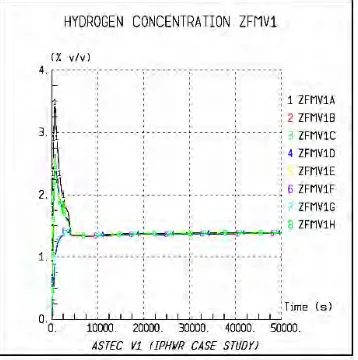
It was concluded from the results of Case 1 that with the sub-division of a particular zone, the method of connection across these zones played an important role in establishing the convection paths for hydrogen transport. For instance, with only one connection across any two zones, the buoyancy gradient could not be established because of numerical convergence problems. This postulation was further tested by performing simulations in Case 2 defined earlier. Typical results for the hydrogen concentration profiles for this study are presented in Fig. 10 and Fig. 11. As seen from Fig. 10 for Case 2a, the concentration profile homogenises to a uniform value of about 1.3 % (v/v). This corresponds to the average hydrogen concentration in the full containment volume, including the Vent Shaft area. By artificially splitting the existing single connection into more than one connection (total junction area is kept constant), the convection of hydrogen from ZDMBR into ZSHFT was established. For Case 2b, similar concentration profiles can be observed as shown in Fig. 11. The variation of peak concentration between Fig. 10 and Fig. 11 is due to the change in injection location for these two cases.
Sensitivity Studies
The discretisation philosophy evolved from the studies performed under Case 1 and Case 2 was used to undertake detailed grid sensitivity studies for the whole containment geometry. The geometry of the IPHWR containment was progressively refined by increasing the number of nodes (or zones) used to descretise the full geometry (Case 3 to Case 6 described above). Typical results for these studies are presented in Fig. 12 and Fig. 13. The lower peak concentration in the cases for injection in top zones (Fig. 12) is attributed to the fact that these zones offer lower resistance for hydrogen to travel from one zone to the other zone (because of lesser number of flow paths).
Fig. 12: H2 concentration profiles Fig. 13: H2 concentration profiles
(Case 3- injection in top zone ZFMV1B) (Case 5-injection in bottom zone ZFMV1A)
Owing to the increasingly complex network of zones and junction with the increasing number of nodes, the calculation time for the finer nodalisation schemes, increased tremendously. The present studies were performed on a Core 2 Duo PC and the calculation times for 13, 32, 46 and 60 nodes were noted to be about 45 min, 2 hrs, 3.5 hrs, and 6 hrs respectively. For the studies performed for 74 nodes, the calculation time increased drastically. The computer took about 30 hrs to run the problem for only about 62 seconds of analysis (the total analysis time for the accident sequence was defined to be about 5000 seconds). A summary of the results for the various configurations from 13 to 60 nodes is presented in Table 1 below.
Table 1: Summary of peak hydrogen concentration results obtained for various cases
Sr. No.
Description Peak hydrogen concentration in the break compartment (% v/v)
Injection Location (Break Compartment): Top most zone in ZFMV1
1 Case 1 (13 nodes) 2.0
2 Case 2 (13 nodes) 2.4
3 Case 3 (32 nodes) 2.25
4 Case 4 (46 nodes) 2.3
5 Case 5 (60 nodes) 2.25
Injection Location (Break Compartment): Bottom most zone in ZFMV1
6 Case 3 (13 nodes) 3.25
7 Case 4 (46 nodes) 3.5
8 Case 5 (60 nodes) 3.3
CONCLUSIONS
Computer code ASTEC has been used to study the hydrogen distribution behaviour in the containment geometry of IPHWRs under a postulated accident sequence. An assessment of the sensitivity of the hydrogen distribution profile to injection location, junction definitions across various volumes and the sub-division of individual compartments was first performed. On the basis of these studies, criteria for ensuring the proper establishment of convection loops and avoiding numerical convergence problems were established. Broad guidelines for the nodalisation of the geometry for ASTEC were formulated and a detailed parametric study in refining the nodalisation scheme has been performed. It was observed that larger compartments need to be sub-divided into smaller volumes with more than one connection across the various sub-volumes to avoid numerical convergence problems.
ACKNOWLEDGEMENT
The present study has been performed under the framework of the IRSN-BARC cooperation agreement in the field of nuclear reactor safety. The contribution of the ASTEC team for the completion of this work is gratefully acknowledged.
REFERENCES
[1] J. P. Van Dorsselaere, S.Pignet, C.Seropian, T.Montanelli, P.Giordano, F.Jacq, B.Schwinges, Development and assessment of ASTEC code for severe Accident simulation, NURETH-11, Avignon, France, Oct, 2005 [2] J. Bestele, W. Klein-Heβling, “ASTEC V0 CPA module, Containment Thermal Hydraulics and Aerosol
and FP Behaviour-USER GUIDELINES, Rev. 0”, GRS report ASTEC-V0/DOC/00-14, IRSN, France, Sept.2000.
[3] W. Klein-Hebling , B. Schwinges, CPA Module- Program Reference Manual , ASTEC-V0/DOC/01-34, IRSN, France, Nov 1998
[4] B. Schwinges, M. Cranga, G. Weber, Principles of ASTEC Validation, Description of the Basic Validation Matrix, ASTEC/VAL/01-01, NOTE TECHNIQUE SEMAR 01/31, IRSN, France, September 2002
[5] OECD -Final comparison report on ISP 35: NUPEC Hydrogen Mixing and DistributionTest (Test M-7-1),
NEA/CSNI/R(94)29, December 1994
[6] Luis A. Valenciaa, Hydrogen distribution tests under severe accident conditions at the large-scale HDR-facility, Nuclear Engineering and Design, Volume 140, Issue 1, April 1993, Pages 51-60
[7] Kanzleiter; T., Experiments on the Efficacy of Hydrogen Mitigation Methods Within a Multi compartment Containment Geometry, Final Report BIeV-R67.036-01, Germany, Nov.1991
[8] S. Ganju, W. Plumecocq, Application of Code ASTEC to assess the thermal-hydraulics and hydrogen distribution behaviour in the containment of Indian Pressurized Heavy Water Reactors under postulated accident condition, IRSN report ASTEC-V1/ MEM/ 02-07, September 2002