ISSN(Online): 2319-8753 ISSN (Print): 2347-6710
I
nternational
J
ournal of
I
nnovative
R
esearch in
S
cience,
E
ngineering and
T
echnology
(An ISO 3297: 2007 Certified Organization)
Website: www.ijirset.com
Vol. 6, Issue 4, April 2017
Floor Layout Planning Using Artificial
Intelligence Technique
Mitali Chavan, Nidhi Menon, Ritika Kumar, Shivani Rana
U.G. Students, Department of Computer Engineering, Pillai College of Engineering, New Panvel, Maharashtra, India
ABSTRACT: In the era of e-commerce while buying furniture online the customers obviously feel the need for visual representation of the arrangement of their furniture. Even when doing interiors of the house it's difficult to just rely on assumptions about best layouts possible and professional help may become quite expensive. In this project, we make use of Genetic Algorithm (GA) which is an Artificial Intelligence technique to display various optimal arrangements of furniture. The basic idea behind using GA is developing an evolutionary design model. This is done by generating chromosomes for each possible solution and then performing a crossover between them in each generation until an optimum fitness function is reached. Modification in chromosome representation may also be done for better results. The proposed system will generate different layout designs for the furniture keeping in consideration the structure of a master bedroom.
KEYWORDS: chromosome, genetic algorithm, genetic operators, layout generation I. INTRODUCTION
In architecture and building engineering, a floor plan is a drawing to scale, showing a view from above, of the relationships between rooms, spaces and other physical features at one level of a structure. Floor plans may include notes for construction to specify finishes, construction methods, or symbols for electrical items. The floor planning can be classified into two categories either an equal area layout problem or an unequal area layout problem. The equal area layout problem is to determine how to assign a set of distinct facilities, to a set of distinct locations, so that each facility can be assigned to a single location called as one-to-one assignment problem. The unequal area layout problem is to regulate the allocation of all facilities within a block plan (or available area). In the era of e-commerce while buying furniture online the customers obviously feel the need of visual representation of the arrangement of their furniture. Even when doing interiors of the house it's difficult to just rely on assumptions about best layouts possible and professional help may become quite expensive. The proposed system will allow users to view multiple possible solutions of given pieces of furniture and let them decide what they like the best. This kind of help with multiple furniture arrangements will also be very useful while developing real life indoor scenes for gaming or animation purposes. Optimizing furniture arrangement into a realistic and functional indoor configuration involves considerable complexity, taking into account various interacting factors, such as pair wise furniture relationships, spatial relationships with respect to the room, and other human factors. An effective representation that captures the necessary spatial relationships is needed. Some of the attributes to be considered while deciding furniture placement are - Bounding surfaces, Centre and orientation, Accessible space, Viewing frustum, Hierarchical relationships between different furniture objects.
The objective of this work is as follows:
1. To establish that Genetic Algorithm is a suitable technique for designing layout.
2. To discuss the mechanism of Genetic algorithm and to compare it with other placement algorithms and site the scenarios when it has proved to be more efficient.
ISSN(Online): 2319-8753 ISSN (Print): 2347-6710
I
nternational
J
ournal of
I
nnovative
R
esearch in
S
cience,
E
ngineering and
T
echnology
(An ISO 3297: 2007 Certified Organization)
Website: www.ijirset.com
Vol. 6, Issue 4, April 2017
II. RELATEDWORK
Jun H. Jo and John S. Gero [1] in their paper ‘Space Layout Planning Using an Evolutionary Approach’ describe a design method based on constructing a genetic/evolutionary design model. They touch the major issues while using genetic designing model like the formulation of knowledge representation set and the genetic communication. A set of design elements, is in the form of design rules and needs to be interpreted into the language of the genetic search system. On the basis of the advantages of genetic evolutionary design process and the results of the implementation, they concluded that the coupling of an evolutionary search technique with a design process can produce very good results, especially for large-scale problems which are at present computationally difficult.
The paper ‘Generic Chromosome Representation and Evaluation for Genetic Algorithms’ by Kristian Guillaumier [2] explores the role of chromosomes in genetic algorithms. In conventional implementations, most parameters, the fitness function, chromosome representation, and genetic operators are usually hard-coded. If the nature of the problem varies slightly or critical parameters change, the original code is revised sometimes substantially as per the need of the problem. The chromosomes are represented using a direct representation scheme. Once encoding is done, basic single point crossover and mutation is applied. According to the fitness value the generations of chromosomes are checked iteratively and the one closest to the fitness value or at which the limit is achieved is returned as the optimal solution. This technique has been implemented as a high-level modeling language called OPML (Optimization Problem Modeling Language) together with a general-purpose Genetic Algorithm-based runtime.
MohdSaberi Mohammad, Safaai Deris, Safie Mat Yatim, Muhammad Razib Othman[3] in their paper ‘Feature selection method using genetic algorithm for the classification of small and high dimension data’, propose feature selection method that finds and selects informative features from small or high dimension data thereby maximizing the efficiency of the classification process. They apply genetic algorithm to search out and identify the potential informative features combinations for classification and then use the classification accuracy from the support vector machine classifier to determine the fitness in genetic algorithm. The first proposed approach is called GASVM- a combination of GA with SVM without any modification in chromosome representation. The second proposed approach is that of New-GASVM which will modify the model of chromosome representation. On implementation along with the current best classifiers, the New-GASVM turns out to be the best performer.
Ryota Tachikawa and Yuko Osana [4] in their paper, ‘Office Layout Support System using Genetic Algorithm– Generation of Room Arrangement Plans for Polygonal Space’ propose an office layout support system using genetic algorithm. The proposed system has two phases: (1) generation of room arrangement plans and (2) generation of layout plans for workspace. The working is such that some conditions on rooms and furniture are given by a user and some room arrangement plans which satisfy the conditions are generated by Genetic Algorithm (GA). After one of them is selected by a user, some layout plans for workspace which satisfy the conditions are generated. A combined GA which is based on the Adaptive Genetic Algorithm (AGA) and the GA with Search Area Adaption (GSA) is employed in this system. For the generation of layout plans for workspace, layout plans are expressed in the form of genes in a similar fashion and further evaluation and computer experiments are done. When compared with normal genetic algorithm, AGA and GSA, it is found that the proposed system gives the best results.
Eugénio Rodrigues, Adélio Rodrigues Gaspar and Álvaro Gomes [5] in their paper ‘An evolutionary strategy enhanced with a local search technique for the space allocation problem in architecture, Part 1: Methodology’ propose an enhanced hybrid evolutionary computation scheme that couples an Evolutionary Strategy (ES) with a Stochastic Hill Climbing (SHC) technique to generate a set of floor plans to be used in the early design stages of architectural practice. The algorithm used presents a hybrid behavior by combining ES with an SHC technique. This algorithm is named Evolutionary Program for Space Allocation Problem (EPSAP) and uses adaptive operators to perform the geometric transformations of the rooms, their walls and connections, and openings according to previously stored information.
ISSN(Online): 2319-8753 ISSN (Print): 2347-6710
I
nternational
J
ournal of
I
nnovative
R
esearch in
S
cience,
E
ngineering and
T
echnology
(An ISO 3297: 2007 Certified Organization)
Website: www.ijirset.com
Vol. 6, Issue 4, April 2017
or a living room. The paper compares various placement algorithms for sensor layouts such as 1) Human Intuition-Based 2) Monte Carlo-Intuition-Based 3) Two-Dimensional Uniform Placement (Grid) 4) Hill Climbing and 5) Genetic Algorithm (GA) to prove that GA gives most accurate results. The paper thus concluded that the GA algorithm’s layouts are more efficient to generate than Hill Climbing, in addition to being significantly more accurate than the baseline algorithms tested.
Lap-Fai Yu, Sai-Kit Yeung, Chi-Keung, Demetri Terzopoulos, Tony F. Chan, and Stanley J. Osher [7] in their work ‘Make it Home: Automatic Optimization of Furniture Arrangement’, conducted a perceptual study to demonstrate that their system can synthesize multiple realistic furniture arrangements. The paper efficiently discusses Furniture Relationship Extraction, Furniture Arrangement Optimization and various Constraints that should not be violated. Furniture Relationship Extraction has two parts Object Representation and Learning Prior Relationships. Stochastic optimization methods, specifically, simulated annealing are used. The constraints mentioned are accessibility,
visibility and pathway connecting doors.
III.SCOPE OF THE RESEARCH
The proposed system will generate multiple layout designs for the furniture keeping in consideration the structure of a master bedroom. Its dimensions will be given as input by the user. The master bedroom will have a window and two doors; one for entering the room and one for the bathroom. The size of the doors, window and furniture elements considered will be predefined but the position of doors and windows would be given by the user. The furniture elements are Wardrobe, Bed and Table. The input given will be taken from the user in text format via a GUI and the output will be a collection of four best possible arrangements of the furniture elements. This will be represented in 2D format. The system design helps in maintaining basic relationship between the furniture elements and also with respect to the room. The output to be generated is the top view of the room. The proposed system is a NP-Complete problem since there is no known solution to it. The only system existing close to the proposed system involves the use of drag and drop of furniture elements in either a blank room layout or by selecting one of the room layouts already provided, that seem closest to their room. Since this doesn’t always fulfil the desires of the user and is likely to miss out or suffer human errors the proposed system proves its significance by automatically generating the best possible solutions keeping in mind the aesthetics and relationship among the different furniture elements.
IV.PROPOSED METHODOLOGY
The system follows all the stages of Genetic algorithm as shown in the fig. 4.1.
ISSN(Online): 2319-8753 ISSN (Print): 2347-6710
I
nternational
J
ournal of
I
nnovative
R
esearch in
S
cience,
E
ngineering and
T
echnology
(An ISO 3297: 2007 Certified Organization)
Website: www.ijirset.com
Vol. 6, Issue 4, April 2017
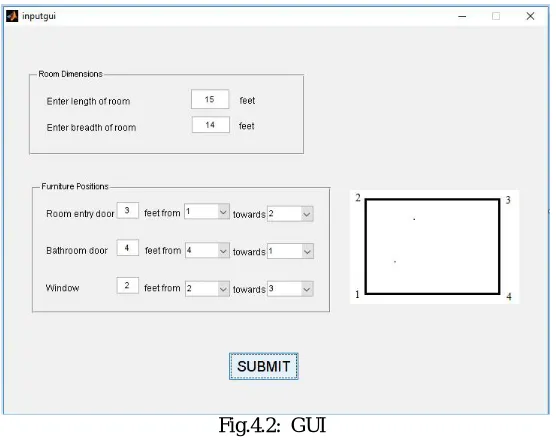
The input is taken from the user through the GUI where the user enters length, breadth and the distance of the doors and window from one point towards another point on a wall. The GUI has a rectangle displayed on the right which number the corner points to help the user measure the distances correctly as shown in fig. 4.2.
Fig.4.2: GUI
The system then generates a randomized population of chromosomes. These chromosomes contain information about the coordinates of left bottom corner and also their alignment i.e. horizontal or vertical.
Fig 4.3: Chromosome Structure
The fig.4.3 gives representation of a single chromosome. Each furniture object has a designated sub-range of the array to code information specifically about it. The designated ranges are as follows
sub- range (1:3) represents Bed ; XB and YB are coordinates of the bottom left corner of the Bed
sub-range (4:6) represents Table; XT and YT are coordinates of the bottom left corner of the Table
sub-range (7:9) represents Wardrobe; XW and YW are coordinates of bottom left corner of the Wardrobe
ISSN(Online): 2319-8753 ISSN (Print): 2347-6710
I
nternational
J
ournal of
I
nnovative
R
esearch in
S
cience,
E
ngineering and
T
echnology
(An ISO 3297: 2007 Certified Organization)
Website: www.ijirset.com
Vol. 6, Issue 4, April 2017
Constraints
Wardrobe Bed Table Min
Score
Max Score
Flags Min Score
Max Score
Flags Min Score
Max Score
Flags Yes No Yes No Yes No Overlap with
Bed 0 10 1 0 - - - - Overlap with
Table 0 10 1 0 0 10 1 0 - - - - Within room
dimensions 0 10 1 0 0 10 1 0 0 10 1 0 In front of room
door 0 10 1 0 0 10 1 0 0 10 1 0 In front of
washroom door 0 10 1 0 0 10 1 0 0 10 1 0 In front of
window 0 10 1 0 5 10 - - 7 10 - - Near to any
walls 5 10 - - 5 10 - - 5 10 - - Total Max/Min
Score 5 70 10 60 12 50 Table 4.1: Fitness scores
In addition to the score there are also flags included to notify certain conditions so that occurrences of false positives where a chromosome shows high fitness value score even after not fulfilling some basic conditions are identified. The scores assigned for each object were decided on the basis of trial and error method by experimenting with various random values and are subject to change as per the needs of the application.
Fitness score of Wardrobe is calculated out of 70
Fitness score of Bed is calculated out of 60
Fitness score of Table is calculated out of 50
Hence Maximum Fitness Score of a Chromosome = ∑ Maximum Fitness score of each Furniture object
= Maximum score of (Wardrobe + Bed + Table) = 70+60+50
= 180
Thus, Total Fitness score of a chromosome is always calculated out of 180.
Next we discuss flags; the flags give information about occurrence of conditions such as overlap, furniture exceeding room dimensions, furniture in front of any of the doors and wardrobe in front of the window. If a condition occurs then the flag is set to 1 otherwise set to 0. These conditions are checked for each object and then finally the flags for a chromosome are set by performing logical OR operation between the values of flags obtained for each object.
Fig. 4.4: Chromosome after Fitness Evaluation
The fig.4.4 represents the structure of the chromosome after its fitness has been calculated and related values are appended at the end of the chromosome. The flags are represented at positions 14,15,16,17 and 18.
Flag O - Flag is set to 1 if Overlap condition occurs
ISSN(Online): 2319-8753 ISSN (Print): 2347-6710
I
nternational
J
ournal of
I
nnovative
R
esearch in
S
cience,
E
ngineering and
T
echnology
(An ISO 3297: 2007 Certified Organization)
Website: www.ijirset.com
Vol. 6, Issue 4, April 2017
Flag WW - Flag is set to 1 if Wardrobe is in front of window
To decide whether these flags should be set to 0 or 1 first the above flag conditions are checked for each furniture object and accordingly local flags are set to 1 or 0 then logical OR operation is performed on these local flags to set the chromosome flags O, RL, DR, BDR thus these flags will be set to 1 even if anyone furniture object breaches any constraint. The last flag WW only displays exclusive information about Wardrobe and hence does not include any other operations.
The positions 10, 11, 12 and 13 represent Total fitness score (Totalfit), Wardrobe fitness score (Wfit), Bed fitness score (Bfit) and Table fitness score (Tfit) respectively.
Totalfit - Fitness value scored out of 180 for the entire chromosome
Wfit - Fitness value scored out of 70 for the arrangement of Wardrobe
Bfit - Fitness value scored out of 60 for the arrangement of Bed
Tfit - Fitness value scored out of 50 for the arrangement of Table Totalfit = ∑ Fitness value scored for each furniture object
= Wfit + Bfit + Tfit
The next step after evaluating fitness score is to select parent chromosomes for crossover. The selection operator used here is Steady State selection. This selection operator sets a minimum threshold fitness value and all the chromosomes with a higher fitness value than the threshold is allowed to participate in the crossover. For the system, not only do the chromosomes have to possess a Totalfit value higher than the threshold but also all the above mentioned flags should be set to 0 for them to qualify for the crossover. Being an NP- Complete problem there is a wide range of chromosomes that can be created but are undesirable and thus there is a need for this extra condition to be fulfilled in order to get meaningful output in less time. Thus, this additional measure helps to be assured that only good chromosomes are passed on to create next generation.
The crossover performed here is Two-Point crossover. The chromosomes are sorted in ascending order according to their Totalfit value and then crossover is performed between a chromosome and its immediately next chromosome. Since, crossover should be performed only within 3 furniture objects and the internal coordinates or alignment of each object should not be disturbed sub-ranges for Bed(B), Table(T), and Wardrobe(W) are each treated as separate blocks.
Before Crossover After Crossover
Fig.4.5: Before and after Crossover
As seen in fig.4.5, Two-Point crossover is done by replacing only the Table blocks between the two simultaneous chromosomes. The fitness value of these Child chromosomes is again calculated similarly and then selected ones are again sent for crossover, this process continues over a few generations. The child chromosomes of the last generation are expected to have good fitness values. These are the generated chromosomes that make up the result and are displayed to the user.
ISSN(Online): 2319-8753 ISSN (Print): 2347-6710
I
nternational
J
ournal of
I
nnovative
R
esearch in
S
cience,
E
ngineering and
T
echnology
(An ISO 3297: 2007 Certified Organization)
Website: www.ijirset.com
Vol. 6, Issue 4, April 2017
Element undergoing change in alignment = Element with max (difference (goal fitness value, current fitness value) = Max ((70-Wfit), (60-Bfit), (50-Tfit))
Fig.4.6: Before Mutation
In the fig.4.6, for instance, the difference between 50 - Tfit is maximum when compared to the other two differences, thus the alignment of Table is changed during Mutation. Thus, after mutation the chromosome changes to the fig.4.7.
Fig.4.7: After Mutation
The mutation does not guarantee that the resulting chromosome will have a fitness value greater than its previous value. Hence, the fitness value is again calculated. If the new fitness value is greater than the previous value only then the mutated chromosome is included in the result otherwise the previous un-mutated chromosome is part of the result.
V. ANALYSISANDRESEARCH
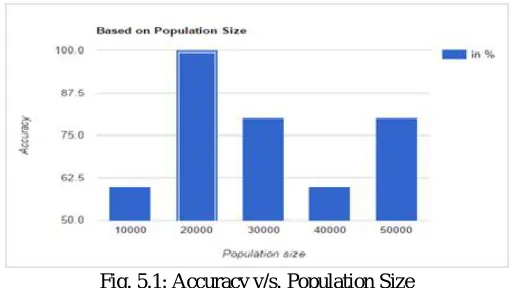
Analysis of the efficiency and accuracy of Genetic algorithm depends mostly on two factors: 1. Initial population size
2. Number of generations
Depending on the particular requirement, an optimum size has to be selected. When the values of accuracy for each population size were plotted on a graph as shown in fig. 5.1, it was observed that as the size of the initial population was 20,000 the system generated optimum results as compared to other sizes.
Fig. 5.1: Accuracy v/s. Population Size
In all the output images, Rectangle B represents Bed, Rectangle T represents Table and Rectangle W represents Wardrobe.
ISSN(Online): 2319-8753 ISSN (Print): 2347-6710
I
nternational
J
ournal of
I
nnovative
R
esearch in
S
cience,
E
ngineering and
T
echnology
(An ISO 3297: 2007 Certified Organization)
Website: www.ijirset.com
Vol. 6, Issue 4, April 2017
Fig. 5.2: Output with Population Size 20,000 Fig. 5.3: Output with Miscellaneous Population Size Comparably, the output for other population sizes is not as satisfactory. Though fig. 5.3 follows all the constraints of furniture arrangement applied to the system, the output generated is almost repetitive with hardly any appreciable difference in the results. Also, the Wardrobe is placed very near to if not in front of the window which is not very desirable.
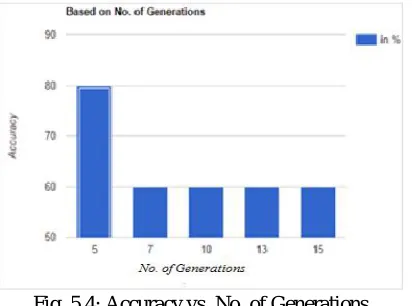
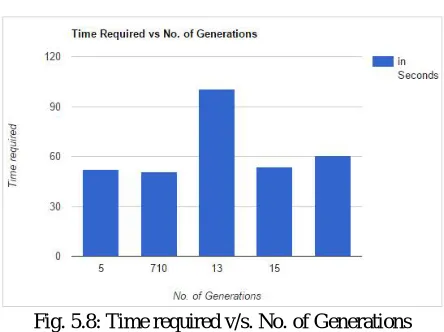
On varying the number of generations, we observed that best outputs were received for 5 generations. In genetic algorithm, if the system runs out of chromosomes mid-generation then the rest of the generations are useless computations. This can be proved by plotting a graph of number of generations v/s Accuracy achieved as shown in fig 5.4.
Fig. 5.4: Accuracy vs. No. of Generations
ISSN(Online): 2319-8753 ISSN (Print): 2347-6710
I
nternational
J
ournal of
I
nnovative
R
esearch in
S
cience,
E
ngineering and
T
echnology
(An ISO 3297: 2007 Certified Organization)
Website: www.ijirset.com
Vol. 6, Issue 4, April 2017
Fig. 5.5: Output with 5 Generations Fig. 5.6: Output Otherwise
For other no. of generations, the output arrangement is not very favorable as shown in fig 5.6. The Wardrobe is placed in the center of the room which is not desirable and hence not an optimal solution. Based upon above observations, for our system, the number of generations has been decided as 5, for an initial population size of 20,000.
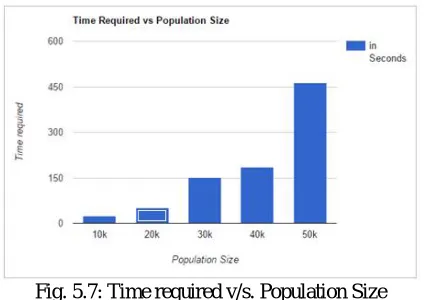
The relation of population size with time required is directly proportional. Upon varying the population size, the time required for the system to generate an output increases exponentially. The graph of time required vs. population size is as shown in fig 5.7. As the size of the initial population increases, the system has to deal with more genes, resulting in increased computations required for processing the genes and hence increase in the time required to generate output.
Fig. 5.7: Time required v/s. Population Size
ISSN(Online): 2319-8753 ISSN (Print): 2347-6710
I
nternational
J
ournal of
I
nnovative
R
esearch in
S
cience,
E
ngineering and
T
echnology
(An ISO 3297: 2007 Certified Organization)
Website: www.ijirset.com
Vol. 6, Issue 4, April 2017
Fig. 5.8: Time required v/s. No. of Generations
VI. CONCLUSION
The system uses genetic algorithm, a technique under the shade of artificial intelligence, to produce furniture layout plans for the user. It is an NP- complete problem and thus it grows with growth in the number of constraints and furniture elements. The proposed system aims at taking a step towards automation in planning of the room layouts. It requires basic input that includes size of the room followed by the position of doors and window from the any wall as per the user’s convenience. The input goes through the various constraints and functions of crossover and mutation to present the best possible outputs for the user. Also, this type of layout generations can be extended to include the scope of township planning, motion sensor placement in smart environments and in the generation of realistic indoor scenes in floor planning. Another extension possible is the generation of a 3D model of the layout suggested by the system to give a better understanding of it. The system developed is efficient and since it offers multiple solutions, it makes its existence more significant.
REFERENCES
[1] Jun H. Jo and John S. Gero, “Space Layout Planning using an Evolutionary Approach”, Artificial Intelligence in Engineering, Volume 12, Issue 3, pg. 149-162, July 1998
[2] Kristian Guillaumier, “Generic Chromosome Representation and Evaluation for Genetic Algorithms”, Proceedings of Computer Science Annual Workshop (CSAW ’03), pg. 64-67, November 2003
[3] MohdSaberi Mohammad, Safaai Deris, Safie Mat Yatim, Muhammad Razib Othman, “Feature Selection Method Using Genetic Algorithm for the Classification of Small and High Dimension Data”, First International Symposium on Information and Communications Technologies, October 2004
[4] Ryota Tachikawa and Yuko Osana, “Office Layout Support System using Genetic Algorithm– Generation of Room Arrangement Plans for Polygonal Space”, International Symposium on Nonlinear Theory and its Applications, September 2010
[5] Eugénio Rodrigues, Adélio Rodrigues Gaspar and Álvaro Gomes, “An evolutionary strategy enhanced with a local search technique for the space allocation problem in architecture, Part 1: Methodology”, Computer-Aided Design, Volume 45, Issue 5, pg. 898-910, May 2013 [6] Brian L.Thomas, Aaron S. Crandall and Diane J. Cook, “A Genetic Algorithm approach to motion sensor placement in smart environments”,
Journal of Reliable Intelligent Environments, Volume 2, Issue 1, pg. 3-16 , April 2016
ISSN(Online): 2319-8753 ISSN (Print): 2347-6710
I
nternational
J
ournal of
I
nnovative
R
esearch in
S
cience,
E
ngineering and
T
echnology
(An ISO 3297: 2007 Certified Organization)
Website: www.ijirset.com
Vol. 6, Issue 4, April 2017
BIOGRAPHY
Mitali Chavan B.E. (pursuing)
Ritika Kumar B.E. (pursuing)
Shivani Rana B.E. (pursuing)