Reduction of Maximum Power Demand using
Energy Audit-Case Study
A.Nabisha
1, S.Marshelinco
2Assistant Professor, Department of Electrical and Electronics Engineering, Loyola Institute of Technology and Science,
Thovalai, Tamilnadu, India1.
Associate Professor, Department of Electrical and Electronics Engineering, Loyola Institute of Technology and Science,
Thovalai, Tamilnadu, India2.
ABSTRACT: Energy management scenario is the foremost issue in various Industries in recent century. To ascertain the maximum power demand, of various loading areas by Energy audit. By means of energy audit process the power consumed by various equipment are analysed. Due to this process maximum power consuming equipment and power consuming areas are studied. This analyzation is prepared by comparing the electricity bill during the subsequent months. This elaborate study reveals efficient remedial act taken by the industries and institutions to reduce the usage of electricity. By introducing special equipment with the existing, the usage of electricity will get reduced. This paper is entirely discussed about various remedies for maximum power demand and installation of art of equipment.
KEYWORDS: Energy audit, Maximum power demand, load study, electricity bill, Load shedding, Institution.
I. INTRODUCTION
At present the world is running short of electricity. The majority of utility equipment depends on electrical energy. As per the need, the power is generated in so many ways. Massive amount of power is generated through various natural resources such as thermal, hydro, nuclear, geothermal, biogas etc. Due to long usage of resources the scarcity arises. To overcome the lack of resources, Renewable energy sources are playing key role. When the natural resources get exhausted the generation of electricity will jump down within this century. To conquer future crisis we have to create awareness between the consumers is vital. Reduction of maximum power demand which will lead to reduce the electricity usage. The electricity usage is calculated by an energy audit process. This paper briefly explains about the various steps involved in energy audit process as well as it gives the solution for reducing maximum power demand.[10]
II. INTRAMURAL INFLUENCE
Any academic institution is getting supply from the nearest substation to fulfil the need of various electrical utilities. The substation has various feeders which are connected with particular areas. Load demands of all feeders are not similar. The institution has various building blocks such as campus, hostel canteen and auditorium. An energy audit is conducted in various blocks of the institution to reduce the electricity bill effectively.
The energy manger, while proposing various courses of action and evaluating their consequences, requires a detailed information base to work from energy audit attempts to balance the total energy inputs with its use and serve to identify all the energy streams in the system and quantifies energy usages according to its discrete function
Energy audit is an effective tool in defining and pursuing comprehensive energy management programme. It has positive approach aiming at continuous improvement in energy utilization in contrast to financial audit which stresses to maintain regularity. Energy audit helps in energy cost optimization, pollution control, safety aspects and suggests the methods to improve the operating and maintenance practices of the system. It is instrumental in coping with the situation of variation in energy cost availability, reliability of energy supply, decision on appropriate energy mix, decision on using improved energy conservation equipment, instrumentations and technology. It has been established that energy savings of the order of 15 to 30% is possible by optimizing use of energy. Indian industry consumes more energy as compared to its counter parts in the developed countries.
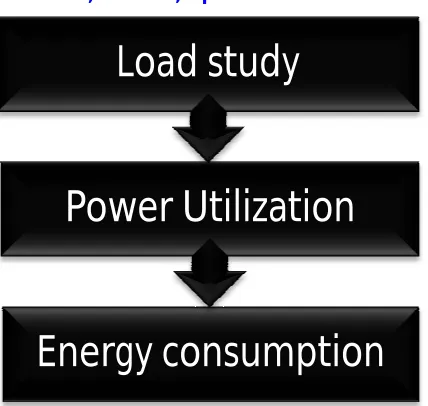
1.2 Energy Audit Steps
The energy audit processing steps as follows
Fig 1: Energy audit process steps
1.3 Pre data Collection
The antecedent stage for data compilation is drawing the civil structure of institutions and the latter stage is identifying various electrical utilities.
PRE-AUDIT DATA COLLECTION
(1)
AUDIT DETAILED MEASUREMENT
(2)
DATA ANALYSIS (3) SUGGETSIONS
Fig 2: Stages in data collection
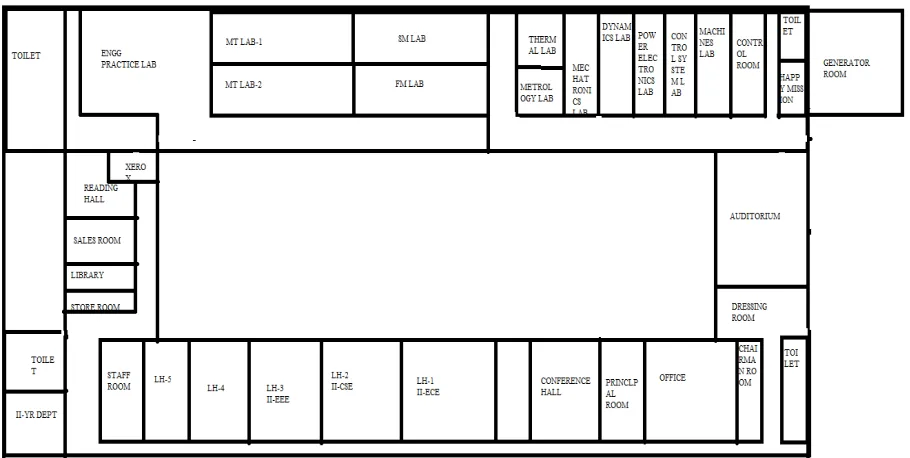
3.3.1. Civil Structure
Civil structure of all the building were groomed which gave an information about [8]
The relative location and outline of the building.
Labelling the rooms by either a name or number The example for civil structure shown in fig (3)
PRE -AUDIT PRACTICES
SITE SKETCH ELECTRICAL UTILITY
Keeping the civil structure as a reference, the count of each and every electrical equipment such as light, fan, computer systems, motors etc were taken based on the rooms .In addition to determining the quantity, their individual power rating was noted down. This data was gathered in order to calculate the maximum connected load present in the institution.
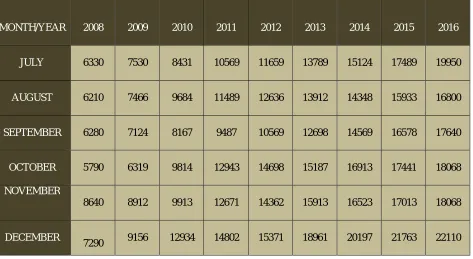
3.3.3 Acquisition of past electricity bill
The electricity usage was acquired from the electric bill register for the time period of six month from July to December [2]. The electricity used details for the year 2008 to 2016 was taken. It is shown in table (1)
Table 1: Energy consumption July to December
MONTH/YEAR 2008 2009 2010 2011 2012 2013 2014 2015 2016
JULY 6330 7530 8431 10569 11659 13789 15124 17489 19950
AUGUST 6210 7466 9684 11489 12636 13912 14348 15933 16800
SEPTEMBER 6280 7124 8167 9487 10569 12698 14569 16578 17640
OCTOBER 5790 6319 9814 12943 14698 15187 16913 17441 18068
NOVEMBER
8640 8912 9913 12671 14362 15913 16523 17013 18068
DECEMBER
7290 9156 12934 14802 15371 18961 20197 21763 22110
1.4 Audit Detailed Measurement
Based on the result of pre-audit, this type of energy audit consists of energy use survey in order to provide a comprehensive analysis of the studied installation, a more detailed analysis of the facility and a breakdown of the energy use to correct the defect or improve the existing installation. This level of analysis involves on-site measurements.
.
Fig 4: Audit detailed measurement phases
1.4.1Load study
As per the power rating gathered from each equipments, the total connected load was calculated which was the product of the ratings and quantity of equipments. The load calculation was taken for all connected load .and part of that is shown in the below table (2)
Table 2: Maximum connected load in each area
AREA MAXIMUM LOAD(W)
Computer lab
27100
Library
2300
Reading room
880
Auditorium
24012
Conference Hall
855
Administrative office
5875
3.4.2 Power Utilization and Energy Consumption
Energy consumption
Power Utilization
towards the source, which is normally considered as the generator.
In an electric power system, a load with a low power factor draws more current than a load with high power factor for the same amount of useful power transferred. The higher currents increase the energy lost in the distribution system, and require larger wires and other equipment. Because of the cost of larger equipment and wasted energy, electrical utilities will usually charge a higher cost to industrial or commercial customers where there is a low power factor. A high power factor is generally desirable in a transmission system to reduce transmission losses and improve voltage regulation at the load.
Different loads have varying power factor. If the power, voltage and current ratings were known, power factor was calculated. [10]
Then the power factor calculation is [7]
Single phase circuit
Power factor = | cos φ| = 1000 x P (KW) / (V (v) x I (A))
Three phase circuit
i. Calculation with line to line voltage
Power factor = | cos φ| = 1000 x P (KW) / (√3 V L-L (v) x I (A) )
ii. Calculation with line to neutral voltage
Power factor = | cos φ| = 1000 x P (KW) /(3x V L-N (v) x I (A) )
Power consumed calculation
DC equipment P (KW) = V (v) x I (A)
Where P – Power (W) V –Voltage (V) I – Current (I)
Single phase AC equipments P (W) = Power factor x V (v) x I (A)
Three phase AC circuits i. Line to Lone Voltage
P (W) = √3 Power factor x V L-L (v) x I (A)
ii. Line to Neutral Voltage
P (W) = 3 x Power factor x V L-N (v) x I (A)
Table 3: Power Consumption of Equipments
S.NO
EQUIPMENT
NAME QUANTITY MEASURED
CURRENT(A) ACTUAL VOLATG E (V) POWER FACTOR TOTAL (W) No.OF UNITS (Based on Working Hours) (kWh)
1 Fluorescent Lamp 6 0.1 230 0.58 73.08 14.616
2 Fan 9 0.2 230 0.65 245.7 49.14
3 Pedestal fan 2 0.1 230 0.543 23 2.3
4 Purifier 1 1.6 230 0.598 200.928 40.1856
5 Iron Box 1 4 230 0.966 811.44 10.143
6 Electric stove 1 5.6 230 0.915 1076.04 26.901
TOTAL 2430.2 143.2856
3.4.3 Energy Conservation Measures 3.4.3.1 Lighting Savings
Lighting loads constitutes a huge percentage of the loads, T12, T8 and T5 are conventionally named for tube lights where “12” is the thickest and “5” is the slimmest tube light. T12 were quite popular in the past. They were replaced with slimmer T8 version, which are the most popular and easily available product today. But T5 is the most efficient energy saving option that is available in the present market .T5 tube lights have a life of 4-5 years and come with 1-2 years replacement guarantee. They are 40% more efficient. The power ratings of different types of FTLs shown in table (4)
Table 4:Power ratings of different FTLs
FTL POWER RATINGS (WATTS)
T -12 40
T - 8 36
T - 5 25
3.4.3.2 Efficient Super Fans
Amount of units contributed by fan is a lot considering various areas in institutions where it is running continuously whole day. The rating of ceiling fan used is 60W as opposed to super fan whose rating is just 35W
3.4.3.3 Energy savings in computer.
This paper briefly explains about the various steps involved in energy audit process and also it is a detailed study about the reason for maximum load demand. Due to energy audit load calculation is done. Through the load study various power consuming area are identified. To rectify this maximum power demand various energy conservation measures are suggested. From the detailed energy audit as well as the energy saving measures the load demand and the energy consumption can be reduced close to 40%.
REFERENCES
[1] http://www.powermin.nic.in/distribution/energy_audit.htm [2] 6 month electricity bills of the institution.2016
[3] Ana MaríaRuz - Fundación Chile, Luis Hinojosa – POCH“ Good Practice Guide for ENERGY AUDITS” manual.2015
[4] Singh. H, Seera. M, Mohammad Idin M. A. “Electrical energy audit in a Malaysian university - a case study” Article in conference, Proc. IEEEIntl.2011
[5] Singh. H, Seera. M, Mohammad Idin M. A. “Electrical energy audit in a Malaysian university - a case study” Article in conference,ProcIEEEIntl.Conf. Power and Energy, Kota Kinabalu, pp. 616-619. 2012
[6] “Electrical measurement and control” manual by M.6.2016 [7] “Electrical Engineering “ B.L.Thereja ,2010
[8] Civil layout diagram of Institutions.