ABSTRACT
JENNY, RICHARD MATTHEW. Numerical Optimization and Experimental Validation of a Continuous Flow Point-of-Use UV-LED Disinfection Reactor using Computational Fluid Dynamics. (Under the direction of Joel J Ducoste.)
Ultraviolet light (UV) is becoming increasingly important as a drinking water disinfection process due to its ability to inactivate chlorine-resistant pathogens Cryptosporidium and Giardia. In addition, unlike chlorine, UV does not react with constituents in the water to form harmful by-products. For these reasons, mercury lamp UV light sources are seen as an effective alternative to traditional chemical disinfection processes. However, mercury UV light sources contain hazardous waste, have short operating lives, are fragile, and have limited design flexibility. UV Light Emitting Diodes (UV-LEDs) offer an alternative UV source that have the potential for long operating periods, are robust, do not contain any known hazardous waste, and offer added design flexibility. Computational Fluid Dynamics (CFD) modeling of UV reactor performance has been a significant approach to the
engineering of UV reactors in drinking water treatment. Yet, no research has been performed on the experimental and numerical modeling of a continuous flow UV-LED reactor. A
The small size and ability for UV-LEDs to emit a targeted monochromatic wavelength adds substantial design freedom when configuring a UV-LED reactor. However, the increased flexibility in design options will add a substantial level of complexity when developing a UV-LED reactor, particularly with regards to reactor shape, size, spatial orientation of light, and germicidal emission wavelength. Anticipating that LEDs are the future of UV
disinfection, new methods are needed for designing such reactors. In the design of UV-LED-based systems, CFD will need to be coupled with rigorous optimization programs to sort out all possible optimized configurations under defined design, operational, and cost constraints. In this research study, we will discuss the evaluation of this new design paradigm using the validated UV-LED disinfection reactor. ModeFrontier, a numerical optimization platform, was coupled with COMSOL Multi-physics, a CFD program, to generate an optimized UV-LED continuous flow reactor. ModeFrontier was set up to meet the provided objective functions by varying the placement of UV-LEDs, the number of active lights, and the wavelength of light (260 nm or 275 nm). Two optimality conditions were considered: 1) multi-objective analysis and generation of the Pareto front (maximizing the log10 inactivation and minimizing the supply power); 2) minimizing the input supply power by achieving at least (2.0) log10 inactivation of E. coli ATCC 11229. All optimality tests were completed at a flow rate of 109 mL/min and 92% UVT. The numerical solution from the second objective was validated experimentally using biodosimetry. In general, the optimal UV-LED
Numerical Optimization and Experimental Validation of a Continuous Flow Point-of-Use UV-LED Disinfection Reactor using Computational Fluid Dynamics
by
Richard Matthew Jenny
A thesis submitted to the Graduate Faculty of North Carolina State University
in partial fulfillment of the requirements for the Degree of
Master of Science
Civil Engineering
Raleigh, North Carolina
2014
APPROVED BY:
_________________________ _________________________
Otto D. Simmons III, PhD Francis de los Reyes III, PhD
ii
DEDICATION
To Ruth, I love you.
To my mother and father,
Thank you for always being loving and supportive in every way imaginable.
To my brothers and sisters, Thank you for being a great example And for giving me a hard time about everything
Literally Everything.
“Whatever you do, work at it with all your heart, as working for the Lord, not for human masters, since you know that you will receive an inheritance from the Lord as a reward. It is
the Lord Christ you are serving.” Colossians 3:23-24
iii BIOGRAPHY
iv
ACKNOWLEDGEMENTS
I would like to thank the following people for helping and supporting me as I completed this degree:
Dr. Joel Ducoste: Thank you for the constant encouragement, advice, and for allowing me to work and learn from you during the past two years. You are a great teacher.
Dr. Chip Simmons: Thank you for sharing your knowledge on biological assay methods, providing samples, editing our reports, and encouraging me throughout this process.
Micah N. Jasper and Mehrnoosh Eslamiamirabadi: Thank you for the significant support you provided on this project.
Dr. Detlef Knappe and Dr. Francis de los Reyes III: I am grateful and fortunate to learn from you. Thank you for sharing your knowledge with all of us.
National Science Foundation: Thank you for the financial support.
Mann Hall Basement (Room 108) and Broughton Lab: Thank you for sheltering me from sunlight and society for the past two years.
v
TABLE OF CONTENTS
LIST OF TABLES ... viii
LIST OF FIGURES ... ix
1 INTRODUCTION ... 1
2 BACKGROUND ... 2
2.1 EFFECTIVE WAVELENGTHS FOR UV DISINFECTION ... 2
2.2 UV LIGHT SOURCES ... 3
2.3 BENEFITS OF UV-LEDS ... 4
2.4 CURRENT UV-LED POWER EFFICIENCY ... 5
2.5 CHALLENGE MICROORGANISMS ... 6
2.6 UV-LED BIODOSIMETRY RESEARCH ... 7
2.7 UV DISINFECTION: CFD MODELING RESEARCH ... 13
3 METHODS ... 17
3.1 HYDRAULIC CHARACTERIZATION ... 17
3.2 FLUENCE RATE CHARACTERIZATION ... 18
3.3 MICROBIAL INACTIVATION CHARACTERIZATION ... 21
3.4 MICROBIAL ASSAY PROCEDURES ... 23
3.5 UV DOSE DISTRIBUTION CHARACTERIZATION ... 26
3.6 REACTOR CONSTRUCTION ... 27
3.7 NUMERICAL SIMULATIONS ... 28
3.8 OPTIMIZATION ROUTINE ... 30
4 JOURNAL ARTICLE NO. 1 (CHEMICAL ENGINEERING SCIENCE) ... 32
5 INTRODUCTION ... 34
6 METHODS ... 37
vi
6.2 FLUENCE RATE CHARACTERIZATION ... 37
6.3 MICROBIAL INACTIVATION CHARACTERIZATION ... 40
6.4 UV DOSE DISTRIBUTION CHARACTERIZATION ... 43
6.5 REACTOR CONSTRUCTION ... 43
6.6 NUMERICAL SIMULATIONS ... 45
7 RESULTS ... 47
7.1 HYDRAULIC RESULTS ... 47
7.2 FLUENCE RATE RESULTS: CHEMICAL ACTINOMETRY ... 57
7.3 MICROBIAL INACTIVATION: BIODOSIMETRY ... 61
7.4 UV DOSE DISTRIBUTION ... 64
8 CONCLUSIONS... 66
9 JOURNAL ARTICLE NO. 2 (SUBMITTED TO WATER RESEARCH) ... 67
10 INTRODUCTION ... 69
11 METHODS ... 72
11.1 REACTOR CONSTRUCITON ... 72
11.2 NUMERICAL SIMULATIONS ... 73
11.3 UV DOSE DISTRIBUITON CHARACTERIZATION ... 76
11.4 MICROBIAL INACTIVATION CHARACTERIZATION ... 76
11.5 OPTIMIZATION ROUTINE ... 80
12 RESULTS ... 81
12.1 BACTERIOPHAGE KINETIC RESPONSE ... 81
12.2 BIODOSIMETRY: BACTERIOPHAGE Qβ ... 82
12.3 DOSE DISTRIBUTION DATA ... 84
12.4 ALTERNATING WAVELENGTH EXPERIMENTS: BIODOSIMETRY ... 88
12.5 E. COLI ATCC 11229 KINETIC RESPONSE ... 90
12.6 BIODOSIMETERY: E. COLI ATCC 11229 ... 94
12.7 OPTIMIZED UV-LED REACTOR ... 95
vii
14 FUTURE WORK ... 108
15 ACKNOWLEDGEMENTS ... 109
16 BIBILIOGRAPHY (BACKGROUND)... 109
17 BIBLIOGRAPHY (JOURNAL ARTICLE NO. 1) ... 113
18 BIBLIOGRAPHY (JOURNAL ARTICLE NO. 2) ... 115
19 APPENDIX ... 118
19.1 APPENDIX A - Ingredients for Broth, Agar, and Solutions ... 119
19.2 APPENDIX B - Preparing the Collimated Beam for Testing ... 120
19.3 APPENDIX C - UV COLLIMATED BEAM BATCH SYSTEMS ... 121
19.4 APPENDIX D - Preparing the Continuous flow UV-LED Reactor for Testing .... 124
19.5 APPENDIX E - Lowering Solution UVT ... 127
19.6 APPENDIX F – Sample Petri Dishes ... 128
viii
LIST OF TABLES
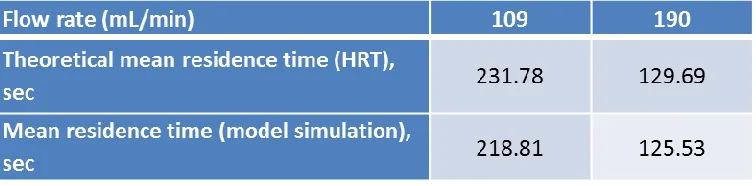
Table 1. Microorganism Specifications ... 26 Table 2. Comparison between experimental and theoretical residence time ... 48 Table 3. Comparison between numerical and theoretical residence time ... 57 Table 4. Model and experimental comparison of triiodide formation at different operating conditions ... 61 Table 5. Super-Hume requirement to achieve different UV transmittance values; for
ix
LIST OF FIGURES
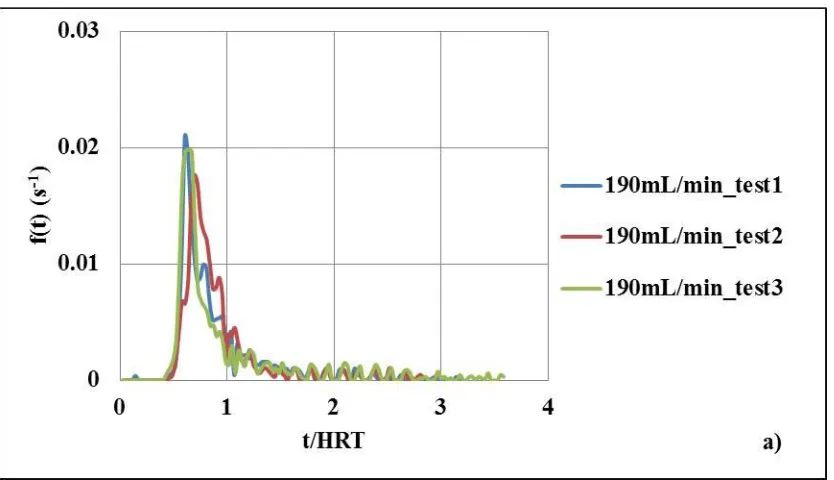
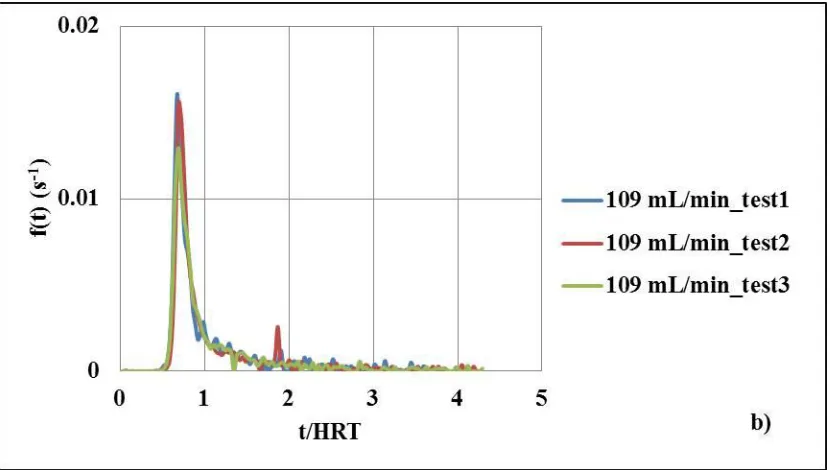
Figure 3.1. Reactor body ... 28 Figure 6.1. a) Reactor body; b) Internal reactor volume... 45 Figure 7.1. Residence Time Density (RTD) curve for a) 190 mL/min flow rate b) 109
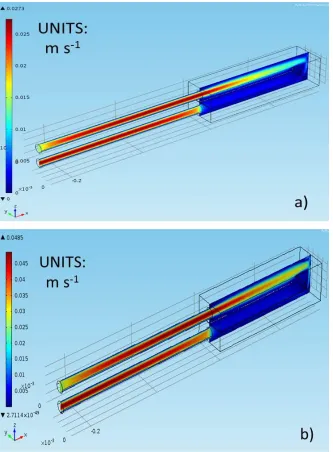
mL/min flow rate. ... 49 Figure 7.2. Velocity field profile for a) 109 mL/min flow rate b) 190 mL/min flow rate ... 51 Figure 7.3. Comparison between simulation and experimental residence time density
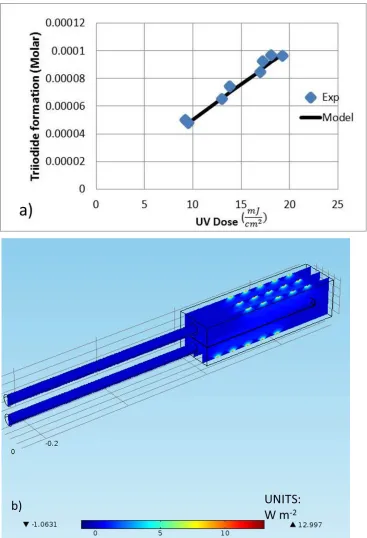
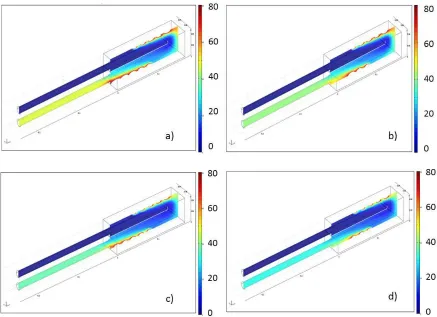
functions at (a) 109 mL/min and (b) 190 mL/min. ... 53 Figure 7.4. Analyzing the location of dispersion within the reactor at the 109 mL/min flow condition ... 56 Figure 7.5. a) Goodness of fit curve with reaction constant k2; b) Predicted UV LED light distribution with 30 260 nm UV LEDs activated. ... 58 Figure 7.6. Triiodide formation at various operating conditions ; a) 30 LEDs operating at 109 mL/min. b) 25 LEDs at 109 mL/min. c) 30 LEDs at 190 mL/min. d) 25 LEDs at 190 mL/min. ... 60 Figure 7.7. Kinetics curve of MS-2 and Qβ; comparison of response to 260nm LEDs and 254nm LP lamps. ... 62 Figure 7.8. Comparison of experimental results and numerical simulations for log
x
LEDs on the effluent (260E) side of the reactor. Average dose 260I: 3.5 mJ cm-2. Average dose 260E: 5.7 mJ cm-2. ... 86 Figure 12.4. CFD predicted velocity profile at 109 mL/min flow rate. The influent hydraulic jet results in a shorter average fluid space time on the influent side of the reactor in relation to the effluent side. ... 87 Figure 12.5. Alternating Wavelength Experiments. Compares 15 UV-LEDs of a common wavelength on one side of the reactor, and 15 UV-LEDs of the other wavelength on the opposing reactor side, for a given operating condition. The light configuration was then flipped. 109 mL/min flow rate, 92% UVT. Experiment involved Qβ phage. ... 89 Figure 12.6. Kinetic response of E. coli ATCC 11229 to three UV light sources: 260 nm UV-LEDs, 275 nm UV-UV-LEDs, 254 nm LP lamp. ... 91 Figure 12.7. Use of series-event model to mathematically capture the rate of microbial
1
1
INTRODUCTION
Ultraviolet light (UV) has become an important drinking water treatment process for microbial disinfection due to many of its distinct advantages over traditional chemical processes. UV light is capable of inactivating chlorine resistant protozoa Cryptosporidium and Giardia. These waterborne pathogens are regulated federally by the EPA and can significantly impact public health. Although chemical disinfection is efficient at inactivating algae, viruses, and bacteria, Cryptosporidium and Giardia form cysts that provide protection from traditional disinfectants such as chlorine and ozone (Cho et al., 2010). In addition, UV light is not known to produce disinfection by-products (DBP), does not lead to the production of taste/odor compounds, and over-dosing will not compromise public health (Chatterley et al., 2010). Traditional UV light sources employ mercury-based lamps; however, mercury is a hazardous waste, and if lamps are broken during maintenance, installment, or from foreign-object collision, plant personnel may be exposed, and/or the waste may enter the drinking water supply (USEPA, 2006). In addition, the United Nations Environment Program (UNEP) has signed an agreement to significantly limit the mining and usage of mercury by the year 2020 (UNEP, 2013). The agreement will significantly affect the manufacturing of all
products that contain mercury, including UV lamps. UV Light Emitting Diodes (UV-LEDs) can potentially be an alternative UV light source; one which does not contain toxic mercury, can offer increased design flexibility due to their small size, are robust, have potential lifetimes of 100,000 hours, and require little input power (Chatterley et al., 2010). For these reasons, UV-LEDs are seen as a potential replacement of traditional mercury lamp UV light sources for drinking water disinfection processes.
2
simultaneously participate within a UV disinfecting reactor. Therefore, a CFD model was generated to predict the flow field, light distribution, and microbial inactivation within a continuous flow UV-LED reactor. To validate the initial results from the numerical model, experimental testing was completed using salt tracer tests (hydraulics), iodide/iodate
chemical actinometry (average light fluence), and biodosimetry (microbial inactivation). The results from the first study showed that, for a given set of operating conditions the model was accurate in predicting the physics through the reactor. Numerical optimization was performed by coupling commercial software (ModeFrontier), with commercial CFD software
(COMSOL Multiphysics), following completion of the initial validation. The optimization routine was designed to vary the placement, number, and wavelength of activated UV-LEDs in the system. The numerical optimization results were then experimentally validated using biodosimetry.
2
BACKGROUND
2.1
EFFECTIVE WAVELENGTHS FOR UV DISINFECTION3
Microbial inactivation from UV-C light at doses typical for water treatment processes (~40 mJ cm-2) can occur in one of three ways: pyrimidine dimer formation, pyrimidine (6-4) pyrimidone photoproducts, and protein-DNA cross-links (USEPA, 2006). However, of these three possibilities, the most common pathway is pyrimidine dimer formation. In this case, covalent bonds form between adjacent pyrimidine bases on the same DNA or RNA strand. Thymine-thymine dimers are more common to form than any other pyrimidine combination (USEPA, 2006). The dimer formation prevents the organism from reproducing and will eventually result in microbial inactivation (USEPA, 2006). For the remainder of the document, the term ‘UV-C’ will more simply be referred to as ‘UV’.
2.2 UV LIGHT SOURCES
Currently, the majority of UV light technologies used in drinking water treatment are generated by mercury lamps. The three most common mercury-based UV sources are low-pressure (LP), low-low-pressure high output (LPHO), and medium-low-pressure (MP) lamps. UV lamps operate by supplying a voltage across a gas mixture (typically mercury vapor), which results in a discharge of light energy. The wavelength of light emitted is a function of the number of mercury atoms, which is related to the mercury vapor pressure within the lamp (USEPA, 2006). LP and LPHO lamps operate at 1.35*10-4 and 2.3*10-4 pounds per square inch (psi) of pressure, respectively. These lamps function at a temperature of 40˚C (LP) or 80˚C (LPHO), and both emit monochromatic light at 253.7 nm. Conversely, MP lamps emit polychromatic UV light (200-400 nm) and operate at much higher temperatures (600-900˚C), pressures (2-200 psi), and intensity than LP and LPHO lamps (USEPA, 2006). Most
4
Recent technological advances have led to the development of LEDs, around 5 mm in diameter, to generate light in the germicidal range (Bettles et al., 2007; Chatterley et al., 2010; Bowker et al., 2012). LEDs generate light via electroluminescence; where light is created as a result of an electric current formation. In the most basic sense, LEDs are manufactured by forming minor impurities in the surface of two semiconductors and forming a junction between them. One of the semiconductors is known as the p-side, which stands for “positive-side”; while the other is referred to as the n-side, or “negative-side”. The p-side is referred to as “positive” because during the doping process, electron holes are generated, which results in partially unfilled valence orbital’s and an electron deficit in the solid (Casiday et al., 2007). When a voltage is supplied to the system, electrons travel from the n-side semiconductor to the p-n junction. It is here where electrons can occupy the available space from the doped p-side semiconductor. However, in order for the electron to enter the valence orbital of the p-type semiconductor, energy must be released for the system to stabilize (Casiday et al., 2007). The released energy is in the form of light photons, where its wavelength is a function of the band gap between the semiconductor materials (Casiday et al., 2007). Light in the UV-C and UV-B range are currently generated by gallium nitride (GaN) and aluminum nitride (AlN) semiconductors (Bowker et al., 2012).
2.3 BENEFITS OF UV-LEDS
5
(USEPA, 2006). Replacement and disposal of hazardous LP lamps can be especially difficult in developing countries, where energy-saving point-of-use (POU) disinfection processes are desired. In these rural and undeveloped regions, it is critical to implement systems that provide energy savings, long light replacement intervals, and components that are safe to handle and dispose. UV-LEDs provide these benefits, as they have been recognized as a system that saves energy (input power is in range of mW), lowers maintenance cost, lengthens replacement intervals, and are non-toxic (Chatterley et al., 2010). In addition, UV-LEDs are robust, durable in transit and handling, easily reconfigurable, and require less auxiliary electronics than mercury UV lamps (Chatterley et al., 2010). For all these reasons, UV-LEDs have the potential to replace fluorescent lamps for point-of-use drinking water disinfection systems in developing countries.
2.4 CURRENT UV-LED POWER EFFICIENCY
The use of UV-LEDs in commercial products is currently hindered because of their low wall plug efficiency and inability to emit light at high output power (Bowker et al., 2012). UV-LEDs function at 0.5-2% efficiency, which is largely a result of semiconductor material and the inefficient extraction of light through the sapphire substrate (Shur et al., 2008; Bowker et al., 2012). Most germicidal UV-LEDs are suggested to operate at 20 mA of current, and are capable of producing less than 1 mW of radiant power; by comparison, LP UV lamps emit 0.2 W/cm (Bowker et al., 2012). Increasing the current through the UV-LED can generate increased light intensity, but this will degrade the operating duration to below the expected lifetime of 1000 hours with the materials used today.
6
at relatively higher optical power (275 nm), but low germicidal efficiency, while the other was chosen because of its larger germicidal efficiency (260 nm), but low power output. Thus, the optimization routine was designed to delineate between the 260 nm UV-LEDS, 275 nm UV-LEDs, or some combination of the two, in the small-scale UV reactor.
2.5 CHALLENGE MICROORGANISMS
Large-scale validation of UV reactors has traditionally involved the use of challenge microorganisms, such as Bacillus subtilis spores, that may serve as surrogates for parasitic organisms of public health, such as Cryptosporidium parvum. Coliphage MS-2 is another commonly used challenge microorganism that may serve as a surrogate for viral pathogens, such as adenoviruses (Hijnen et al., 2006). MS-2 is a single stranded RNA virus known for its relatively high resistance toward germicidal UV light. Although MS-2 is a commonly used testing surrogate for Cryptosporidium and viruses of public health importance, its inactivation rate is much slower than that of the target pathogens, and therefore may not be an ideal representation of the frank pathogens of interest (Fallon et al., 2007). The large fluence response deviation between target and challenge microorganism, along with the non-ideal nature of reactor hydraulics and light distribution, will lead to variability and
uncertainty in UV disinfection process performance under site specific conditions (Hijnen et al., 2006). To mitigate these uncertainties, the US EPA (2006) has required the use of
Reduction Equivalent Fluence (REF) bias factors when large-scale UV reactors are validated prior to operation (Fallon et al., 2007). The bias factors are used as a safe guard to obtain a more conservative estimate of the average dose a UV reactor can produce, for a given set of operating conditions. A viable option to reduce the REF bias factor and obtain more
7
Therefore, the present research validated the small-scale UV-LED reactor with the traditionally-used coliphage MS-2, along with the more UV sensitive coliphage, Qβ.
Due to the small output power that currently plagues UV-LED light sources, it was also necessary to experiment with an even less resistant microorganism than Qβ. In this study, a third microorganism was selected, capable of achieving up to 4.0 log10 inactivation when operating the reactor under low flow, high UV transmittance conditions, with all UV-LEDs activated. By achieving a high log10 inactivation (~4.0), the research was able to explore UV-LED reactor designs (varying UV-UV-LED placement, number, and wavelength of light) while still maintaining a measurable log inactivation below 4.0. For this reason, E. coli strain ATCC 11229, a commonly tested surrogate for UV disinfection studies, was chosen as a non-pathogenic challenge microorganism, meant to display the proof-of-concept model for an optimized UV-LED continuous flow disinfecting device.
2.6 UV-LED BIODOSIMETRY RESEARCH
UV-LED disinfection research is growing, particularly with respect to biological studies. Hamamoto et al., (2007) developed a new UV-LED device incorporating 8 LEDs of 365 nm wavelength. The samples were tested by light in the UV-A (320-400 nm) range at high power outputs (315-672 J/cm2) for long exposure times (15-160 minutes). The research focused on the primary inactivation method of various bacterial strains in the UV-A range. Results showed oxidative damage on the cellular DNA stemming from superoxide anion radicals, hydroxyl radicals, and hydrogen peroxide. The damage was compared to pyrimidine dimer formation typically found with bacteria exposed to light in the UV-C range (200-280nm). Although the device was effective at reducing certain bacterial strains between 4 to 5 log, the dose required and exposure times are too high to be economically feasible.
Mori et al., (2007) measured the efficacy of a UV-A LED device primarily for the
8
system. Each LED device consisted of eight lights aligned in series, and exposed the bacterial samples for either 15 or 30 minutes. The results showed that the 405 nm LED system was unable to inactivate E. coli DH5α, while the 365 nm device behaved similar to the 254 nm lamp (3.0-3.5 log inactivation) at an exposure time of 30 minutes. However, the UV dose from the 365 nm device was 27,000 mJ cm-2; by comparison, a large-scale flow-through UV reactor typically operates at approximately 40 mJ cm-2. Conversely, with 15 minutes of exposure time, the 254 nm lamp was significantly more efficient than the 365 nm LEDs. The literature did not report the reasoning for this deviation; however, it is suspected that 15 minutes of exposure was not sufficient for the LEDs to generate highly reactive species, such as hydroxyl radicals and superoxide anions, in order to oxidize components along the cell wall or internally within the cell. Further research should be completed to understand the applicability of using UV-A light in continuous flow reactors.
Vilhunen et al., (2009) examined the inactivation potential of E. coli K12 through two
separate UV-LED batch reactors; each equipped with 10 LEDs of either 269 nm or 276 nm
wavelengths. The samples were exposed to the individual wavelengths in 5 minute
increments, from 0 to 20 minutes, in three different background fluid conditions: ultra-pure
water; nutrients and water; or nutrients, humic acid, and water. The study found that the
background fluid conditions had a minor impact on the viable cell concentrations, which is
intuitive. Lowering the solution UV transmittance (nutrients or nutrients and humic acid
addition) decreased the log inactivation in the batch system, particularly under long exposure
times (15-20 minutes). In addition, for a given operating condition, the 276 nm LEDs slightly
outperformed the 269 nm LEDs, even though the former emits nearly two times the output
power than the latter. The greater efficiency from the 269 nm LEDs is attributed to the higher
9
Chatterley et al., (2010) built a proof-of-concept UV-LED reactor using 265 nm LEDs, and compared the inactivation kinetics of E. coli K12 to a low pressure mercury lamp. The collimated beam design consisted of 3 LEDs, while the flow-through reactor contained one row of 10 LEDs, placed one millimeter above the water surface. Chatterley et al., (2010) showed no significant difference between the mercury lamp and the UV-LED batch system when comparing samples at doses less than 20 mJ cm-2. The continuous flow UV-LED reactor was able to achieve an average dose of 10 mJ cm-2 at 88% UVT with a 14 mL/min flow rate (dose was determined by a conventional biodosimetry method). Chatterley et al., (2010) suggests that up-scaling the number of LEDs within the reactor to 40 total LEDs would likely result in an average dose of 40 mJ cm-2 for the given flow rate and UVT, which is typical for a full scale UV reactor system. The research did not optimize the placement of LEDs, nor did it evaluate alternative UV-LED wavelengths. In addition, the low flow conditions imposed in this study may not be feasible for use in a developing country.
Gaska et al., (2011) designed a point-of-use (POU) 4 LED flow through device using one
wavelength of 273 nm. The reactor was 3 inches in diameter and 6 inches long, and operated
at 0.5, 1, or 2 liters per minute. The research varied the amperage to each LED, ranging from
100-500 mA, and analyzed the impact the system had on E. coli ATCC 11303 and
Enterococcus ATCC 10541. The device was capable of achieving 6 log10 inactivation of E.
coli at 0.5 L/min and 14 W of input power. In addition, the study showed that for both
microorganisms, log inactivation decreased with increasing flow rate and decreasing input
power, both of which are expected. The literature suggests a continual optimization
technique was performed to improve the reactor efficacy; however, details of this
optimization were not included. A numerical modeling approach was not implemented to characterize the hydraulics, fluence distribution, or the biodosimetry within the reactor. For this reason, the results of this study may not be considered optimum. In addition, the lowest amperage used per LED in the Gaska et al., (2011) research (100 mA) was 5 times greater
10
Bowker et al., (2011) designed a novel UV-LED collimated beam apparatus using CFD. The
numerical model was designed to minimize total cost, subject to LED spacing and target
wavelength constraints (255 nm or 275 nm; operated independently), and varying the light
travel distance from the LEDs to the sample surface area. The 255 nm collimated beam was
designed with 8 LEDs, while the 275 nm collimated beam incorporated 4 LEDs, as the 275
nm lights emitted nearly twice the output power of the 255 nm lights. Following construction
of the optimized collimated beam, numerical results were validated by experimentally
determining the Petri factor (Bolton et al., 2003), and irradiance along the sample surface.
Microbial response kinetic curves of two coliphages, MS-2 and T7, and one bacteria, E. coli
ATCC 11229, were generated at 255 nm and 275 nm UV-LED wavelengths, and compared
to the kinetics of a traditional 254 nm mercury lamp. The shape of the kinetic curve for E.
coli (shouldering phenomenon at low UV dose followed by log linearity) was consistent
among the three light sources; however, the 254 nm lamp was significantly more effective
than the 275 nm LEDs, which in turn was more efficient than the 255 nm LEDs. This result
was unexpected, as the 254 nm and 255 nm emit similar wavelengths. The discrepancy was
attributed to a possible deviation from the intensity time reciprocity rule. Bowker et al.,
(2011) hypothesized that the low output power of the 255 nm LEDs (0.3 mW) was not
significant enough to effectively inactivate the bacteria (even under increased exposure
times), and there was potentially photo-reactivation activity present within the
microorganisms. It was also hypothesized that the 275 nm LEDs outperformed the 255 nm
LEDs (in regards to the E. coli) by disrupting protein functions within the cell (which absorbs
UV near 280 nm). With regards to MS-2, the study found greater log inactivation with the
254 nm lamp in comparison to both LED wavelengths; however, the deviation was not
significant, as all wavelengths inactivated the coliphage within the upper and lower limits as
suggested by the US EPA UV Disinfection Guidance Manual (2006). Coliphage T7 found
comparable results to all light sources as well, with slightly higher log inactivation to 275 nm
11
nm for T7. Overall, the study suggested LEDs have the potential to be used as a point-of-use
disinfection application.
Würtele et al., (2011) constructed batch and continuous flow reactors to measure the applicability of UV-C LEDs for disinfecting Bacillussubtilis spores. The batch system was
unconventional, with the LEDs arranged to irradiate from below the sample, as opposed to
being placed above, as in a collimated beam apparatus. This alternative placement of
UV-LEDs was done to compensate for the low power output of UV-UV-LEDs and to more uniformly
distribute the irradiance throughout the sample. The constructed batch reactor was validated
by comparing the results to that of a traditional mercury-based collimated beam apparatus.
The research found a significantly more sensitive inactivation response to the 282 nm LEDs
in comparison to the 254 nm mercury lamp. Chen et al., (2009) had reported similar response
kinetics of B. subtilis when comparing the effects of a 279 nm and 254 nm mercury-based
UV source. The deviation from the Chen et al., (2009) research was explained by the
modified batch structure used in the study. Although the constructed system resulted in data
that was inconsistent with the literature, the test set up system did generate consistent data.
Additional results suggest that the rate of inactivation for the B. subtilis spores is slightly
greater when exposed to 269 nm LEDs in comparison to 282 nm LEDs; which was attributed
to a peak DNA absorbance near 269 nm. However, the 282 nm LEDs emit nearly twice the
output power in comparison to the 269 nm LEDs, which resulted in the overall efficiency
being tilted in the favor of the higher wavelength light. For this reason, the continuous flow
reactor incorporated the 282 nm LEDs. Experimental tests quantified the log inactivation of
the spores through the continuous flow reactor at multiple operating conditions. These
conditions were achieved by varying the flow rate and LED power output, and recording the
log inactivation for a given average fluence. The reactor was capable of achieving 3 log10
inactivation of Bacillussubtilis spores with an average fluence of 45 mJ cm-2. Numerical
techniques were not used to characterize the distribution of fluence within the reactor, or to
12
Chevermont et al., (2012) used a multivariate approach to understand the factors influencing
the inactivation potential of three E. coli and two Enterococcus faecalis strains in a UV-LED
batch system. The research analyzed the effect pH (6 or 8), microbial density (105 cfu mL-1
or 107 cfu mL-1), wavelength (254 nm, 280 nm, 365 nm, 405 nm), and exposure time (60,
120, 180 seconds) had on the inactivation of E. coli strains ATCC 11303, ATCC 15597, CIP
6224, and E. faecalis strains ATCC 194333 and ATCC 33186. A batch reactor was set up to
expose a microbial sample to one UV-LED or a coupled system of one UV-C LED and one
UV-A LED. An initial screening study was performed and found that pH only had an effect
on one E. faecalis strain, and density affected one strain of each bacterium. Conversely, the
turbidity of the sample influenced the inactivation of all the strains tested, as did a change in
wavelength. Exposure time only influenced the inactivation rate of the E. coli strains.
Additional research focused on the statistical significance of using individual and/or coupled
wavelengths with varying exposure times (10, 20, 30 seconds), on inactivating each strain.
Microbial density and pH were omitted from this analysis as both of these factors are not
commonly modified in full scale applications. Results showed a range in UV response
sensitivity for the different microorganisms. For example, E. coli ATCC 11303 underwent 7
log inactivation within 30 seconds of exposure to either 280 nm, 280/365 nm, 280/405 nm or
254/365 nm LEDs, while E. coli ATCC 15597 only resulted in a maximum of 0.4 log
inactivation after 30 seconds of exposure to one 280 nm LED. Similar results were found for
E. faecalis, but no discussion was made explaining the inactivation discrepancy among E.
coli and E. faecalis strains. Overall, the study found the most effective LED design was a
coupled configuration (280/365, 280/405, or 254/365). The explanation as to why the
coupled wavelengths were more efficient was incomplete, as the authors failed to mention
the germicidal efficiency of the UV-C light in comparison to the UV-A light sources.
Furthermore, additional research should be done on optimizing a batch or continuous flow
13
Oguma et al., (2013) constructed a batch and continuous flow reactor and measured the
effectiveness of 265 nm, 280 nm, and 310 nm LEDs on the inactivation of E. coli K12. The
batch reactor consisted of a 3 x 3 array of LEDs, while the flow-through reactor had 30
available locations for LEDs. At the center of the continuous flow device was a triangularly
shaped prism used for housing the LEDs. On each face of the prism there was a column of 10
LEDs of one wavelength; this set up allowed the irradiance to project outward from the
center of the reactor. Surrounding the LED housing was a cylindrical quartz sleeve for
protective purposes, and an open channel for fluid flow. Water was cycled through the
reactor to achieve desired (average) fluence values at a flow rate of 385 mL/min. The study
analyzed the log inactivation by varying the light exposure time for all three wavelengths, in
both the batch and continuous flow reactor. The 280 nm LEDs were the most “time-efficient” wavelength, followed by the 265 nm and 310 nm lights. In other words, for a
given exposure time, the 280 nm was able to achieve a greater log inactivation than the other
two wavelengths. The results can be partly attributed to the higher power output of 280 nm
LEDs (in comparison to the 265nm source). Conversely, the 265 nm LEDs were most ideal
at achieving the highest log inactivation for a given fluence value, followed by the 280 nm
and 310 nm LEDs. The results can be accredited to the higher germicidal efficiency of the
265 nm LEDs. Overall, the 310 nm LEDs were ineffective at inactivating E. coli K12.
Further analysis should be completed to better understand the effects of using two
complementary wavelengths of light in a continuous flow reactor.
2.7 UV DISINFECTION: CFD MODELING RESEARCH
14
mixing behavior of fluid inside a reactor (Wols et al., 2010). Chemical actinometry can help characterize the average irradiance produced by the reactor at various operating conditions (flow rate, water transmittance, and lamp power output). For a given set of reactor operating conditions, the hydraulics and irradiance distribution can provide information on the UV dose distribution, which is necessary to predict the microbial inactivation of any pathogenic microorganism (for which a dose-response kinetics model has been generated) (Blatchley et al., 2008). The following review will shed light on the research that has helped to
characterize the physics inside a UV disinfection chamber using CFD.
Downey et al., (1998) validated the hydraulics of a UV (mercury lamp) reactor using CFD to
better understand the hydraulic efficiency within a small-scale UV reactor. The CFD model
was validated using salt tracer experiments at four flow rates, ranging from 3.79 L min-1 to
15.14 L min-1. Downey et al., (1998) found good agreement between the numerical
simulations and experimental results at the low flow rate, while the model slightly under
predicted the residence times at the higher flow rate.
Ducoste et al., (2005) examined the applicability of the Eulerian approach and Lagrangian
particle tracking approach to determine the fluence distribution through low pressure and
medium pressure UV reactors using CFD. The fluence distribution was combined with
knowledge of the microbial inactivation kinetics of Bacillus subtilis spores and bacteriophage
MS-2 to determine the log inactivation through a UV reactor. Bioassay tests, using the
aforementioned microorganisms, validated the numerical predictions from the dose
distribution model. Overall, the research found good agreement with respect to fluence
distribution between the Lagrangian and Eulerian method, assuming the correct effluent
plane is chosen when implementing the Eulerian method. In addition, reasonable agreement
15
Bohrerova et al., (2005) designed an experiment to better understand the dose distribution
through a continuous flow mercury lamp UV reactor. The study used a CFD model to predict
the fluence distribution in a UV reactor, and compared the numerical solutions
to experimental tests based on fluorescent microspheres traveling through the reactor. The
study was completed at two flow rates, 3 gallons per minute (GPM) and 7.5 GPM; overall,
the CFD model over-predicted the average dose within the reactor. The dose distribution data
found better agreement between the experimental and numerical results at the high flow
condition.
Blatchley III et al., (2008) validated CFD modeling predictions of the dose distribution through a large-scale continuous flow UV LP reactor using dyed microspheres. The
numerical dose distribution simulation and the experimental dose distribution determination were further validated by performing biodosimetry tests on bacteriophages MS-2 and Qβ. The predicted log inactivation from the numerical and experimental dose distribution data were compared to experimental biodosimetry results, and the study revealed good agreement between biodosimetry and each dose distribution curve for multiple operating conditions.
Zhao et al., (2009) assessed the impact upstream reactor piping has on the UV dose distribution curve within a LPHO reactor. Numerical predictions of the dose distribution were generated using CFD and were experimentally validated using fluorescent
microspheres. Three influent piping configurations were modeled, which included a straight pipe feeding the reactor, and two additional configurations with 90˚ elbow bends leading to the disinfection system. The experimental and numerical results showed that the straight influent piping shifts the UV dose distribution curve to higher doses when compared to each elbow configuration. The shift to higher average dose was attributed to the improved
16
deviations were attributed to the fluorescent microspheres’ inability to produce a single fluorescent intensity response to an applied UV dose. Nonetheless, the study suggests that microspheres can serve as an additional tool for UV reactor validation.
Wols et al., (2010) also conducted a study where CFD was used to validate the hydraulics in a UV reactor. Experimental tests were conducted using the traditional salt tracer procedure; however, additional experimental validation consisted of tracer dye analysis to visualize mixing patterns within the reactor, and Laser Doppler Anemometry (LDA) to understand local instantaneous velocity gradients. Results from the initial numerical model were used to predict an improved reactor design; the updated design included geometry and light
placement modifications. The upgraded design predicted improved hydraulics and shifted the UV dose distribution curve to a higher dose range; however, the curves were not
experimentally validated.
Wang et al., (2012) used CFD modeling and a continuous flow UV-LED reactor to
understand the applicability of an advanced oxidation, TiO2-based, photo-catalytic process for odor abatement. The research used 27 UV-A LEDs and a thin TiO2 plate to generate highly reactive species for the oxidation of dimethyl sulfide (DMS). The study used a CFD model to determine the light intensity gradients within the reactor using alternative UV-LED spatial locations, and also determined the DMS concentration gradients at these LED
locations. The model predicted an optimal placement of LEDs at an ‘intermediate’ distance from the TiO2 surface. The moderate light travel distance was ideal because it allowed for relatively uniform light intensity gradients at the metal surface. A highly heterogeneous irradiance distribution (LEDs exceptionally close to metal surface) was deemed inefficient because it generated pockets within the reactor with few reactive species.
17
reactor model is likely due to the novelty that comes in designing a UV-LED continuous flow drinking water disinfection system. Furthermore, no research has used such a model to numerically optimize a UV-LED reactor, and experimentally validate the optimized design. In this study, the optimization model varied the spatial orientation of LEDs, the number of LEDs, and the wavelength of light (260 nm or 275 nm). Prior to its use as an optimization tool, the numerical predictions of the reactor hydraulics, irradiance, and microbial
degradation within the reactor were validated experimentally. The validation approaches, although performed separately, are combined to provide a detailed characterization of the UV reactor behavior. In this study, the CFD-predicted numerical solutions were validated by a NaCl step input tracer test (hydraulic validation), iodide/iodate chemical actinometry (average irradiance), and biodosimetry (microbial inactivation). Following the initial validation, numerical optimization software, ModeFrontier, was used in conjunction with a CFD program, COMSOL Multiphysics, to generate an optimized point-of-use UV-LED device. Two optimality conditions were considered: 1) multi-objective analysis and
generation of the Pareto front (maximizing log10 inactivation and minimizing supply power); and 2) minimizing input supply power by achieving at least (2.0) log10 inactivation of E. coli ATCC 11229. All tests were completed at a flow rate of 109 mL/min and 92% UVT. The numerical solution for the second optimality criteria was validated experimentally using biodosimetry. Two additional non-optimal solutions were validated to show the legitimacy of the inferior solutions.
3
METHODS
3.1 HYDRAULIC CHARACTERIZATION
18
injected as a continuous input at the inlet and samples were collected at the outlet at an interval of 5% of theoretical residence time. Conductivity of all the samples were measured with a digital conductivity meter (PH/CON 2700 MTR W/PROBE, Cole-Parmer, Court Vernon Hills, Illinois) and normalized to the initial conductivity of the salt solution. These normalized values were plotted against elapsed time to get the cumulative residence time distribution curve F(t). Tracer simulations were performed using COMSOL Multiphysics (version 4.3a, COMSOL, Inc., Burlington, MA). The transport of the tracer chemical was performed using the flow field (as calculated using the continuity and Navier-Stokes equations) and the scalar convective-diffusion transport equations (Liu et al., 2007). The back ground fluid transport was performed at steady state while the tracer transport simulation was performed under transient conditions to replicate the experimental conditions.
3.2 FLUENCE RATE CHARACTERIZATION
The fluence rate characterization was performed using chemical actinometry. Standard actinometry solution was created using potassium iodide, potassium iodate, and borax. The concentration of iodide, iodate, and borax used was 0.6M, 0.1M and 0.01M, respectively. When the iodate and iodide are exposed to UV light, the chemical species react to form triiodide. The triiodide concentration was measured using spectroscopy where the excitation wavelength is 352 nm. The absorbance value was converted to a molar concentration of triiodide using the following equation (Equation 3.1):
19
the stock feed to achieve steady state and make replicate measurements in the reactor effluent. Continuous flow-through experimental tests were performed at two different UV LED light configurations, 25 and 30 active LEDs. A model of the iodide/iodate/triiodide chemical reaction was used to predict the effluent concentration of triiodide using CFD. The chemical equations (Equations 3.2-3.7) display reactions involved in the transformation of iodide and iodate to triiodide in the presence of UV light, or Ia: (Rahn, 1997).
3.2
3.3
3.4
3.5
3.6
3.7
20
from experimental tests. Bench scale actinometry tests were performed to determine the reaction rate constant (k2). The iodide, iodate, and triiodide rate equations were then incorporated into the CFD model (i.e., through the convective diffusion equation with a reaction term) with the evaluated constant (k2) from the bench scale tests to assess its performance.
3.8
3.9
3.10
3.11
3.12
3.13
3.14
3.15
3.16
21
3.17
3.18
3.19
3.20
3.21
3.22
3.23
3.24 3.3 MICROBIAL INACTIVATION CHARACTERIZATION
22
A standard collimated beam protocol was followed where cell samples (10mL) were placed under the 15 UV-LED collimated beam and exposed to light to achieve various UV dosages
(Bolton and Linden 2003). Control samples were collected prior to exposure to UV. A 2250 mL solution of saline-calcium, spiked with the appropriate sample (MS-2, Qβ, or E. coli
ATCC 11229), was used for the flow-through reactor experimental tests. The solution volume provided time for steady-state conditions to be achieved in the reactor, allowed for 3
times the hydraulic retention time (HRT) to pass through the system prior to sample
collection, and was consistent with the testing volume used in the chemical actinometry
validation tests. Operating conditions included 109 mL/min flow rate at 92% and 80%
UV-transmittance (UVT), with each UV-LED operating at 20 mA, per manufacturer
specifications. To lower the UVT, an appropriate amount of super-hume (CropMaster Super
Hume, UAS of America, Inc., Lake Panasoffkee, Florida) was added to the solution.
Following super-hume and saline-calcium mixture, the sample was autoclaved for
sterilization purposes and allowed to cool overnight at room temperature.
The sample was pumped through the reactor using a peristaltic pump (Ocaton PC 2700 Master flex L/S Drives, Cole-Parmer, Court Vernon Hills, Illinois) for 15 minutes prior to collecting the first of three samples. The remaining two samples were collected in 2.0 minute
increments following the first sample collection. A control sample for each test was collected
and stored in a sterile dark tube prior to exposure to the UV-LEDs. In addition, a dark
sample measuring the effluent microbial concentration, with the UV-LEDs turned off, was
prepared, and confirmed no difference between influent and effluent microbial concentration.
All bacteriophage trials were collected in 50mL sterile dark tubes to prevent unwanted UV
inactivation during transport and/or bioassay, and promptly assessed. E. coli ATCC 11229
samples were also collected in dark sterile tubes to prevent unwanted inactivation from
ambient light, and also to lower the probability of photo-reactivation. Research (Quek et al.,
2008) has shown that the inactivation rate for E. coli ATCC 11229 (when grown to log
23
exposure) than through dark repair (~10% log repair for one hour of dark incubation). The
procedures for the enumeration and propagation of the coliphages and E. coli bacteria are
provided in Section 3.4.
3.4 MICROBIAL ASSAY PROCEDURES
MS-2, Qβ, and E. coli ATCC 11229 were delivered from American Type Culture Collection (ATCC) to Broughton Hall on North Carolina State University campus (Raleigh, NC, USA) and promptly revived (according to ATCC procedural guidelines) and stored in -85°C temperatures. The propagation and enumeration of both bacteriophages followed the assay method used by Bohrerova et al., 2006, while enumeration of E. coli ATCC 11229 followed
a similar method to Cho et al., (2005). All solutions (agar, broth, dilution, etc.) were
autoclaved following preparation, and all bioassay procedures were performed aseptically
under a laminar flow biological safety cabinet to prevent contamination of microbial stocks.
Details describing broth, agar, and dilution preparation are provided in Table 1 and Section 19.1.
E. coli Host Preparation
E. coli (American Type Culture Collection 15597, strain C3000) was used as the host
microorganism for both bacteriophages (MS-2 and Qβ), and was cultivated using
tryptone-based broth. A 1 mL host sample was taken from -20°C storage, allowed to thaw, inoculated
in 50 mL of fresh tryptone broth solution, and incubated at 37°C for 18-24 hours. Following
overnight incubation, broth solution was either used to conduct bioassay experiments, or a
series of 1 mL aliquots were made containing a 1:1 mixture of stationary-phase broth and
glycerol (10%); individual 1 mL aliquots were then mixed and placed in a -20°C freezer for
24 Coliphage Enumeration and Propagation
Tryptone broth, tryptone top and bottom agar, and saline-calcium were prepared and
autoclaved (250°F, 20 pounds per square inch, 20 minutes) prior to performing bacteriophage
enumeration. Immediately following autoclaving, bottom agar was poured in Petri dishes
under a biological safety cabinet and allowed to cool. Upon cooling, Petri dishes were placed
at 4°C for 18-24 hours, until used for experiments. Broth, top agar, and saline-calcium were
allowed to cool to room temperature. After reaching ambient temperature, an E. coli host
sample (1 mL) was combined with the 50 mL fresh broth sample and incubated overnight, as
described in the preceding section (E. coli Host Preparation). On the day of the assay, top
agar was returned to a molten state, separated in 5 mL sterile tubes, and placed in a 50°C
water bath. Additionally, the refrigerated Petri dishes were incubated at 37°C for one hour
prior to performing the assay for the plates to warm. Frozen coliphage samples were thawed
and inoculated (0.1 mL or 2.25 mL for collimated beam and continuous flow experiments,
respectively) in saline-calcium dilution (9.9 mL or 2247.5 mL for collimated beam and
continuous flow experiments, respectively). Suspensions then underwent photochemical
testing, and were immediately assayed. Ten-fold serial dilutions of the virus involved
saline-calcium (0.9 mL) and phage (0.1 mL). A 0.1 mL sample of dilution mixture was inoculated
in 0.1 mL of host broth solution. Combined viral/broth solution was then placed in the 5 mL
molten agar, mixed, and poured over the solidified bottom agar and allowed to harden. Petri
dishes were inverted and incubated at 37°C for 18-24 hours prior to counting viral plaques.
Target counting range was 20-200 plaque forming units (pfu) on each plate.
Propagation of both viruses followed the procedural guideline ATCC15597-B1. Briefly,
cultivation of the E. coli host was completed in the identical manner as described in the E.
coli Host Preparation section (Section 3.4). Additionally, thawed viral samples (0.1 mL) were
combined in a series of centrifuge tubes containing saline-calcium (0.9 mL), such that each
aliquot underwent only a one tenth dilution. Following this step, 0.1 mL of diluted sample
25
mixed with 5 mL molten top agar (0.3% agar) and poured over solidified bottom agar, and incubated inverted at 37˚C for 18-24 hours. Following these steps, 5 mL of saline-calcium
dilution was evenly spread over each sample Petri dish for 30 minutes (to soften the top
agar). The soft agar solution was then scraped off the bottom agar and collected in six 15 mL
centrifuge tubes. Samples were then centrifuged using a Sorvall Ultra 80 (Thermo-Scientific
Inc., Asheville, NC, USA) bench-top device at 700 G (4˚C) for 25 minutes. The supernatant
was then separated, passed through a 0.22μm filter (to collect singlet viruses), and stored in a
-85˚C freezer in 1.5 mL aliquots.
E. coli ATCC 11229 Enumeration and Propagation
Enumeration of E. coli ATCC 11229 followed a similar method to Cho et al., (2005). Frozen
aliquots (0.5 mL) were thawed and a 0.3 mL sample was inoculated in a 50 mL fresh nutrient broth solution and incubated at 37˚C for 18-24 hours. Following overnight incubation, 0.3
mL stationary-phase broth solution was combined with 10 mL fresh broth and incubated at 37˚C for 4-5 hours to achieve log-growth phase. The sample was then placed in two sterile
tubes in a room-temperature Sorvall Ultra 80 centrifuge (Thermo-Scientific Inc., Asheville,
NC, USA) and spun at 1000 G for 10 minutes. Supernatant was extracted and disposed,
while saline-calcium (10 mL or 22.5 mL for batch and continuous flow experiments,
respectively) was added to re-suspend the pellets and remove opacity associated with the
growth media. Samples then underwent photochemical testing. Following exposure,
saline-calcium (0.9 mL) was placed in serial dilution tubes and irradiated samples (0.1 mL) were
diluted appropriately. Dilutions (0.1 mL) were spread over agar plates using cell spreaders, allowed to dry, and incubated inverted at 37˚C for 18-24 hours prior to counting bacterial
colonies. Target counting range was 20-200 colony forming units.
E. coli ATCC 11229 was delivered in lyophilized form from ATCC to North Carolina State
University and revived according to manufacturer guidelines. Propagation of E. coli ATCC
26
incubated agar plate. The loop was then added to 50 mL of fresh nutrient broth and
incubated for 24 hours at 37˚C. Following overnight incubation, 0.2 mL of broth was added to 10 mL of fresh broth and incubated at 37˚C for 4 hours. Finally, 0.4 mL of log-phage
broth was combined with 0.1 mL glycerol (10%) and placed in a -85˚C freezer for long term
storage.
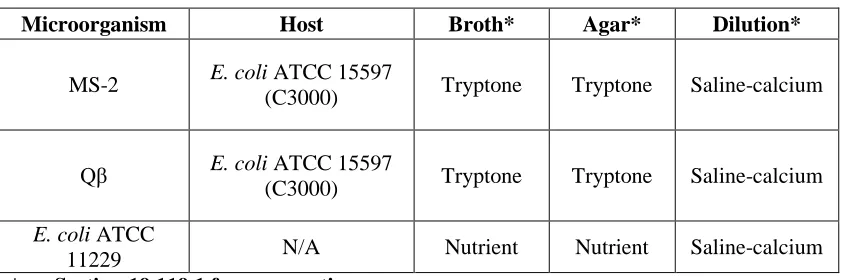
Table 1. Microorganism Specifications
Microorganism Host Broth* Agar* Dilution*
MS-2 E. coli ATCC 15597
(C3000) Tryptone Tryptone Saline-calcium
Qβ E. coli ATCC 15597
(C3000) Tryptone Tryptone Saline-calcium
E. coli ATCC
11229 N/A Nutrient Nutrient Saline-calcium *see Section 19.119.1 for preparation
details
3.5 UV DOSE DISTRIBUTION CHARACTERIZATION
The dose distribution within the reactor was numerically determined using a Lagrangian
27
3.25 In a Lagrangian particle-track simulation, a spatial homogeneous concentration of particles is released at the UV system influent. Similar to establishing a grid-independent CFD solution, the predicted fluence distribution should not be a function of the number of particles released at the inlet. Results from increasing particle number concentration at the reactor influent showed that a stable distribution was produced using 1500 particles.
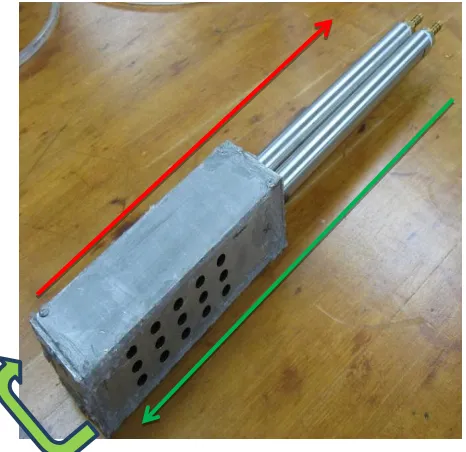
3.6 REACTOR CONSTRUCTION
28 Figure 3.1. Reactor body
3.7 NUMERICAL SIMULATIONS
A finite element based CFD modeling software, COMSOL Multiphysics (COMSOL Inc., Burlington MA), was used to solve the conservation of mass and momentum equations (Equation 3.26 and Equation 3.27, respectively) to predict the flow field and pressure distribution inside the reactor volume. This software was used for geometry generation, meshing, physics settings, solving, and post processing. An iterative matrix solver (GMRES) was used to solve the governing equations of fluid dynamics, and convergence was considered to be achieved when relative errors of the numerical solutions were below 1E-06.
29
according to the suggestion of Durst et al., (2005). A constant velocity (uniformly distributed over the inlet area), was maintained at the inlet and zero pressure boundary condition was imposed at the outlet. Other closed boundaries were modeled as no slip wall. Calculation of the Reynolds number at the modeled flow rates (Re = 182 and 318 for 109 mL/min and 190 mL/min, respectively) suggest a laminar flow field through the reactor. Positive step and negative step tracer tests were simulated by using the unsteady convective diffusion equation (Equation 3.28). Light model (Equation 3.29) was used to calculate the fluence rate distribution inside the computational domain (Liu et al., 2004; Bowker et al., 2010). The radiant intensity emitting from a point source of light is defined by the inverse square law, where P is the light power (W) and is the radial distance (m) from the light source. Viewing angle α = 60o was imposed in this study based on the manufacturer specifications. The light power is multiplied by the UVT (%) to account for UV absorbance of differing UV wavelengths. All of the LEDs were assumed to have flat window (FW) configurations, as established by the manufacturer (SET, Inc., 2008).
The microbial inactivation kinetic data, as determined from the collimated beam experiments, was incorporated into the numerical model to assess the microbial degradation performance of the reactor. Numerical modeling of MS-2, Qβ and E. coli ATCC 11229 was solved using the steady state convective diffusion equation (Equation 3.30), where the model incorporated a microbial fluence response term, R. The R term was dependent on the microorganism. MS-2 and Qβ both show near log-linear dose response curves in response to 260 nm UV-LEDs (as found from collimated beam testing); therefore, the kinetics most accurately follow the Chick-Watson equation (Equation 3.31). E. coli ATCC 11229 UV response displays a shoulder region at low doses, and is best simulated using the Series-Event model (Equation 3.32).
30
3.26 Conservation of momentum equation:
3.27 Unsteady Convective diffusion equation:
3.28 Light model:
3.29 Microbial inactivation:
3.30 Chick Watson Model:
3.31 Series-Event model:
3.32
3.8 OPTIMIZATION ROUTINE
ModeFrontier, multi-objective optimization software, was coupled with COMSOL
31
to link ModeFrontier with COMSOL, using the LiveLink for Matlab module in COMSOL 4.3a.
Prior to solving the three-dimensional reactor design, a preliminary study was completed to determine the genetic algorithm that most quickly and accurately solves a simplified (two-dimensional) version of the problem. The MOGA-II algorithm converged on the global optimal solution in the fewest number of iterations, and was therefore deemed the
evolutionary algorithm of choice for the three-dimensional design. MOGA-II is powerful because it is a multi-search elitism algorithm that maintains potentially optimal solutions without pre-mature convergence on a local optimal (Poles 2003). The total number of evaluations the algorithm performs is the initial population size multiplied by the number of generations. In this study, the initial population consisted of 100 “individuals”, where an “individual” is a potential light configuration (i.e. all 30 275 nm UV-LEDs activated). Ten of the 100 individuals were user-defined inputs, and represented previously simulated
configurations (i.e. 30 260 nm UV-LEDs activated, 30 275 nm UV-LEDs activated, 15 260 nm UV-LEDs activated, 15 275 nm UV-LEDs activated, etc.). The remaining 90 initial reactor configurations were determined by the SOBOL sampling algorithm, which attempts to uniformly distribute the input variables across the decision space. The algorithm
performed 100 generations, providing a total of 10,000 simulations for a given multi-objective problem. Two multi-multi-objective analyses were performed: 1) maximize the log inactivation and minimize the input supply power to the system; 2) minimize the log
inactivation and maximize the input supply power. The second, less intuitive, multi-objective solution presented the lower-bound of feasible UV-LED reactor designs.
32
the biodosimetry through the system. For a given flow rate, the hydraulics do not deviate from one simulation to the next; therefore, the fluid profile was saved prior to the
optimization, eliminating the need for re-solving one of the physics. At three minutes per simulation (using one computer), the optimization would have taken up to 500 hours, or about 21 days. However, by distributing the simulations, each optimization took between three and five days.
4
JOURNAL ARTICLE NO. 1 (CHEMICAL ENGINEERING SCIENCE)
Modeling a continuous flow ultraviolet Light Emitting Diode reactor using Computational Fluid Dynamics
Richard M. Jennya, [email protected], Dr. Otto D. Simmons IIIb [email protected], Dr. Max Shatalovc [email protected], Dr. Joel J. Ducostea,* [email protected]
a
Department of Civil, Construction, and Environmental Engineering, North Carolina State University, Campus Box 7908, Raleigh, NC 27695-7908, USA
b
Department of Biological and Agricultural Engineering, North Carolina State University, Campus Box 7625, Raleigh, NC 27695, USA
c
Sensor Electronic Technology, Inc, 1195 Atlas Road, Columbia, SC 29209
Highlights
A CFD model of a UV-LED disinfection reactor was experimentally validated
Hydraulics, biodosimetry, and chemical actinometry showed good agreement with
model
UV-LED reactor demonstrates high efficiency as a point of use disinfection device
33
The use of ultraviolet (UV) light for water treatment disinfection has become increasingly popular due to its ability to inactivate chlorine-resistant microorganisms without the production of known disinfection by-products. Currently, mercury-based lamps are the most commonly used UV disinfection source; however, these lamps are toxic if broken during installation or by foreign object strike during normal operation. In addition, disposal of degraded, hazardous mercury lamps can be challenging in rural and developing countries for point-of-use (POU) drinking water disinfection applications. UV light emitting diodes (LEDs) offer an alternative, non-toxic UV source that will provide design flexibility due to their small size, longer operating life, and fewer auxiliary electronics than traditional mercury-based lamps. Modeling of UV reactor performance has been a significant approach to the engineering of UV reactors in drinking water treatment. Yet, no research has been performed on the experimental and modeling of a continuous flow UV-LED reactor. A research study was performed to validate a numerical computational fluid dynamics (CFD) model of a continuous flow UV-LED water disinfection process. Reactor validation consisted of the following: 1) hydraulic analysis using tracer tests, 2) characterization of the average light distribution using chemical actinometry, and 3) microbial dose-response and inactivation using biodosimetry. Results showed good agreement between numerical simulations and experimental testing. Accuracy of fluid velocity profile increased as flow rate increased from 109 mL/min to 190 mL/min, whereas chemical actinometry saw better agreement at the low flow rate. Biodosimetry testing was compared only at the low flow rate and saw good agreement for log inactivation of bacteriophage Qβ and MS-2 at 92% and 80% UV transmittance (UVT). The results from this research can potentially be used for the design of alternative point-of-use drinking water disinfection reactors in developing countries using UV LEDs.
Keywords
34
5
INTRODUCTION
The use of ultraviolet (UV) light for water treatment disinfection has become increasingly popular due to the ability of UV to inactivate the chlorine-resistant protozoa Cryptosporidium and Giardia. Other advantages of UV light include: no known disinfection by-product (DBP) formation, no resulting taste/odor issues, and over-dosing will not compromise public health (Chatterley et al, 2010).
Presently, the majority of UV light technologies used for water treatment are generated by mercury-based lamps. The three most common mercury-based UV sources are low-pressure (LP), low-pressure high output (LPHO), and medium-pressure (MP) lamps. LP and LPHO lamps emit monochromatically at 253.7nm, at approximately 10-4 pounds per square inch (psi), and generate low to medium power outputs. Conversely, MP lamps emit polychromatic light (200-400nm) and operate at much higher temperature, pressure, and intensity than LP and LPHO lamps. Although MP lamps emit higher output energy than LP and LPHO lamps, the broadened wavelengths emitting from the MP lamp reduces its germicidal efficiency (USEPA, 2006).
35
lamps can be especially difficult in developing countries where energy-saving POU disinfection processes are desired. In these rural and undeveloped regions, it is critical to implement systems that provide energy savings, long light replacement intervals, and components that are safe to handle and dispose. LEDs provide these benefits, as they have been recognized as a system that saves energy (input power is in range of mW), lowers maintenance cost, lengthens replacement intervals, and are non-toxic (Chatterley et al., 2010). In addition, LEDs are compact in size, shape, durable in transit and handling, easily reconfigurable, require less auxiliary electronics than mercury based lamps, and ensure robust building (Chatterley et al., 2010). For all these reasons, LEDs have the potential (assuming wall plug efficiency continues to improve) to replace fluorescent lamps for point-of-use drinking water disinfection systems in developing countries.
36
research found 1.6 log inactivation of MS2 at 0.5 liters per minute flow rate (34mW input power).
37
6
METHODS
6.1 HYDRAULIC CHARACTERIZATION
The hydraulic characteristics of a UV reactor is generally determined by a tracer test, where a non-reactive tracer is injected at the inlet under steady state flow conditions, and time dependent tracer concentration is measured at the outlet. In this study, a positive step tracer test was conducted where a NaCl (127 μS/m) (Certified ACS Crystalline S271-1, Fischer Scientific Pittsburg PA) solution was used as a non-reactive tracer. NaCl solution was injected as a continuous input at the inlet and samples were collected at the outlet at an interval of 5% of theoretical residence time. Conductivity of all the samples were measured with a digital conductivity meter (PH/CON 2700 MTR W/PROBE, Cole-Parmer, Court Vernon Hills, Illinois) and normalized to the initial conductivity of the salt solution. These normalized values were plotted against elapsed time to get the cumulative residence time distribution curve F(t). Tracer simulations were performed using COMSOL Multiphysics (version 4.3a, COMSOL, Inc., Burlington, MA). The transport of the tracer chemical was performed using the flow field (as calculated using the continuity and Navier-Stokes equations) and the scalar convective-diffusion transport equations (Liu et al., 2007). The back ground fluid transport was performed at steady state while the tracer transport simulation was performed under transient conditions to replicate the experimental conditions.
6.2 FLUENCE RATE CHARACTERIZATION