ABSTRACT
HOWARD, BRIAN EDWARD. Methods for Accurate Analysis of High-Throughput Transcriptome Data. (Under the direction of Dr. Steffen Heber).
A detailed understanding of the transcriptome is a prerequisite for deciphering the
flow of information from genotype to phenotype. Fortunately, modern high-throughput technologies now provide an unprecedented ability to observe the full complement of
transcriptional events, which extend far beyond the classical "one gene, one protein" hypothesis to include alternatively spliced genes, microRNAs, RNA interference, anti-sense transcription, and a variety of other, until recently, unknown phenomena. However, in order
to accurately interpret the results of these assays, new statistical and bioinformatic methods must be developed in parallel to biotechnological advances. In this thesis, we present several
methods for improving the accuracy of inferences obtained from the high-throughput transcriptome data generated by these new technologies.
First, we present a novel method for microarray quality assessment. Since accurate
inference is dependent on the quality of the underlying data, quality assessment is a critical component in any microarray data analysis. Our method, which uses an unsupervised
classifier to discriminate between high and low quality microarray datasets, exhibits performance comparable to supervised learners constructed using the same training data. However, because our approach requires only unnannotated data, it is easy to customize and
to keep up-to-date as technology evolves.
Next, we present an alternative method for microarray quality assessment, which
gene expression when suspected low quality arrays are included in the dataset. A key advantage of this approach is that, unlike other methods, this method provides a specific recommendation about whether to retain or discard low quality chips in the context of a
particular experimental setting.
Finally, we introduce a procedure for accurately quantifying alternative splicing using
RNA-Seq data. Our method uses a familiar linear models approach, but improves upon similar methods that assume uniform coverage of RNA-Seq reads along the targeted transcripts. We first show, through simulation, that using an incorrect read sampling
distribution can lead to incorrect conclusions about the expression of isoforms in a mixture. Applying our method to an example dataset, we identify 438 differentially spliced genes,
exhibiting a range of expression patterns including genes with switch-like differential splicing between two tissues, as well as genes with more subtle variations in isoform expression.
Methods for Accurate Analysis of High-Throughput Transcriptome Data
by
Brian Edward Howard
A dissertation submitted to the Graduate Faculty of North Carolina State University
in partial fulfillment of the requirements for the degree of
Doctor of Philosophy
Bioinformatics
Raleigh, North Carolina 2009
APPROVED BY:
_______________________________ ______________________________ Dr. Steffen Heber Dr. David Bird
Committee Chair
BIOGRAPHY
Brian E. Howard was born in scenic Frederick, Maryland in 1972, where he was raised as an only child until the age of 5, when the first of two younger sisters arrived.
Surviving this early trauma eventually translated into an increased appreciation for quiet reflection and may have helped to steer Brian towards a career in science. In 1995, Brian
graduated from UMBC, in Baltimore, Maryland, with Bachelor of Science degrees in both Computer Science and Biology. After working as a software engineer for 9 years and obtaining a Masters degree in Computer Science from Johns Hopkins University in 2003,
Brian decided to pursue a research career in the genomic sciences. In 2004, Brian and his wife, Grace, moved to Raleigh where Brian enrolled in the excellent graduate program at
North Carolina State University. When he is not at work researching important questions in Bioinformatics and Computational Biology, Brian enjoys spending time with his wife, family, and dog, hiking and running, traveling, making music, and playing the occasional
ACKNOWLEDGMENTS
I would like to thank my wife, Grace, for her patience and support, not only during the time I have spent working on this thesis, but also for everything we have experienced
together that has brought me to this place. The same thanks I also extend to my parents and to my sisters. Thanks, also, to the staff, faculty and students at the BRC who have helped to
make this a successful journey – especially to Dr. Steffen Heber, who has provided invaluable insights and support along the way. I would also like to express my gratitude to Dr. John Sheppard, who introduced me to academic research and started me out on this path
TABLE OF CONTENTS
LIST OF TABLES ...vi
LIST OF FIGURES ...vii
1 INTRODUCTION...1
Study of the Transcriptome in the (Post-) Genomic Era... 2
Components of the Transcriptome... 5
High-Throughput Technologies for Transcriptome Analysis... 9
Microarrays ... 10
Affymetrix 3’ GeneChip Arrays ... 11
Affymetrix Exon Arrays ... 14
High-Throughput RNA Sequencing ... 15
Rouche / 454 Life Sciences Pyrosequencing ... 15
Illumina / Solexa Sequencing ... 20
Microarray Quality Assessment... 24
Sources of variability ... 24
Review of Popular Quality Metrics ... 29
5’ to 3’ RNA degradation plot ... 32
Raw intensity distribution ... 33
Normalized intensity distribution ... 33
PLM weights and residuals... 34
RLE box plot... 34
Microarray Quality Assessment Summary ... 35
References... 36
2 UNSUPERVISED ASSESSMENT OF MICROARRAY DATA QUALITY USING A GAUSSIAN MIXTURE MODEL ...42
Abstract... 43
Background... 43
Methods... 47
Datasets... 47
Expert Annotation... 50
Supervised Naïve Bayes Classifier ... 53
Unsupervised Naïve Bayes Classifier... 54
Gaussian Mixture Model and the EM Algorithm ... 55
Feature Selection... 58
Results and Discussion ... 60
Parameter Estimates... 60
3’ Expression Arrays... 60
Exon Arrays ... 62
Classifier Performance Evaluation ... 65
Exon Arrays ... 70
Simulation Results ... 71
Conclusions... 71
Software Availability and Requirements ... 73
Acknowledgements... 74
References... 75
3 PRACTICAL QUALITY ASSESSMENT OF MICROARRAY DATA BY SIMULATION OF DIFFERENTIAL GENE EXPRESSION...82
Abstract... 83
Introduction... 83
Methods... 85
Datasets... 85
Expert Annotations ... 85
Quality Assessment Algorithm... 86
Results... 92
Comparsion with Expert Annotations... 92
Practical Quality Judgment Depends on the Details of the Experiment... 93
Discussion... 96
References... 99
4 TOWARDS RELIABLE ISOFORM QUANTIFICATION USING RNA-SEQ DATA ...101
Abstract... 102
Introduction... 102
Methods... 105
Model Overview ... 105
Distribution of Read Start Position and Read Length... 107
Constructing the Design Matrix... 109
Estimation of b and f... 109
Implementation ... 112
Results... 112
Simulation... 112
Real RNA-Seq Dataset ... 115
Discussion and Future Work... 116
References... 117
5 Conclusions...119
LIST OF TABLES
Table 2-1. BioConductor quality control statistics ... 49
Table 2-2. Affymetrix Expression Console quality control statistics (exon arrays)... 51
Table 2-3. Confusion matrices, full training set ... 68
LIST OF FIGURES
Figure 1-1. Extensive variation in genome size within and among the main groups of life. ... 3
Figure 1-2. Layers of coordinated gene regulation... 6
Figure 1-3. Steps in Roche/454 Life Sciences pyrosequencing... 19
Figure 1-4. Pyrosequencing adaptors... 20
Figure 1-5. Illumina sequencing. ... 23
Figure 1-6. Examples of microarray quality assessment diagnostics. ... 31
Figure 1-7. Additional microarray quality assessment diagnostics. ... 32
Figure 2-1. Mixture model parameter estimates. ... 61
Figure 2-2. Comparison of parameter estimates for 3' expression arrays and exon arrays. ... 64
Figure 2-3. Parameter estimates for exonarrya expression console QC features. ... 66
Figure 2-4. Classifier performance. ... 69
Figure 2-5. Exon arrays identified as high and low quality using two sets of QC indicators. 72 Figure 3-1. Low-quality calls by expert quality group. ... 90
Figure 3-2. Comparison of expert and simulation determined quality scores. ... 91
Figure 3-3. Normalized expression levels for 4 probesets from experiment GSE1873. ... 95
Figure 3-4. Log expression for experiment GSE1873. ... 96
Figure 4-1. Distribution of read start position as percentage of gene length for genes with median gene length of 1200 bp... 110
Figure 4-2. Procedure for computing the design matrix. ... 111
Figure 4-3. Estimates for phi using 2000 simulated reads... 114
Chapter 1
Study of the Transcriptome in the (Post-) Genomic Era
Genome size alone is a poor predictor of phenotypic complexity. Ever since the first
crude, genome-level investigations in the 1950’s, biologists have been puzzled by a lack of correlation between the raw count of genomic nucleotides and organism morphology (Pray, 2008; see also Figure 1-1.) Today, with the availability of many whole genome sequences, it
is clear that there is also no meaningful association between gene count and organism complexity. For example, the organism with the largest known number of genes (60,000) is
the single-celled parasite Trichomonas vaginalis. In contrast, the current gene count estimate for Homo sapiens is about 25,000 — approximately the same as the plant, Arabidopsis thaliana, and less than both mouse (30,000 genes) and rice (51,000 genes) (Pray, 2008).
The key to resolving this information gap is widely believed to hinge on a detailed understanding of the spatial and temporal gene expression patterns that confer phenotype
from genotype (Sharp, 2009). In between the latent information stored in raw DNA and outwardly observable biological forms, lies a complex, and often mysterious, world of RNA. As a first step towards understanding the flow of information from genes to proteins, it is
imperative to study the entire transcriptome, or “the complete set of transcripts in a cell, and their quantity, for a specific developmental stage or physiological condition.” (Wang et al.,
2009) In recent years, our understanding has advanced far beyond the classic “one gene, one protein” hypothesis, to include a rich transcriptional landscape in which a single gene can, in fact, encode multiple protein products, and in which many important regulatory transcripts do
research in this area, thanks, in part, to a variety of new high-throughput technologies that allow researchers to study the detailed expression of thousands, or tens of thousands, of RNA transcripts at once.
This introductory chapter will begin by reviewing several of the important components of the transcriptome, which includes not only the canonical, “carbon-copy”
mRNAs fundamental to the “Central Dogma” of molecular biology, but also alternatively-Figure 1-1. Extensive variation in genome size within and
among the main groups of life (Pray, 2008).
spliced transcripts, non-protein coding microRNAs, and anti-sense RNAs. Then, we will review the various high-throughput technologies that are currently available for measuring transcriptome expression. Special attention will be given to both microarrays and
high-throughput RNA sequencing (RNA-Seq), both of which are central to this thesis. Finally, relevant background information regarding current methods for microarray quality
assessment is discussed, in an effort to lay the groundwork for subsequent chapters.
The focus of our research is the development of new methods that can be used to maximize the accuracy of inferences obtained through analysis of transcriptome datasets. In
the case of microarrays, which are often subject to high levels of experimental noise (Wilkes, et al., 2007), data quality assessment is a critical component of any analysis. In chapter 2, “Unsupervised assessment of microarray data quality using a Gaussian mixture model,” we will introduce a new method for interpreting a variety of widely-used quality indicators in the effort to identify low quality microarrays. This chapter was previously published in the
journal BMC Bioinformatics (Howard, et al., 2009a). In chapter 3, “Practical quality assessment of microarray data by simulation of differential gene expression,” we take a different approach to quality assessment. In small, real-world experiments, it is often not
feasible to re-run a defective hybridization; instead the relevant choice is whether or not to completely discard imperfect data. To address this question, we introduce a simulation-based
method that determines the effect of discarding a particular array in the context of a test for differential gene expression. This chapter was published in the conference proceedings for the 5th International Symposium on Bioinformatics Research and Applications (ISBRA 2009)
RNA-Seq data,” we turn our attention to an alternative high throughput technology. In particular, our interest is in developing a method for quantifying the relative transcription levels for the various alternatively spliced isoforms for mutli-isoform genes, using RNA-Seq data. This
chapter is an accepted submission to the upcoming International Conference on Bioinformatics and Biomedicine (BIBM 2009).
Components of the Transcriptome
Early large scale gene expression studies often assume a limited definition of the
transcriptome as the “identity of each expressed gene and its level of expression for a defined population of cells” (Velculescu, et al., 1997). In these studies, gene expression levels are inferred from the measured quantities of messenger RNA (mRNA) found in a sample. This
approach is in correspondence with the “Central Dogma” of biology which describes how DNA genes are first copied to mRNA transcripts, and then delivered to ribosomes where they
are decoded and used as blueprints to assemble functional proteins. Indeed, most studies of the transcriptome have involved isolation of mRNA molecules followed by a quantification step using microarrays or, more recently, high-throughput RNA sequencing. Much has been
learned from this approach, with applications in drug development (Marton, et al., 1998), toxicology (Nuwaysir, 1999), biomarker discovery (Golub, et al., 1999; van’t Veer, et al.,
developed an increasing appreciation for complexities of the transcriptome that extend well beyond the simple one gene, one protein model of Beadle and Tatum (1941).
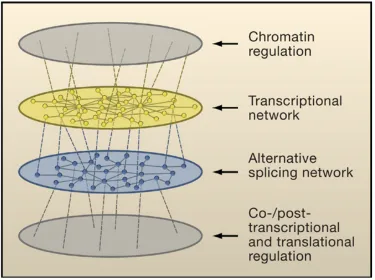
Figure 1-2. Layers of coordinated gene regulation (Blencowe, 2006).
In humans and other metazoans, most genes are divided into multiple protein coding regions (exons), separated by long intervening non-coding intronic regions. After transcription, but before being transported out of the nucleus for conversion to protein, the
introns are spliced out of the primary transcripts. In many cases, different patterns of splicing can lead to multiple transcripts and proteins from the same gene. It is now estimated that
70% or more of human genes undergo alternative splicing, and mutations in splicing regions are increasingly recognized as playing an important role in inherited diseases (Hertel 2008). Furthermore, microarray experiments have revealed that transcription and splicing appear to
be regulated in an orthogonal manner (Figure 1-2); the set of genes that is alternatively spliced is often very different than the set of genes that is differentially expressed under the
same conditions (Blencowe 2006). Technological advances that increase our ability to detect and measure this phenomenon are expected to lead to an increased appreciation for the role played by alternative splicing in the domains of evolution, tissue differentiation, phenotypic
response to environmental stimulus and disease pathology (Gravely 2001).
RNA interference (RNAi) is an additional complication that must be included in any modern definition of the transcriptome (Fire, et al. 1998). RNAi is a complex, conserved,
innate genetic mechanism that can be exploited to post-transcriptionally “silence” targeted genes with high specificity. The primary endogenous variety of RNAi occurs in the form of
micro-RNAs (miRNAs) — short, non-protein coding, functional RNAs that occur in the genomes of many organisms. Currently, there are 678 predicted human miRNAs cataloged in the miRBase database (Griffith-Jones 2004). Micro-RNA genes are transcribed in the nucleus
cleaved into mature 21-23 nucleotide miRNAs by an enzyme called DICER, and then incorporated into an RNA-induced silencing complex (RISC). When a RISC encounters a target RNA with base pair complementarity, the targeted mRNAs are either degraded or
sequestered. Because base-pairing is imperfect, each miRNA appears to target on average 5-10 mRNAs in humans (Sarnow 2006). Recent research suggests that microRNAs may be
nearly as important as transcription factors for the purpose of gene regulation in vertebrate genomes, and that the two regulatory mechanisms may work in concert to control gene expression (Hobert 2008). For example, it has been shown that, in many cases, up-regulation
of transcription factors confers wide-spread up-regulation of targeted genes, and that miRNAs may then modulate this response through post-transcriptional silencing in a
tissue-specific manner (Hobert 2004). In contrast to transcription factors, however, it has been noted that the “speed, reversibility, and compartmentalization of miRNA-mediated control mechanisms predestine miRNAs to be involved in rapid, adaptive changes in gene expression
to maintain homeostasis and to respond to specific environmental, nutrient, or neuronal signals.” (Hobert 2008).
In addition to microRNAs, there are also a number of other important non-coding
RNA species now recognized as components of the transcriptome. Piwi-interacting RNAs (piRNAs), for example, are short transcripts with lengths between 26 to 32 nucleotides.
Unlike miRNAs, they lack secondary structure and are not highly conserved (Carmi, 2006). They are thought to function in germline development, possibly in the capacity of silencing movable genetic elements, such as retrotransposons, during spermatogenesis (Watanabe, et
role in silencing germline retrotransposons, but their structure and properties are different (Watanabe, et al., 2006). In addition, endogenous, anti-sense RNA transcripts are also known to play an important regulatory role in some organisms by causing the degradation of
their targeted sense transcripts (e.g. Dühring, et al., 2006). At this time, many of the mechanisms and properties of these functional non-coding RNAs remain unknown. In
addition, there are probably additional types of non-coding RNA, that are yet undiscovered — especially longer transcripts that have been more difficult to characterize with high-throughput RNA sequencing technologies (Sharp, 2009). In fact, the recent ENCODE
project (The ENCODE Project Consortium 2007) has revealed that the majority of the human genome is actually transcribed into RNA, with only a tiny fraction of this corresponding to
protein-coding genes.
High-Throughput Technologies for Transcriptome Analysis
In this section we will provide a brief description of the two main technologies used to assay the transcriptome in a high-throughput manner. There are also several other important technologies with both historical and modern significance, including SAGE, EST
libraries, and MPSS. However, since our research is focused on data generated from microarrays and high-throughput RNA sequencing, we will limit our discussion to these two
Microarrays
The two main types of microarrays are spotted cDNA arrays and oligonucleotide
arrays. Both array types rely on hybridizing labeled RNA or cDNA from a sample to complementary nucleotides fixed to a solid surface. The amount of RNA hybridizing to the
array for each species is assumed to be proportional to its prevalence in the sample and can therefore be used as a proxy for quantification of the sample’s RNA content.
Spotted cDNA arrays are usually manufactured in-house by an individual lab. The procedure typically involves isolating RNA from a targeted transcriptome, and then making reverse transcribed cDNAs. These cDNAs are then affixed to a solid surface in a grid-like
pattern, with a distinct “spot” for each cDNA species. Each spot is complementary to a specific RNA transcript from the original sample, and can be used to quantify the RNA content of future samples from the same organism, tissue, and/or treatment. Because cDNA
arrays are typically made by individual labs, the resulting measurements can be more difficult to compare across labs than results obtained from industrially manufactured
oligonucleotide arrays (Bammler, et al., 2005). However, the degree of customization is attractive for many researchers, and, for non-model organisms, spotted arrays are often the only microarray platform available.
Oligonucleotide arrays such as those available from Agilent (http://www.chem.agilent.com), Affymetrix (http://www.affymetrix.com), Illumina
cross-hybridization to homologous regions of similar genes. Many types of arrays are available, varying according to the targeted molecules. Gene expression arrays attempt to measure the expression of mRNAs from protein coding genes, and typically target the least variable gene
regions at the 3’ and 5’ termini. For this reason, this platform is not usually capable of discriminating between alternatively spliced transcripts from the same gene. Exon arrays or
exon junction arrays have probes that are designed to query individual exons, or regions spanning adjacent exons, and can be used to quantify the occurrence of alternative splice isoforms. Genome tiling arrays are designed to measure transcription across the entire
genome, with probes spaced equally at regular intervals, regardless of known locations of protein coding genes. Other microarrays include probes for known miRNAs and other
non-coding RNAs. In this thesis, we make use of example datasets that originate from the Affymetrix GeneChip Array and Affymetrix Exon Array platforms. Accordingly, the following sections provide additional details regarding these arrays.
Affymetrix 3’ GeneChip Arrays
An Affymetrix GeneChip® microarray consists of an approximately one-half square inch quartz surface divided into a grid containing hundreds of thousands of “probe cells.” Each probe cell contains hundreds of thousands, or even millions of copies, of a single short
oligonucleotide probe. Each probe on the GeneChip “3’ Expression” arrays is typically 25 nucleotides in length. These probes, which are synthesized directly on the quartz surface
probe pair, the “perfect match” probe is perfectly complimentary to its intended target; the “mismatch probe,” on the other hand, contains a single mismatched nucleotide, usually at the center base within the probe sequence. Although the mismatch probe is intended to measure
non-specific, “background” hybridization, some pre-processing algorithms actually ignore the signal from this probe. Probe pairs are further organized into larger “probe sets.” Each
probe pair within a probeset is intended to hybridize to a different subsection of the intended target sequence. The 3’ expression arrays typically have about 11 probe pairs per targeted gene. In order to minimize the effects of various spatial artifacts that can occur during
hybridization, the probes for each probeset are not positioned contiguously, but rather are scattered across the entire array.
In the case of 3’ expression arrays, the goal is to measure the amount of mRNA in a sample and thereby gain information concerning the relative transcription levels of the targeted genes. Once mRNA has been isolated from the biological sample, oligo-dT primers,
which are complementary to the poly-A tails on the mRNAs, are used to prime reverse transcription reactions that convert the mRNA into double-stranded cDNA. Next, these cDNAs are re-transcribed back into cRNA using biotinylated nucleotides. In addition, an
amplification procedure can be used to increase the amount of RNA available for hybridization. The resulting cRNAs are then fragmented and hybridized to the array. Any
cRNA fragments that are complimentary to the probes on the array will base pair and anneal to the probes. Next, the array is exposed to a Streptavidin-phycoerythrin (SAPE) solution. The Streptavidein adheres to the biotinylated cRNA fragments bound to the array. Afterword,
can be read using an optical scanner, and the amount of light emitted from each cell is roughly proportional to the amount of cRNA hybridized to the probes in that cell.
After a microarray experiment has been performed, a variety of data processing steps need to be performed before an analysis of differential gene expression can proceed. Affymetrix provides software to assist with these steps, but there are also a variety of free,
public domain software packages available, as well. The first step is to convert the digitized image produced by the optical scanner into a raw intensity measurement for each probe. This involves determining the borders of each “spot” and computing an average intensity
measurement. Once raw intensity values have been read for each probe, it is next necessary to perform “background subtraction,” which is an attempt to remove noise caused by a
variety of factors including cross-hybridization, and other local and global artifacts. The mismatch probes may or may not be used for this purpose. After background subtraction, a normalization step is performed to ensure that each of the microarrays in an experiment has a
similar distribution of intensity values. In addition, the signals from all probes within a single probeset are typically summarized using a single statistic intended to represent the intensity of the target gene. Once these values have been computed, it is possible to use a
variety of statistical procedures, including t-tests, ANOVA, and other more sophisticated techniques, to compare the gene expression levels. In general, the outcome of a microarray
Affymetrix Exon Arrays
The Affymetrix GeneChip® Exon Array platform, currently available for mouse, rat
and human, is an oligonucleotide microarray platform designed to interrogate expression levels of individual exons, rather than genes. The Human Exon 1.0 ST Array, for example,
contains 1.4 million probesets querying more than one million exon clusters. On average, each potential exon or splice region is covered by a single probeset, with about 4 probes per probeset, for a total of more than 5,500,000 probes. These probesets are divided into
annotation categories which quantify the degree of evidence supporting the corresponding target features. “Core” probesets, for example, are designed to measure expression of
well-annotated exons, while the “Extended” and “Full” probeset lists contain probesets designed to measure expression of more speculative transcriptional loci, including computationally predicted exons. While the platform is relatively new, a sample of several recent
publications have reported reasonable rates of validation for detected differentially expressed exons (Gardinia, et al., 2006; Kwan, et al., 2007; French, et al., 2007; Chueng, et al., 2008;
Clark, et al., 2007). In general, better validation rates tend to occur when more stringent filters are applied to the candidate list - for example, by only accepting predictions from probesets with signal levels that are clearly above background, and by using only those
probesets from the “Core” list. The fact that each probeset is comprised of, on average, only four probesets, may make the results somewhat noisier than for traditional 3’ arrays.
One important design limitation inherent in this platform, is that exon arrays measure exon expression and not transcript expression. For a given splicing isoform, exon arrays can only provide measurements of the component exons individually; they do not directly
measure what combinations of exons are being co-expressed within the same transcript. Consequently, published analyses made using this platform have necessarily emphasized
differential exon expression rather than differential splicing products.
High-Throughput RNA Sequencing
High-throughput RNA sequencing (RNA-Seq) includes sequencing by synthesis according to a variety of technologies, including those from Solexa / Illumina, Applied
Biosystems / SOLID, Roche / 454 Life Sciences, as well as several other biotechnology companies. In these procedures, either RNA or reverse transcribed cDNA is fragmented and then used as a template for massively parallel polymerization reactions while various
techniques are used to record each nucleotide added to the growing oligonucleotide chains. Various platforms are capable of sequencing millions of short reads in parallel, which can
then be mapped to a reference genome or assembled de novo. Chapter 4 of this thesis presents an analysis of datasets generated from both the Roche 454 and Illumina platforms. In the next two sections, we provide additional background information specific to these
technologies.
Rouche / 454 Life Sciences Pyrosequencing
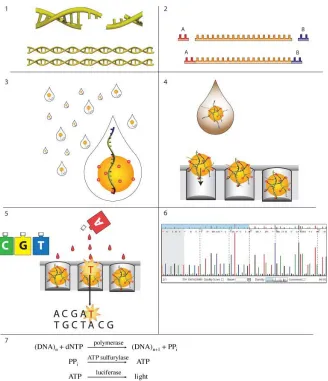
procedure are described in (Margulies et al. 2005). Although originally designed for the purpose of genome sequencing, the same technology can be used to measure gene expression by simply converting expressed RNA into cDNA. To begin, the cDNA is broken into small
double-stranded fragments using a nebulizer (Figure 1-3, Panel 1). The resulting fragments typically range from 50-900 base pairs in length, with a mean size of about 325 base pairs.
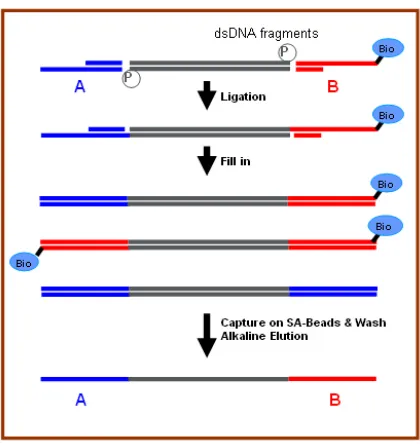
Next, “adaptors” are attached to both ends of the DNA fragments (Figure 1-3, Panel 2; Figure 1-4). Once the adaptors have been attached, the DNA fragments are electrophoresed through an agarose gel to separate the fragments according to length. Fragments in the
length range of 250-500 base pairs are retained. The nicks at the 3’ junctions between the adaptors and the fragments are then repaired, and the overhangs are filled in.
In order to isolate single stranded DNA fragments having an A adaptor on one end and a B adaptor on the opposite end (configuration A-dsDNA-B in Figure 1-4), the following procedure is utilized: first the DNA are washed through a column of Streptavidin beads
allowing the A-dsDNA-B and the B-dsDNA-B fragments to adhere to the column, while the A-dsDNA-A fragments are eluted. Next, the column is washed with a melting solution which causes the remaining double stranded A-dsDNA-B and B-dsDNA-B DNA fragments
to separate into single stranded fragments. Furthermore, one of the A-ssDNA-B fragments will lack a biotin tag, and therefore elute through the column while the B-ssDNA-B
fragments and the other single A-ssDNA-B fragments remain attached to the beads.
In the next step, the eluted single-stranded DNA library is attached to DNA capture beads. Each of the DNA capture beads is joined to oligonucleotide primers that are
process of limiting dilution: a very dilute solution of the DNA library is annealed to a vast excess of the beads such that it is highly improbable that any bead will anneal to more than one DNA molecule. The beads are then suspended in a water-in-oil emulsion along with a
PCR reaction mixture (Figure 1-3, Panel 3). Each tiny droplet serves as a microreactor, in which the single DNA strands are amplified into millions of copies per bead. When the PCR
reactions have completed, the emulsion is broken, and the millions of amplified, double stranded DNAs on each bead are converted to single stranded DNAs using a melting solution. While approximately zero beads will contain more than one species of DNA as a
result of the limiting dilution, many beads will have no DNA attached. In order to remove the majority of these “null beads,” an enrichment procedure is performed in which a 40 base
pair primer is mixed in with the beads. This primer, which is partially complementary to the 3’ adaptor and which has a biotin tag attached, binds to the DNA-containing beads. Next, Streptavidin beads are added to the mixture, and the biotin-attached capture beads adhere to
them. A magnet is used to separate these Streptavidin beads from the null DNA capture beads, which are discarded, and then the Streptavidin beads and biotin tagged primers are released from the capture beads with an application of melting solution.
Now, the beads are placed on a fiber optic plate (Figure 1-3, Panel 4), which is made of individual fiber optic core threads packed tightly together, side-by-side. Etched into each
of the fiber optic threads is a tiny 75 pico-liter well. The size of the wells is such that each one can accommodate exactly one of the DNA capture beads, which are loaded onto the plate along with luciferase, ATP sulfurylase, sequencing primer and DNA polymerase. After the
are ready to undergo a series of massively parallel, sequencing-by-synthesis reactions. In a series of cycles, reaction mixture containing a single species of nucleotide (A,C,G or T) is washed across the fiber optic plate (Figure 1-3, Panel 5). If this particular nucleotide is
complimentary to the next base pair on one of the single stranded DNA’s, it is incorporated into the growing double-stranded chains by DNA polymerase, and a series of chemical
reactions occurs culminating in the conversion of ATP into light by luciferase (Figure 1-3, Panel 7). This light is then conveyed through the fiber optic tubules and automatically measured, with the amount of light from each well roughly proportional to number of
sequential nucleotides being incorporated. This linearity is maintained for strings of up to eight consecutive repeated nucleotides; above that, it becomes difficult to accurately quantify
the number of nucleotides from the measured light. After each nucleotide is added, a solution containing apyrase is washed over the wells to quench any residual luciferase reactions and complete the cycle. Then the next nucleotide is added and a new cycle begins. Nucleotides
are added in this manner in a sequential fashion, e.g. A-C-G-T-A-C-G-T-A-C-G-T, etc. By measuring the amount of light emitted from each well at each step, in correlation with the order in which the nucleotides are added, it is possible to accurately determine the sequence
of the single stranded DNA fragment attached to the bead in each well (Fig 1.3, Panel 6). During the incorporation of each nucleotide, a small fraction of the amplified strands on each
bead can become out of synch. The effect, however, is cumulative, and this places an upper limit to the length of accurate reads. The first generation of sequencing machines were capable of average read lengths of around 110 base pairs. The more recent hardware has
In the final step of the analysis, if no reference genome is available, the fragments need to be combined in a manner analogous to sequence assembly from traditional shotgun sequencing. However, because the read length is currently much shorter than the length of
Sanger sequencing reads, greater coverage of the genome may be required to achieve the Figure 1-3. Steps in Roche/454 Life Sciences pyrosequencing (Ellengren,
same level of assembly completeness. If a reference genome is available, the reads can instead simply be aligned to the reference using a program such as BLAT (Kent, 2002).
Illumina / Solexa Sequencing
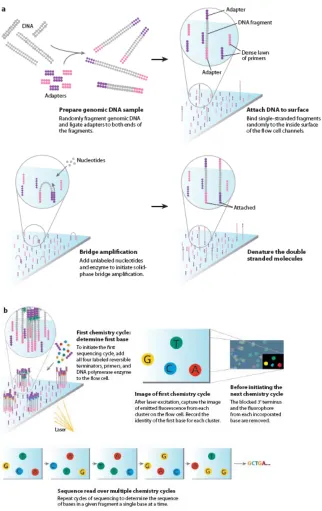
Transcriptome sequencing with the Illumina platform typically begins by using
sonication to shear RNAs into fragments that are then used to construct complimentary cDNA. Generic work flows are described in (Mardis, 2008; Metzker, 2008; see also, Figure
Figure 1-4. Pyrosequencing adaptors (Marguiles et al., 2005).
1-5). Adaptors are attached to both ends of the fragments, and single-stranded fragments are randomly attached to the solid surface of a flow cell. The flow cell surface also contains a dense lawn of primers that are complementary to the adaptors.
Next, a technique known as “bridged amplification” is used to make many copies of each of the individual cDNA fragments adhering to the surface. This step is important
because it ensures that the subsequent sequencing-by-synthesis reactions will produce adequate signal for detection by the optical instrumentation. During bridge amplification, the attached cDNA fragments bend towards the surface so that their free ends also come into
contact with the surface. Since the free ends are attached to adaptors that are complementary to the primers on the surface, they bind to the surface of the flow cell, forming a “bridge.” At
this point, the primers are used for a round of DNA synthesis by DNA polymerase. After several rounds of synthesis and denaturization, the result is millions of individual, homogeneous cDNA clusters, each containing about 1 million copies of a single original
fragment.
After this preliminary step, the stage is set for the subsequent sequencing by synthesis reactions. First, primer is added to the attached fragments, and then, in each sequencing
round, all four nucleotide bases are added simultaneously. Each of the four nucleotide bases is given a unique fluorescent label. In addition, the 3’ hydroxyl group is chemically blocked
so that only one base can be added at a time. During each synthesis cycle, a single base is incorporated into each growing oligonucleotide chain. Then, the fluorescent labels are excited and the resulting light is detected and recorded by a specialized optical instrument.
sequencing reaction can continue in the next round. By keeping track of the colors of light originating from different locations on the surface, the sequencing machinery is able to accumulate sequence information for millions of short cDNA fragments in parallel. In the
first generation of equipment, these fragments ranged in length from about 25-35 base pairs. Each flow cell has 8 separate lanes, each of which can be loaded with a different sample.
Following the sequencing reactions, it is necessary to perform the same basic data analysis steps required with 454 sequencing. However, because the number of reads is so much greater, and the length of those reads, so much shorter, it is generally necessary to use a
Figure 1-5. Illumina sequencing (Mardis, 2008).
Microarray Quality Assessment
Sources of variability
As with any biological experiment, the goal of a typical microarray study is to identify meaningful variation between treatments while controlling for random technical and biological noise. However, the generation of reliable microarray data involves many steps,
and often things go wrong. Because of this, recent efforts have emphasized the need for rigorous quality control, as well as procedures and metrics designed to assist researchers in
identifying low quality data. Here we consider some of the various sources of error that may occur during a typical microarray experiment. The following list is not exhaustive, but does highlight several important factors influencing the outcome for a typical microarray
experiment. For concreteness, the Affymetrix GeneChip platform is assumed. The ordering of the list roughly follows the sequence of steps in an array analysis, from design and
manufacturing of the chips through analysis of the data:
Sub-optimal probes and cross hybridizations. Probe selection is a very important aspect of microarray design. Unfortunately, we do not yet completely understand how probe sequence translates to binding affinity. Microarrays are subject to cross-hybridization from partially complimentary sequences, and this effect is difficult to
predict or quantify. Even for perfectly complimentary target and probe pairs, there are differences in binding affinity that are difficult to model.
mistakes can occur. More commonly, slides can be damaged at any point during their lifecycle, including during shipping and storage.
RNA degradation. All biological samples contain varying amounts of enzymes (nucleases) which function to digest RNA. These continue to be active even after the death of the cell or tissue from which the RNA is extracted. Furthermore, nucleases
are prevalent in the environment, and extreme caution must be exercised not to introduce exogenous nucleases into a sample during an experiment.
Sample contamination. Depending on the sample preparation procedure, numerous opportunities for sample contamination may occur. For example, in some cases RNA
is extracted from specific organs or tissues, which may be difficult to properly isolate under certain conditions. It is also possible to contaminate samples with foreign RNA or DNA, for example from bacteria or viruses present in the environment. It is even
possible (but hopefully rare) to inadvertently mislabel or switch samples during an analysis.
Improper storage of reagents. The Affymetrix microarray preparation protocol is fundamentally a sequential series of chemical reactions. In order for these reactions
to proceed efficiently according to specifications, proper storage of reagents is necessary.
Transcription efficiency. The first steps in preparation of an RNA sample for hybridization involve reverse transcription reactions that copy RNA into cDNA; these
transcripts, a bias has been introduced.
PCR amplification. Similarly, during sample preparation, it is usually necessary to perform a PCR step in order to amplify the small amounts of RNA present in the original sample. While the goal is to have the resulting amount of RNA proportionate to the starting amount of each transcript, it is possible that bias can be introduced if
the PCR reactions proceed with differing efficiency for different transcripts or samples.
Spot identification. Quantification of the relative hybridization occurring at each probe involves averaging the signal observed at each of the microarray features. This
requires identifying the edges of each feature “spot,” subtracting any contaminating background intensity and producing a composite average raw intensity to serve as a proxy for hybridization at the underlying probes. Numerous opportunities for
introducing error exist during this process.
Spatial artifacts. If the target solution is not evenly applied during hybridization, numerous bubble effects and edge effects can occur. Unfortunately, these spatial artifacts are not uncommon.
Paralogous sequences. In most organisms there are many sets of paralogous genes having highly similar sequences. These genes are one source of cross-hybridization
effects that can influence observed intensities.
presence of alternatively spliced gene variants can confound the observed signal for the constitutive isoforms.
Normalization method. The goal of normalization procedures is to remove systematic biases among a set of microarray slides. However, there are many different normalization procedures, and each method is based on a set of specific assumptions.
Unfortunately, the method of normalization chosen can greatly influence the outcome of an experiment, and in some cases normalization can introduce unwanted biases
into the measured gene expression levels.
Above background detection. Microarrays have a finite dynamic range, and features having low signal levels often originate due to background signal and cross-hybridization. It is important to exclude low intensity signals from an analysis, but it is not always clear what threshold to use for this determination, and this decision can
have an impact on the analysis results.
Saturation effects. At the other extreme of the spectrum, genes expressed at very high levels may saturate their corresponding probes. In these cases, it will not be possible to obtain accurate measurements for expression differences between transcription
levels of these genes.
Probeset averaging. For most applications, the multiple probe pairs in a probeset are combined to produce a composite signal intended to represent overall expression for the target gene. However, this averaging approach can, unfortunately, obscure the
Analysis methods. A whole spectrum of analysis methods exists for comparing microarray expression levels. These range from simple fold change comparisons to
detailed linear models and sophisticated Bayesian estimation procedures. The statistical analysis method employed can have large impact on the resulting lists of differentially expressed genes.
Sample size. Although microarrays are a very cheap way to get high-throughput gene expression measurements, as compared to other alternative methods like SAGE, EST
libraries, rt-PCR, and, more recently, high-throughput sequencing technologies, most microarray experiments have, nevertheless, been limited by small sample sizes. It is
not uncommon for researchers to allocate only 2 or 3 slides per individual treatment. Because of this, it is often very hard to get reliable estimates of the means and variances of gene expression levels for these treatments, and robust comparisons can
be difficult even with quality data.
Biological noise. Even when everything else goes well, it is still possible for results to be confounded by uncontrolled biological variability. Biological systems are inherently complex, and it is always possible that a subset of the experimental units is
in a completely different “state” than the others. A typical mammalian organ is a mixture of a wide variety of distinct cell types, each of which may be reacting to a
distinct set of environmental signals; a study of gene expression in the liver, for example, would be comprised of a complex mixture of distinct expression patterns. Similarly, an unhealthy organism could react very differently to a treatment than a
For array types other than Affymetrix GeneChips, various additional sources of error are also possible. For example, two color arrays are subject to “dye bias” effects, i.e. differential
affinity of the dyes used to label the two samples compared. It has even been observed that local ozone concentrations can have a noticeable affect on dye affinities (“Making the most
of Microarrays,” 2006, p.1039). The bottom line is that there is considerable variance inherent in microarray measurements. Given the fact that biological systems are already highly complex and variable, and the fact that small sample sizes are often necessary, it is
paramount to make efforts to identify and manage controllable sources of variance.
Review of Popular Quality Metrics
Having established the importance of quality control metrics, our discussion now turns to a few of the more popular metrics used in practice. These metrics can be divided into
two broad categories: pre-hybridization metrics and post-hybridization metrics.
Pre-hybridization quality metrics are used to measure the quality of an RNA sample before the sample is actually hybridized to a microarray slide. Ideally, if there is some quality problem with an RNA sample, this problem would be detected prior to hybridization, before continuing the analysis and incurring the expense and wasted effort of following
through with corrupted data. Popular pre-hybridization metrics include the 28S/18S rRNA ratio (Sambrook, et al., 2001), the RNA integrity number (RIN) (Schroeder, et al., 2006), the
Even in the cases where pre-hybridization quality checks suggest that the initial RNA sample is of high quality, there are still many sources of error that can occur during the course of an RNA experiment. For this reason, it is also critical to measure microarray data
quality after the sample has been hybridized to the chip, scanned and converted into raw intensity measurements. For example, for the Affymetrix microarray platform, several
post-hybridization quality assessment metrics are included with the manufacturer’s analysis software (Affymetrix, 2003); it is also possible to compute these metrics using the free R “simpleaffy” package (Wilson and Miller, 2005). In addition, the R BioConductor package
(Gentleman, et al., 2004) contains additional facilities for assessing the post-hybridization quality of Affymetrix microarray data. The software contains a variety of useful diagnostic
plots that are often applied in conjunction with the standard Affymetrix quality control metrics discussed above (see Gentleman, et al., 2005.) It is also possible to derive numerical statistics from these plots, and this approach has been used to produce software for
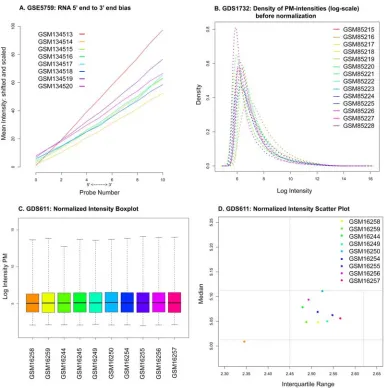
Figure 1-6. Examples of microarray quality assessment diagnostics.
5’ to 3’ RNA degradation plot
The 5’ to 3’ RNA degradation plot (Figure 1-6a), which can be produced using the
BioConductor “affy” package (Gautier, et al., 2004), shows the relationship between signal Figure 1-7. Additional microarray quality assessment diagnostics.
intensity and probe position within each multi-probe probeset. To produce this graph, the individual probes within each probeset are ordered according to their position within the probeset, in the 5’ to 3’ direction. For each chip, the average signal at each probe position is
computed across all probesets, and plotted as a function of probe position. In addition, a linear regression may be performed to model signal intensity as a function of probe position
(assuming equal spacing of probes within the probesets). An upward slope is expected, since in almost all samples there is some RNA degradation, which occurs in the 5’ to 3’ direction. In general, outlier chips can be identified by looking for chips having slopes that are very
different than the others; this may indicate, for example, an inconsistency in sample handling that has introduced additional variance for this chip.
Raw intensity distribution
Another useful diagnostic approach is to plot the raw intensity distribution for each
chip prior to normalization. While it is reasonable to expect small differences among the chips, too much variation may indicate data quality problems. For example, Figure 1-6b
shows the raw intensity plot for GEO experiment GDS1732. The intensity distribution for chip GSM85216 seems to be skewed to the right with more density at higher intensities.
Normalized intensity distribution
A comparison of signal distributions after normalization is probably an even better
values for chip GSM16258 appear to be different from the other chips in the experiment, with the apparent magnitude of this difference depending on the nature of the visualization method employed.
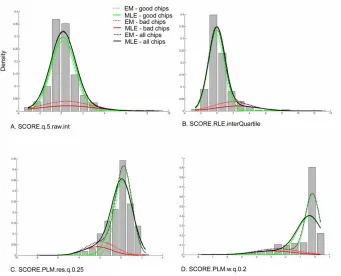
PLM weights and residuals
The probe level summarization model is another often-used quality control indicator. As described in (Gentleman, et al., 2005), the BioConductor affyPLM package contains functionality to fit (using a median polish procedure) a probeset summarization model for
each probeset:
log(Ygji)gi gj gji
where giis the log-scale expression level for gene g on array i, gjis the effect of the j
th
probe for gene g, and gijis the error measurement. An important assumption of this model is
that the expected value of gijis zero. A plot of the residuals from this model, as well as the
weights used by the regression procedure to down-weight outlier probes, may reveal irregularities in the data. For example, Figure 1-7a shows that the residuals plot for sample
GSM16258 from GEO dataset GDS611 indicates a large field of highly positive residuals (red) and another field of highly negative residuals (blue). In addition, the PLM weights plot
(Figure 1-7b) indicates a large set of highly down-weighed probes (dark-green area).
RLE box plot
Given the normalized (log-scale) expression values, the RLE box plot displays the
measurement for probeset g, on chip i, and mg is the median expression of probeset g across
all arrays. In general, since it is normally assumed that the majority of genes are not differentially expressed across chips, the quantity Mgi is ordinarily expected to be distributed
with median 0. Figure 1-7c shows the RLE box plot from GEO dataset GDS515. Several of the chips seem to have larger variance in the RLE distribution, and a few of the medians
appear to deviate significantly from zero.
Microarray Quality Assessment Summary
The previous discussion has emphasized the importance of quality control in the analysis of microarray data. In addition, a variety of popular quality control methods were
described. However, due to space constraints, many other important metrics were not covered here. For example, spike-in controls are available to assist with the determination of Affymetrix GeneChip data quality (Affymetrix, 2003), while NUSE plots, hierarchical
clustering, and pairwise correlations are also available as part of the BioConductor library (Gentleman, et al., 2005). Furthermore, recent research has focused specifically on detection
of spatial artifacts (e.g. Reimer and Weinstein, 2005; Stokes, et al., 2007). Recent research has also explored the development of similar metrics for RNA-Seq data (e.g. Morgan, et al., 2009).
One difficulty for all of the metrics explored is that it is often not clear how to separate “good” quality scores from “bad” quality scores – the use of an arbitrary threshold is
recommendations. Furthermore, since many of the metrics measure different aspects of quality, it is usual practice to use one or more metrics simultaneously, but it is not always clear what quality decision to make when these metrics give conflicting scores.
Nevertheless, it is generally assumed that even a relatively naive use of some of these metrics will detect the most adverse cases of low quality data. Ongoing research is required to
identify the best metrics to use in various scenarios, the distributional properties of these metrics, and efficient ways to combine them to generate useful composite quality scores. The topic of the next chapter is a new method for identifying low quality microarray data
using quality metrics like the ones reviewed here.
References
Affymetrix, Inc. GeneChip expression analysis, data analysis fundamentals. Affymetrix 2003, Santa Clara, CA. Retrieved June 1, 2007 from http://www.affymetrix.com/support/downloads/manuals/data_analysis_fundamentals_manual.pdf.
Alon U, Barkai N, Notterman DA, Gish K, Ybarra S, Mack D, Levine AJ. Broad patterns of gene expression revealed by clustering analysis of tumor and normal colon tissues probed by oligonucleotide arrays. Proc Natl Acad Sci USA 1999, 96:6745– 6750.
Auer H, Lyianararchchi S, Newsom D, Klisovic MI, Marcucci G, et al. Chipping away at the chip bias: RNA degradation in microarray Analysis. Nature Genetics 2003, 35:292-293.
Bammler T, Beyer RP, Bhattacharya S, Boorman GA, Boyles A, Bradford BU, et al. Standardizing global gene expression analysis between laboratories and across platforms. Nature Methods 2005, 2: 351–356
Blencowe BJ. Alternative Splicing: New insights from global analysis. Cell 2006, 126: 37-47.
Carmi I. Molecular Biology Select: Taking a Peak at Piwi RNAs. Cell 2006 126(2):223 Cheung HC, Baggerly KA, Tsavachidis S, Bachinski LL, Neubauer VL, Nixon TJ, Aldape
KD, Cote GJ, Krahe R. Global analysis of aberrant pre-mRNA splicing in glioblastoma using exon expression arrays. BMC Genomics 2008, 9:216.
Clark TA, Schweitzer AC, Chen TX, Staples MK, Lu G, Wang H, Williams A, Blume JE. Discovery of tissue-specific exons using comprehensive human exon microarrays. Genome Biology 2007, 8(4):R64.
Copois V, Bibeau F, Bascoul-Mollevi C, Salvetat N, Chalbos P, et al.: Impact of RNA degradation on gene expression profiles: assessment of different methods to reliably determine RNA quality. Journal of Biotechnology 2007, 127(4):549-59. Dühring U, Axmann IM, Hess WR, Wilde A. An internal antisense RNA regulates
expression of the photosynthesis gene isiA. PNAs 2006 103(18):7054-58.
Ellegren H. Sequencing goes 454 and takes large-scale genomics into the wild. Molecular Ecology 2008, 17:1629-35.
The ENCODE Project Consortium. Identification and analysis of functional elements in 1% of the human genome by the ENCODE pilot project. Nature 2007, 447 :799-816.
Fire A, Xu S, Montgomery MK, Kostas SA,Driver SE, Mello CC. Potent and specific genetic interference by double-stranded RNA in Caenorhabditis elegans. Nature 1998, 391:806-811.
French PJ, Peeters J, Horsman S, Duijm E, Siccama I, van den Bent MJ, Luider TM, Kros JM, van der Spek P, Sillevis Smitt PA. Identification of differentially regulated splice variants and novel exons in glial brain tumors using exon expression
arrays. Cancer Research 2007, 67(12):5635-42.
Gardina PJ, Clark TA, Shimada B, Staples MK, Yang Q, Veitch J, Schweitzer A, Awad T, Sugnet C, Dee S, Davies C, Williams A, Turpaz Y. Alternative splicing and differential gene expression in colon cancer detected by a whole genome exon array. BMC Genomics 2006, 7:325.
Gentleman RC, Carey VJ, Bates BM, Bolstad B, Dettling M, et al.: Bioconductor: open software development for computational biology and bioinformatics. Genome Biology 2004, 5(10):R80.
Gentleman R, Carey V, Huber W, Irizarry R, Dudoit S: Bioinformatics and Computational Biology Solutions Using R and Bioconductor. New York: Springer; 2005.
Golub TR, Slonim DK, Tamayo P, Huard C, Gaasenbeek M, Mesirov JP, Coller H, Loh ML, Downing JR, Caligiuri MA, Bloomfield CD, Lander ES. Molecular classification of cancer: class discovery and class prediction by gene expression monitoring. Science 1999, 286:531–537.
Graveley BR. Alternative splicing: increasing diversity in the proteomic world. Trends in Genetics 2001, 17(2):100-107.
Griffiths-Jones S. The microRNA Registry. NAR 32(Database Issue) 2004:D109-D111.
Heber S, Sick B: Quality assessment of Affymetrix GeneChip data. OMICS: A Journal of Integrative Biology 2006, 10(3):358-68.
Hertel KJ. Combinatorial control of exon recognition. Journal of Biological Chemistry 2008, 283(3):1211-5.
Hobert O. Common logic of transcription factor and microRNA action. Trends in Biochemical Sciences 2004, 29(9):462-8.
Hobert O. Gene regulation by transcription factors and microRNAs. Science 2008, 319:1785-1786.
Howard BE, Sick B, Heber S. Practical Quality Assessment of Microarray Data by Simulation of Differential Gene Expression. In Mandoiu I, Narasimhan G, Zhang Y (Eds.), Proceedings of the 5th
International Symposium on Bioinformatics Research and Applications 2009 (ISBRA 2009), Ft. Lauderdale, FL, p 18-27.
Jares P. DNA microarray applications in functiona genomics. Ultrastructural Pathology 2006, 30(3):209-19.
Kant MR, Baldwin IT. The ecogenetics and ecogenomics of plant-herbivore interactions: rapid progress on a slippery road. Current Opinion in Genetics and Development, 17(6):519-24.
Kent WJ. BLAT: The BLAST-Like Alignment Tool. Genome Research 2002, 12:656-664. Kwan T, Benovoy D, Dias C, Gurd S, Serre D, Zuzan H, Clark TA, Schweitzer A, Staples
MK, Wang H, Blume JE, Hudson TJ, Sladek R, Majewski J. Heritability of alternative splicing in the human genome. Genome Research 2007, 17(8):1210-18. Li X, Quigg RJ, Zhou J, Gu W, Rao PN, Reed EF. Clinical Utility of Microarrays:
Current Status, Existing Challenges and Future Outlook. Current Genomics 2008, 9: 466-474.
Making the most of microarrays. Nature Biotechnology 2006, 24:1039.
Mardis ER. Next-generation DNA sequencing methods. Annual Review of Genomics and Human Genetics 2008, 9:387-402.
Margulies M, et al. Genome sequencing in microfabricated high-density picolitre reactors. Nature 2005, 437:376-80.
Marton MJ, DeRisi JL, Bennet HA, Iyer VR, Meyer MR, et al. Drug target validation and identification of secondary drug target effects using DNA microarrays. Nature Medicine 1998, 4(11):1293-301.
Metsker ML. Sequencing technologies – the next generation. Nature Reviews Genetics 2008, 9(11), poster.
Morgan M, Anders S, Lawrence M, Aboyoun P, Pages H, Gentleman R. ShortRead: a Bioconductor package for input, quality assessment, and exploration of high throughput sequence data. Bioinformatics 2009, August 3 [Epub ahead of print]. Nuwaysir EF, Bittner M, Trent J, Barrett JC, Afshari CA. Microarrays and toxicology: the
advent of toxicogenomics. Molecular Carcinogenesis 1999, 24(3): 153-9. Pray LA. Eukaryotic genome complexity. Nature Education 2008, 1(1).
Multiclass cancer diagnosis using tumor gene expression signatures. Proc Natl Acad Sci USA 2001, 98:15149–15154.
Reimer M, Weinstein JN: Quality assessment of microarrays: visualization of spatial artifacts and quantitation of regional biases. BMC Bioinformatics 2005, 6:166. Sambrook J, Russel DW. Molecular Cloning: A Laboratory Manual, 34d ed. Cold Spring
Harbor Laboratory Press 2001, Cold Spring Harbor, NY.
Sarnow P, Jopling CL, Norman KL, Schutz S, Wehner KA. MicroRNAs: expression, avoidance and subversion by vertebrate viruses. Nature Reviews, Microbiology 2006, 4:651-59.
Schroeder A, Mueller O, Stocker S, Salowsky R, Leiber M, et al. The RIN: an RNA integrity number for assigning integrity values to RNA measurements. BMC Molecular Biology 2006, 7:3.
Sharp PA. The centrality of RNA. Cell 2009, 136(4):577-580.
Stokes TH, Moffitt RA, Phan JH, Wang MD: chip artifact CORRECTion (caCORRECT): a bioinformatics system for quality assurance of genomics and proteomics array data. Annals of Biomedical Engineering 2007, 35(6):1068-80.
Singh D, Febbo PG, Ross K, Jackson DG, Manola J, Ladd C, Tamayo P, Renshaw AA, D’Amico AV, Richie JP, Lander ES, Loda M, Kantoff PW, Golub TR, Sellers WR. Gene expression correlates of clinical prostate cancer behavior. Cancer Cell 2002, 1:203–209.
van’t Veer LJ, Dai H, van de Vijver MJ, He YD, Hart AA, Mao M, Peterse HL, van der Kooy K, Marton MJ, Witteveen AT, Schreiber GJ, Kerkhoven RM, Roberts C, Linsley PS, Bernards R, Friend SH. Gene expression profiling predicts clinical outcome of breast cancer. Nature 2002, 415:530–536.
Velculescu VE, Zhang L, Zhou W, Vogelstein, Basrai MA, et al. Characterization of the Yeast Transcriptome. Cell 1997, 88(2):243-251.
Wang T, Hopkins D, Schmidt C, Silva S, Houghton R, Takita H, Repasky E, Reed SG. Identification of genes differentially over-expressed in lung squamous cell carcinoma using combination of cDNA subtraction and microarray analysis. Oncogene 2000, 19:1519–1528.
Watanabe T, Taked A, Tsukiyam T, Mise K, Okuno T, et al. Identification and characterization of two novel classes of small RNAs in the mouse germline: retrotransposon – derived siRNAs in oocytes and germline small RNAs in testes. Genes and Development 2006, 20(13):1732-1743.
Chapter 2
UNSUPERVISED ASSESSMENT OF
MICROARRAY DATA QUALITY USING A
GAUSSIAN MIXTURE MODEL
Brian E Howard, Beate Sick, Steffen Heber
Abstract
Quality assessment of microarray data is an important and often challenging aspect of
gene expression analysis. This task frequently involves the examination of a variety of summary statistics and diagnostic plots. The interpretation of these diagnostics is often subjective, and generally requires careful expert scrutiny. We show how an unsupervised
classification technique based on the Expectation-Maximization (EM) algorithm and the naïve Bayes model can be used to automate microarray quality assessment. The method is
flexible and can be easily adapted to accommodate alternate quality statistics and platforms. We evaluate our approach using Affymetrix 3’ gene expression and exon arrays and compare the performance of this method to a similar supervised approach. This research illustrates the
efficacy of an unsupervised classification approach for the purpose of automated microarray data quality assessment. Since our approach requires only unannotated training data, it is
easy to customize and to keep up-to-date as technology evolves. In contrast to other “black box” classification systems, this method also allows for intuitive explanations.
Background
Recently, the MicroArray Quality Control (MAQC) consortium found that most microarray platforms will generate reproducible data when used correctly by experienced
researchers (Shi, et al., 2006). Despite this positive result, it has been suggested that 20% or more of the data available in public microarray data repositories may be of questionable
microarray data is of the highest importance, and several recent publications have dealt with this problem; detailed reviews are provided by Wilkes et al. (2007) and Eads et al. (2006).
Several approaches have emphasized the importance of measuring, either directly or
indirectly, the integrity of the RNA samples used in the experiment (e.g. Copois et al., 2007; Archer et al., 2006; Jones et al., 2006). Other research has focused on spatial artifacts: problems that typically arise during hybridization due to bubbling, scratches and edge effects (Reimer et al., 2005; Stokes et al., 2007).
In the case of Affymetrix GeneChips, which we will use to demonstrate our method,
there are standard benchmark tests provided by the manufacturer (Affymetrix, Inc., 2003). A standard complementary approach is to use the R statistical software, along with the
BioConductor (Gentleman et al., 2004) “affy” (Gautier et al., 2004) and “affyPLM” (Bolstad, 2007) packages, to produce a series of diagnostic plots for the assessment of GeneChip quality (see Figure 1-6 and Figure 1-7). A review of the quality control features
available in BioConductor can be found in (Gentleman et al., 2005), and a variety of software packages are now available to assist in the automation of this process (Heber and Sick, 2006; Psarros, et al. 2005; Howard, et al. 2007; Lee, et al.2006; Lozano and Kalko, 2006).
In general, the goal of these approaches is to identify chips that are outliers - either in relation to other chips in the same experiment or the entire theoretical population of similar
after a preponderance of the evidence indicates poor quality; a slightly unusual score on a single metric is frequently ignored, while a number of moderately or highly unusual scores on a variety of quality metrics is often grounds for exclusion of a particular chip from further
analysis. However, there are no universal, robust thresholds available for the identification of outliers according to the various quality variables. Instead, decisions are necessarily made
using historical data, either implicitly or explicitly.
Therefore, recent efforts have focused on providing a “holistic”, accurate, and automatic interpretation of diagnostic plots and quality metrics. Burgoon et al. (2005)
describe a custom, in-house protocol for assessing data quality of two-color spotted cDNA arrays. The authors advocate an integrated “Quality Assurance Plan” which attempts to
integrate quality control at every level of the experimental procedure. Another example is the RACE system (Heber and Sick, 2006; Psarros, et al. 2005). This system utilizes various statistics extracted from the BioConductor diagnostic plots, along with a random forest
classifier, to automatically identify low quality data. However, like the quality assurance protocol described by Burgoon et al., the RACE system relies on a large expert-annotated data set. For this reason, it is difficult to keep the system up-to-date in the face of rapidly
changing technology, with new chip types continually being introduced into the market. A further challenge is to adapt such a system to similar, but slightly different, types of data such
as Affymetrix SNP arrays, exon arrays, or arrays produced by other manufacturers such as Illumina and Agilent.
In this paper we investigate a method for unsupervised classification that was