Evaluation of Longitudinal Proton Structure
Function and Gluon Momentum Distribution
by Thermodynamical Bag Model
K.Ganesamurthy*, A.Mosesraj1, C.Ramesh2, V.Rajagopal3
Associate Professor, PG & Research Department of Physics, Urumu Dhanalakshmi College, Trichy, Tamil Nadu, India*
Research Scholar, PG & Research Department of Physics, Urumu Dhanalakshmi College, Trichy, Tamil Nadu, India1 Research Scholar, PG & Research Department of Physics, Urumu Dhanalakshmi College, Trichy, Tamil Nadu, India2 Research Scholar, PG & Research Department of Physics, Urumu Dhanalakshmi College, Trichy, Tamil Nadu, India3
ABSTRACT: We evaluate the unpolarized and longitudinal structure function of proton separately in the moderate kinematic region at low order square four momentum transfer and gluon momentum distribution in the large x region at Q2 = 3 GeV2 and 10 GeV2 by Thermodynamical Bag Model(TBM). The evaluated structure function results are compared with JLab experimental data and gluon momentum distribution evaluation is compared with world data, NNPDF and DSSV fit collaboration data. Theoretical results are in good agreement with the experimental results and obtain the integral value of gluon in different kinematic region at Q2 = 10 GeV2 which is consistent with NNPDF and DSSV fit.
KEYWORDS: DIS, Lonitudinal structure function, gluon momentum distribution, TBM
I.INTRODUCTION
Since few decades, the structure function of the nucleon is extracted from inclusive lepton-nucleon cross section as measured in Deep Inelastic Scattering (DIS). In this measurement, the longitudinal structure function of proton FL is
proportional to the cross section through the interaction of virtual photon and nucleon. In quark parton model, F2 is the
sum of the quark and anti-quark distributions weighted square of the electric charge of quarks in which FL is zero. In
Quantum Chromo Dynamics (QCD) model, FL has non zero quantity which is due to the contribution of quarks and
gluons[1]. From the measurement of longitudinal structure function, gluon distribution can be extracted and provides a sensitive test of the perturbative Quantum Chromo Dynamics (pQCD)[2-3].
In general, the experimental determination of FL is difficult and it requires a measurement of the inelastic cross
section at the same values of Bjorken variable x and square four momentum transfer Q2 with incoming beam energy has different center of mass energy which was achieved electron-proton collider at HERA by changing the proton energy with fixed lepton energy. HERA[4] collected electron-proton data with H1 and ZESUS detector at a positron beam energy of 27.5GeV and proton beam energies 920,575 and 460 GeV which is allowed the measurement of structure function in kinematic region
6
.
5
10
4
x
0
.
65
at0
.
2
Q
2
800
GeV2.Several experiments are investigated of FL on low kinematic region for the extraction of gluon density. Monghan[5]
extracted lowest moment of FL at
0
.
75
Q
2
45
GeV2 in the low kinematic region. This result reveals need forwhether increased high x gluon distribution is possible given its large uncertainty or possibly non-negligible higher twist effects. Aaron et.al[6] presented the measurement of FL in low x region at 12 Q2 90GeV2. This result
transverse structure functions in the resonant region in the squared four momentum transfer 0.2 < Q2 < 5.5 GeV2 at high x region. The longitudinal structure function is found to be substantial. Boroun[8] estimated the dynamical behavior of FL at low x and high Q2. This result shows that the contribution of heavy quark in the measurement of FL is
considerable and cannot be vanished. In the present work, we focus large kinematic region and theoretical results are compared with JLab E00-002[9], NNPDF[10] and DSSV fit[11-12].
II. MATERIALS AND METHODS
The Methods used to Evaluate Longidudinal Proton Structure Function is Thermodynamical Bag Model.
III. THERMODYNAMICAL BAG MODEL
Thermodynamical Bag Model (TBM)[13-17] is modified from MIT bag model in which quarks and gluons are treated as fermions and bosons respectively. The invariant mass(W) of the final hadron and the equation of states can be expressed as
2 2
2
2
M
Q
M
W
… (1)2 3 2
2
)
(
6
uu u
u
T
V
n
n
… (2)2 3 2
1
)
(
6
dd d
d
T
V
n
n
… (3)Where V is the volume of bag, B is the bag constant, W is the invariant mass of excited nucleon at T,
is the energy transfer, Q2 is square of four momentum transfer, M is the mass of the nucleon at ground state,6
(
n
u
n
u)
is number density of up quark,6
(
n
d
n
d)
is the number density of down quark, μuis the chemical potential of up quark and μdis the chemical potential of down quark. Solving equations (1),(2) and (3) simultaneously we obtain the up and down quark chemical potentials with fixed Q2 at any temperature. Here temperature and chemical potentials are evaluated for fixed Q2. The total energy density ε(T) of the bag can be written by the sum of energy densities of up quark, down
quark and gluon is given by
4 2 2 2 4
2 u
120
7
4
1
8
1
u u u
T
T
… (4)4 2 2 2 4
2 d
120
7
4
1
8
1
d d d
T
T
… (5)
30
4 2
g
T
… (6)
(
T
)
d
q(
uu)
d
q(
dd)
d
g
g … (7) Where dq = 6 and dg = 16 denotes the degeneracy of quarks and gluon orderly. The invariant mass is obtained by the 2 1 exp 1 ln 4 6 ) ,
( 2 2 2 Mx
T Tx M V Q x
qi i
… (8)
2 1 exp 1 ln 4 6 ) ,
( 2 2 2 Mx
T Tx M V Q x
qi i
… (9)
i
is the chemical potential of quark with the flavour ‘i’. Here ‘i’ denotes u or d quark. In order to relate the PDF’swith
QCD, which is quark gluon coupling parameter, we introduce the strong quark gluon coupling constant. The experimental fit could be made by considering only with the QCD corrections. The quark and anti-quark distributions are modified by including QCD parameters as,
2
)
(
1
)
,
(
)
,
(
2 2 2Q
Q
x
q
Q
x
q
i i s … (10)
2
)
(
1
)
,
(
)
,
(
2 22
q
x
Q
Q
Q
x
q
si
i … (11)
The strong running coupling constant ( s) for various Q2 is evaluated using the Next to Leading Order (NLO) solution.
)
/
ln(
))
/
(ln(ln(
1
)
/
ln(
4
)
(
2 2 0 2 2 1 2 2 0 2Q
Q
Q
Q
s
… (12)Where 0 = 11-(2
N
f /3) and 1 = 102-(38N
f /3). In order to account for heavy quark threshold correction and targetmass effect together, a substitution of x is made with
.2 / 1 2 2 2 2 2 2 2 )] / ) 1 )( / 4 ( 1 [(( 1 ) / ) 1 (( 2 Q m Q x M Q m x s
…(13)
ms is the mass of the strange quark. Here we assume strange quark mass as 100 MeV and ᴧQCD = 200 MeV.
IV. EVALUATION OF STRUCTURE FUNCTIONS
The structure function F1 and F2 are related by Callon-Gross equation[18],
2 1
2
xF
F
… (14) Structure function can be obtained by the quark distribution function and cross section for deep inelastic scattering. Using quark distribution functions of up and down quark and their anti-quarks, the unpolarized structure function of nucleon can be expressed as,
(
)
9
1
)
(
9
4
2
x
u
u
d
d
F
p …(15)
(
)
9
4
)
(
9
1
2
x
u
u
d
d
F
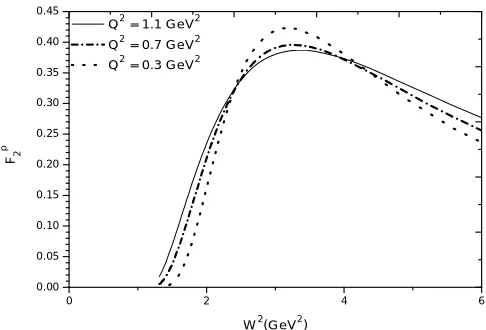
n …(16)quark momentum distribution for proton and neutron being merely equal and there is a greater probability of nucleon spin parallel to the target. The proton structure function as a function of W2(GeV2) at Q2 = 0.3,0.7 and 1.1 GeV2 as shown in figure 1.
The longitudinal structure function of proton can be written in terms of F1 and F2,
1 2
2 2
2
)
2
1
)(
,
(
x
Q
Q
xF
F
F
L
…(17)V. EVALUATION OF GLUON DISTRIBUTION
Here we consider a bag contains non-interacting valence quarks and sea quarks in gluons. The gluon distribution increases with increasing the temperature. At low temperature, proton contains only valence quarks. Gluon distribution can be written as,
T
Mx
Tx
M
V
x
G
2
exp(
1
ln
4
16
)
(
2 2
… (18)Gluon carried large amount of spin compared with valence quarks inside a proton. The spin carried by the gluons ∆g is
obtained using x for the spin dilution of the gluon. )
(x xG
g
… (19)
0 2 4 6
0.00 0.05 0.10 0.15 0.20 0.25 0.30 0.35 0.40 0.45
Q2 = 1.1 GeV2
Q2 = 0.7 GeV2
Q2 = 0.3 GeV2
F2
p
W2(GeV2)
0.1 0.2 0.0 0
0.0 2 0.0 4 0.0 6 0.0 8 0.1 0 0.1 2 0.1 4
JL ab T B M
FL
p
x Q2 = 0.5 G e V2
0.15 0.2 0.25 0.3 0.35 0.4
0.00 0.05 0.10 0.15 0.20
JLab TBM
FL
p
x
Q2 = 0.8 GeV2
0.3 0.35 0.4 0.4 5 0.5 0.55 0.6
0.00 0.06 0.12 0.18
JL ab TBM
FL
p
x
Q2 = 1 G eV2
0.01 0.1 1 0.0
0.1 0.2 0.3 0.4 0.5 0.6 0.7 0.8
x
xg
Q2 = 10 GeV2
Q2 = 3 GeV2
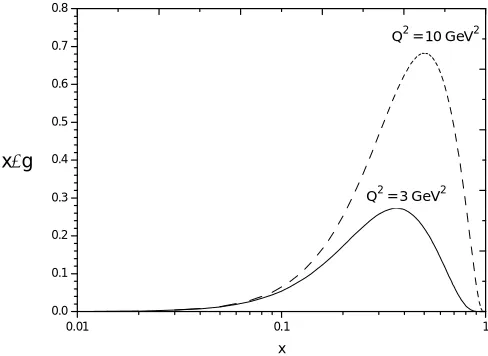
Fig. 3 – Gluon momentum distribution as a function of x at Q2 = 3 and 10 GeV2.
VI. RESULTS AND DISCUSSION
In this present work, we evaluate the longitudinal structure function of proton using the quark distribution based on thermodynamical bag model. By use of up and down quark distribution, the structure function of proton is estimated. The invariant mass of the nucleon of the final hadronic system increases when decreasing the Bjorken variable x and it yields to the production of sea quarks and gluons. At low x, energy transfer is greater than the square four momentum transfer. Figure 1 shows that the variation of proton structure function with the square invariant mass of the nucleon
W2. At low Q2,
F
2p increases and then it decreases with W2 which is deviated with experimental data. This is due tomore contribution of sea quarks in the low x region which is the natural consequence of this model. Increasing the value of Q2, proton structure function has similar behavior with experimental results when W2 is more than 4 GeV2. The momentum distribution of up quark dominated over down quark in the proton structure function. This is fact that the role of their electric charge. The momentum distribution of
d
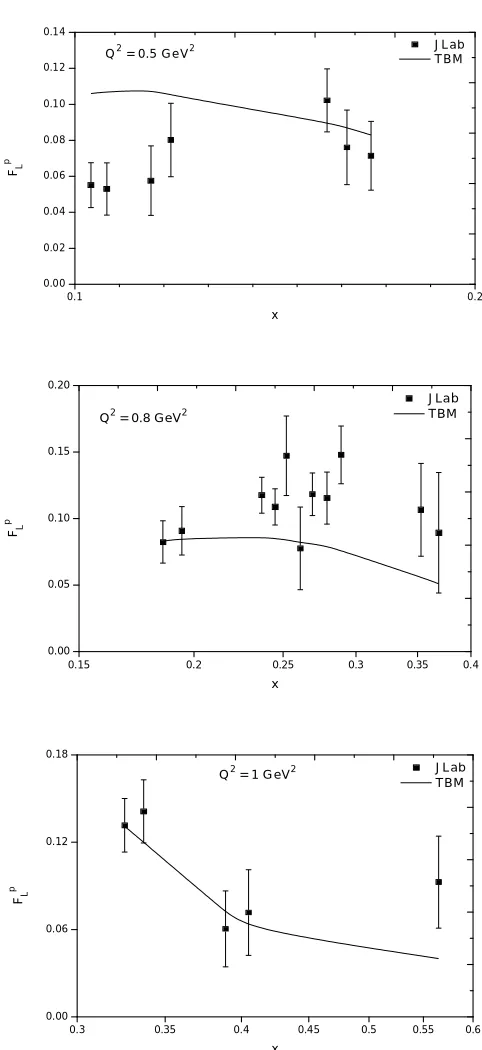
is more compared withu
.Figure 2 shows that the variation of longitudinal structure functions with Bjorken variable x for different Q2 values. At Q2 = 0.5 and 0.8 GeV2, FL increases with x and then it decreases. At Q2 = 1 GeV2, longitudinal structure function FL decreases withincreasing the value of x. However, FL is positive in the evaluated kinematic region due the dominating of up quark
distribution over that of down quark distribution. The gluon momentum distribution with Bjorken variable x for different four momentum transfer is shown in figure 3.
At Q2 = 3 GeV2, gluon distribution is close agreement with world data and disfavoured with NNPDF data at Q2 =10 GeV2 which is due to increasing Q2 value gluon momentum distribution attains the maximum value up to x = 0.48 and then it decreases. The shape of the distribution is different between x = 0.07 and x = 0.97 with NNPDF data. The integral value obtained for ∆g = 0.21 is comparable with NNPDF original fit data 0.06±0.18 in the kinematic
Table 1: The evaluated integral value of ∆g at Q2 = 10 GeV2 is compared with experimental data. 1
0x TBM 0.001x1 TBM 0.05x0.2 TBM
NNPDFpol1.0
NNPDFpol1.1
DSSV08
DSSV++
-0.95±3.87
0.03±3.24
-
-
0.54
-0.06±1.12
0.49±0.75
702 . 0
314 . 0
03 . 0
0.536
0.05±0.15
0.17±0.06
120 . 0
164 . 0
005 . 0
06 . 0 07 . 0
10 . 0
0.20
VII. CONCULUSION
Our TBM evaluation of Longitudinal Proton Structure Function and Gluon Momentum Distribution are good
agreement with the available experimental data. The integral value Δg is consistent with NNPDF and DSSV fit.
REFERENCES
1.A.Zee, F.Wilczek and S.B.Treiman, Phys. Rev.D 10(1974)2881.
2.A.M.Cooper-Sarkar, G.Inglman, K.R.Long, R.G.Roberts, and D.H.Saxon, Z .Phys. C 39(1988)281. 3.R.G.Roberts, The structure of the proton, (Cam-bridge University Press 1990) Cambridge. 4.F.D.Aaron et al, H1 Collaboration, Phys.Lett.B665(2008)139.
5.P.Monghan, A.Accardi,M.E.Christy and C.E.Keppel, Phys.Rev.Lett.110(2013)152002. 6.F.D.Aaron et al, Phys.Lett. B 665(2008)139.
7.Y. Liang et al, arXiv:nucl-ex/0410027.
8.G.R.Boroun, B.Rezaei and J.K.Sharma, Mod.Phys.Lett. A 29(2014)1450189. 9.V.Tvaskis et al, arXiv:1606.02614v1.
10.E.R.Nocera et al, NNPDF collaboration, arXiV:1406.5539V2. 11.D de Florian et al, Phys.Rev.D80(2009)034030.
12.E.Aschenauer et al, arXiV:1304.0079(2013).
13.K.Ganesamurthy,V. Devanathan and M.Rajasekaran, Z. Phys.C52(1991)589-592. 14.K.Ganesamurthy and C.Hariharan, Mod.Phys.Lett.A 29(38)(2008)349.
15.V.Devanathan and J.S.McCarthy, Mod.Phys.Lett.A 11(1996)147. 16.F.Takagi, Z. Phys. C 37(1988)259.