ISSN(Online): 2319-8753 ISSN (Print): 2347-6710
I
nternational
J
ournal of
I
nnovative
R
esearch in
S
cience,
E
ngineering and
T
echnology
(An ISO 3297: 2007 Certified Organization)
Website: www.ijirset.com
Vol. 6, Issue 9, September 2017
Seismic
Analysis of Vertically Regular
building with and without Softstorey at
different levels
Sameer Chandwadkar
1, Prof.Dilip Wadje
2, Dr. G.R.Gandhe
3P.G.Student, Department of Civil Engineering, Deogiri Institute of Engineering and Management Studies,
Aurangabad, Maharashtra, India1
Assistant Professor, Department of Civil Engineering, Deogiri Institute of Engineering and Management Studies,
Aurangabad, Maharashtra, India2
Professor, Department of Civil Engineering, Deogiri Institute of Engineering and Management Studies,
Aurangabad, Maharashtra, India3
ABSTRACT: With urbanization and increasing unbalance of required area to availability, it is important to provide open ground storey in both type of buildings that is commercial and residential. These open storey’s without brick infill reduce the stiffness of the load carrying member and progressive increase in load exhibit higher stresses in the load carrying member and these members i.e. columns fail as the plastic hinges are not formed on predefined positions. Therefore, the collapse of this soft storey during earthquake has caused structural engineer store think the design of a soft storey. This paper focus on performance and evaluation of 13 storey RC building with and without soft storey at different level . In this Paper 4 buildings out of which one is regular, in elevation, 3 regular buildings with Soft storey at different level and in elevation. Three methods of analysis namely Linear Static Analysis (equivalent Lateral load method), Response Spectrum analysis and Nonlinear Staic analysis (Pushover analysis) has been used. After the analysis results are evaluated for each model and results are compared. the Description of Geometry and procedure carried out in ETABS for each model
KEYWORDS: - Building Configuration, ETABS-2015, Linear Static Analysis, Pushover Analysis, Response Spectrum .
I. INTRODUCTION
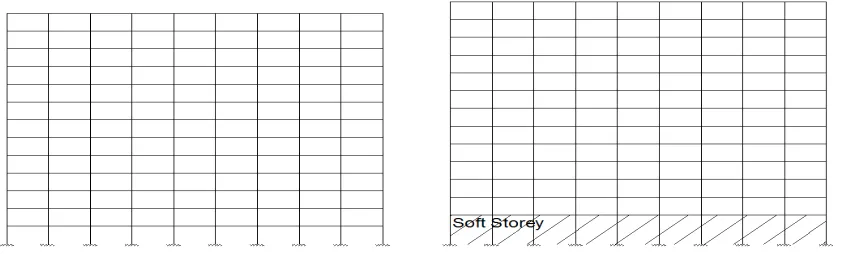
For the purpose of recreational use, parking or for retail or commercial use, Many of multi-storey buildings in India do not have structural walls at ground floor level. The buildings that are called as soft storey building, has a discontinuity in the stiffness of the building,. The lateral stiffness of first storey in soft storey building is very less compared to other storeys which are infill with masonry, which results in concentration of large seismic forces, plastic hinges and consequently higher drift demand at that storey
.
Building with soft storey at diffrentlevel have at least one of the characteristics a) one storey is significantly more flexible than adjacent storeys, (b) have vertical discontinuity (e.g. posses fewer columns in one storey than that of storey above), (c) have a heavy superstructureAs per IS 1893 Soft storeyis defined as below:
ISSN(Online): 2319-8753 ISSN (Print): 2347-6710
I
nternational
J
ournal of
I
nnovative
R
esearch in
S
cience,
E
ngineering and
T
echnology
(An ISO 3297: 2007 Certified Organization)
Website: www.ijirset.com
Vol. 6, Issue 9, September 2017
b) Extreme Soft Story: An extreme soft story is one in which the lateralstiffness is less than 60 percent of that in the storyabove or less than 70 percent of the average stiffnessof the three story above. For example, buildings on STILTS will fall under this category. A common soft storey example is Ground floor of building with greater height and no walls.
I.1Objective
To study the effect of regular building having soft storey at different level using Finite element software. and To evaluate the response of building having soft storey in the form of lateral drift, base shear and time period.
II. METHODLOGY
Following is the step by step procedure will be followed during work:
Step1: First 4 buildings as shown in figure.
Step2:For Regular building out of four building one is without soft storey and remaining three are with soft storey at different level.
Step3: Afterward carryout Linear static (Equivalent lateral load method), response spectrum method and nonlinear static analysis method.
Step4:Evaluate results in the form of Storey shear, Storey drift, Time period, member forces, Capacity curve and Performance point for all 3 models.
Step5: Results will be Compare in graphical form and final conclusion will be made.
II.1 STRUCTURAL MODELING:
Must In this chapter 4 buildings out of which one is regular in elevation and 3 regular buildings with Soft storey at different levels . The elevations are as shown in below figure1.1 and 1.2. Three methods of analysis namely Linear Static Analysis(LSM) (equivalent Lateral load method), Response Spectrum analysis(RSM) and Nonlinear Staic analysis (Pushover analysis) has been used. After the analysis results are evaluated for each model and results are compared. Following is the Description of Geometry and procedure carried out in ETABS for each model.
ISSN(Online): 2319-8753 ISSN (Print): 2347-6710
I
nternational
J
ournal of
I
nnovative
R
esearch in
S
cience,
E
ngineering and
T
echnology
(An ISO 3297: 2007 Certified Organization)
Website: www.ijirset.com
Vol. 6, Issue 9, September 2017
Fig 1.2 Model RS-3 and Model RS-5
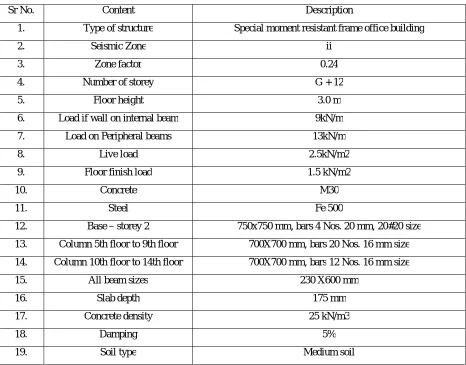
Table 1.1: Geometric and Structural Detailing Of Model: R, RS-1, RS-3, RS-5
Sr No. Content Description
1. Type of structure Special moment resistant frame office building
2. Seismic Zone ii
3. Zone factor 0.24
4. Number of storey G + 12
5. Floor height 3.0 m
6. Load if wall on internal beam 9kN/m
7. Load on Peripheral beams 13kN/m
8. Live load 2.5kN/m2
9. Floor finish load 1.5 kN/m2
10. Concrete M30
11. Steel Fe 500
12. Base – storey 2 750x750 mm, bars 4 Nos. 20 mm, 20#20 size
13. Column 5th floor to 9th floor 700X700 mm, bars 20 Nos. 16 mm size
14. Column 10th floor to 14th floor 700X700 mm, bars 12 Nos. 16 mm size
15. All beam sizes 230 X600 mm
16. Slab depth 175 mm
17. Concrete density 25 kN/m3
18. Damping 5%
ISSN(Online): 2319-8753 ISSN (Print): 2347-6710
I
nternational
J
ournal of
I
nnovative
R
esearch in
S
cience,
E
ngineering and
T
echnology
(An ISO 3297: 2007 Certified Organization)
Website: www.ijirset.com
Vol. 6, Issue 9, September 2017
III.RESCULT&DISCUSSION
Results of Analysis:After modelling, load application and design 3 type of analysis namely Linear Static Analysis (LSM/EQX), Response Spectrum method(RSM/Spec X) and Nonlinear Static analysis (NSA/Pushover) has been done and result are represented in graphical manner
III.1 Model 01: R
III.1.1: Geometric Details of building
Building is having9x9 bay of span 5 m in both direction with a story height of 3 m each having 13 stories. Frame is a special moment resisting frame, sizes of different section and loading considered in building are shown in table.1.1 Load consideration are as per residential building
.
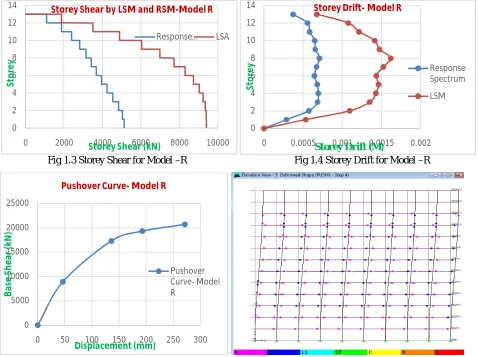
Fig 1.3 Storey Shear for Model –R Fig 1.4 Storey Drift for Model –R
Fig 1.5 Pushover curve for model –R Fig 1.6 – Deformed shape and hinge Formation- Model -R
III.1.2: Discussion on results of Model R
Following are the observations from the result of analysis
Design Base shear obtained byLSM is 9411.29 kN which is almost 83 % greater than design Base shear by RSM (5129.77 kN). This large difference is due to Time period in both analysis considered is different. In LSM analysis time period calculated by Empirical formula (IS1893-1) has been used while in RSM analysis ETABS calculated time period has been used. Storey drift (Fig 1.4) obtained by LSM analysis (0.00162) is almost double of RSM analysis drift (0.00071) but it is less than allowable Storey drift limit of IS1893-1. (0.004).In pushover analysis maximlateral
0 2 4 6 8 10 12 14
0 2000 4000 6000 8000 10000
St
o
re
y
Storey Shear (kN)
Storey Shear by LSM and RSM-Model R
Response … LSA
0 2 4 6 8 10 12 14
0 0.0005 0.001 0.0015 0.002
St
o
re
y
Storey Drift (M)
Storey Drift- Model R
Response Spectrum
LSM
0 5000 10000 15000 20000 25000
0 50 100 150 200 250 300
B
as
e
S
h
ea
r
(k
N
)
Displacement (mm)
Pushover Curve- Model R
ISSN(Online): 2319-8753 ISSN (Print): 2347-6710
I
nternational
J
ournal of
I
nnovative
R
esearch in
S
cience,
E
ngineering and
T
echnology
(An ISO 3297: 2007 Certified Organization)
Website: www.ijirset.com
Vol. 6, Issue 9, September 2017
displacement of top point of building is observed as 271.2 mm and building capacity for lateral load is 20701.71 kN.(Fig 1.5)By observing the deformed shape from (fig 1.6) it can be seen that no hinge is Crossing Life Safety limit (LS) and on only storey10 and 11 some hinges are formed in columns. There is no hinge formation in columns at bottom and top storey of building
III.2 Model 02: RS-1
III.2.1 Geometric Details of building
Building is having 9x9 bay of span 5 m in both direction with a story height of 3 m each (Except Storey 1-4.5 m height) having 13 stories. Frame is a special moment resisting frame, sizes of different section and loading considered in building are shown in table 1.1. Load consideration are as per residential building
.
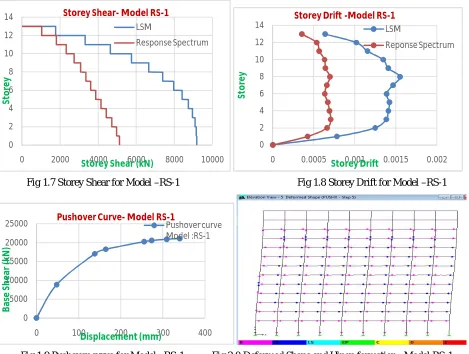
Fig 1.7 Storey Shear for Model –RS-1 Fig 1.8 Storey Drift for Model –RS-1
Fig 1.9 Pushover curve for Model –RS-1 Fig 2.0:Deformed Shape and Hinge formation –Model RS-1
III.2.2 Discussion on results of Model RS-1
Following are the observations from the result of analysis
Design Base shear obtained by LSM is 9439.02kN which is almost 84 % greater than design Base shear by RSM (5109.03kN). This large difference is due to Time period in both analysis considered is different. In LSM analysis time period calculated by Empirical formula (IS1893-1) has been used while in RSM analysis ETABS calculated time period has been used. Storey drift (Fig 1.8) obtained by LSM analysis (0.00155) is almost double of RSM analysis drift (0.00070) but it is less than allowable Storey drift limit of IS1893-1. (0.004).In pushover analysis maximum lateral displacement of top point of building is observed as 340.2 mm and building capacity for lateral load is 21080.74kN. (Fig 1.9)By observing the deformed shape from (fig 2.0 ) it can be seen that no hinge is Crossing Collapse prevention
0 2 4 6 8 10 12 14
0 2000 4000 6000 8000 10000
St
o
re
y
Storey Shear (kN)
Storey Shear- Model RS-1 LSM
Response Spectrum
0 2 4 6 8 10 12 14
0 0.0005 0.001 0.0015 0.002
St
o
re
y
Storey Drift
Storey Drift -Model RS-1 LSM
Reponse Spectrum
0 5000 10000 15000 20000 25000
0 100 200 300 400
B
as
e
S
h
e
ar
(
kN
)
Displacement (mm)
Pushover Curve- Model RS-1
ISSN(Online): 2319-8753 ISSN (Print): 2347-6710
I
nternational
J
ournal of
I
nnovative
R
esearch in
S
cience,
E
ngineering and
T
echnology
(An ISO 3297: 2007 Certified Organization)
Website: www.ijirset.com
Vol. 6, Issue 9, September 2017
state (CP) and on storey1st,10th and 11th hinges are formed in columns. There is no hinge formation in columns at bottom and top storey of building. As compare to regular model (Model-R) here extra hinges are there in first storey column due to Soft storey.
III.3 Model 03: RS-3
III.3.1 Geometric Details of building
Building is having 9x9 bay of span 5 m in both direction with a story height of 3 m each (Except Storey 3-4.5 m height) having 13 stories. Frame is a special moment resisting frame, sizes of different section and loading considered in building are shown in table 1.1. Load consideration are as per residential building
.
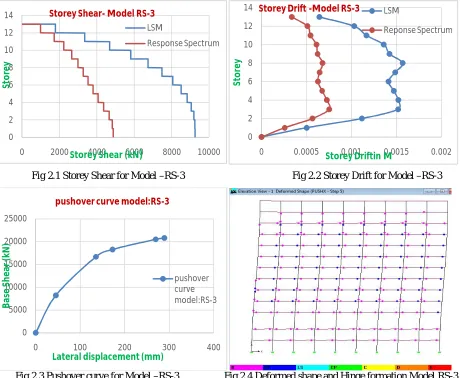
Fig 2.1 Storey Shear for Model –RS-3 Fig 2.2 Storey Drift for Model –RS-3
Fig 2.3 Pushover curve for Model –RS-3 Fig 2.4 Deformed shape and Hinge formation Model RS-3
III.3.2 Discussion on results of Model RS-3
Following are the observations from the result of analysis
Design Base shear obtained by LSM is 9254.69kN which is almost 89 % greater than design Base shear by RSM (4873.24kN). This large difference is due to Time period in both analysis considered is different. In LSM analysis time period calculated by Empirical formula (IS1893-1) has been used while in RSM analysis ETABS calculated time period has been used. Storey drift (Fig 2.2) obtained by LSM analysis (0.00156) is almost double of RSM analysis drift (0.00075) but it is less than allowable Storey drift limit of IS1893-1. (0.004).In pushover analysis maximum lateral displacement of top point of building is observed as 289.1 mm and building capacity for lateral load is 20841.45kN.
0 2 4 6 8 10 12 14
0 2000 4000 6000 8000 10000
St
o
re
y
Storey Shear (kN
)
Storey Shear- Model RS-3LSM
Response Spectrum
0 2 4 6 8 10 12 14
0 0.0005 0.001 0.0015 0.002
St
o
re
y
Storey Driftin M
Storey Drift -Model RS-3 LSM
Reponse Spectrum
0 5000 10000 15000 20000 25000
0 100 200 300 400
B
a
se
S
h
ea
r
(k
N
)
Lateral displacement (mm)
pushover curve model:RS-3
ISSN(Online): 2319-8753 ISSN (Print): 2347-6710
I
nternational
J
ournal of
I
nnovative
R
esearch in
S
cience,
E
ngineering and
T
echnology
(An ISO 3297: 2007 Certified Organization)
Website: www.ijirset.com
Vol. 6, Issue 9, September 2017
(Fig 2.3)By observing the deformed shape from( fig 2.4) it can be seen that no hinge is crossinglife safety state (LS) and on storey5th,6th,11th and 12th hinges are formed in columns. There is no hinge formation in columns at bottom and top storey of building.
III.4 Model 04: RS-5
III.4.1 Geometric Details of building
Building is having 9x9 bay of span 5 m in both direction with a story height of 3 m each (Except Storey 5th - 4.5 m height) having 13 stories. Frame is a special moment resisting frame, sizes of different section and loading considered in building are shown in table1.1. Load consideration are as per residential building.
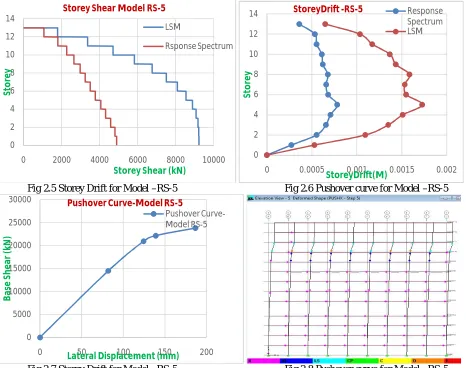
Fig 2.5 Storey Drift for Model –RS-5 Fig 2.6 Pushover curve for Model –RS-5
Fig 2.7 Storey Drift for Model –RS-5 Fig 2.8 Pushover curve for Model –RS-5
III4.2Discussion on results of Model RS-5
Following are the observations from the result of analysis
Design Base shear obtained by LSM is 9230.4kN which is almost 88 % greater than design Base shear by RSM (4891.5kN). This large difference is due to Time period in both analysis considered is different. In LSM analysis time period calculated by Empirical formula (IS1893-1) has been used while in RSM analysis ETABS calculated time period has been used. Storey drift (Fig 2.6) obtained by LSM analysis (0.0017) is almost double of RSM analysis drift (0.00078) but it is less than allowable Storey drift limit of IS1893-1. (0.004).In pushover analysis maximum lateral displacement of top point of building is observed as 186.7 mm and building capacity for lateral load is 23820.28kN.
0 2 4 6 8 10 12 14
0 2000 4000 6000 8000 10000
St
o
re
y
Storey Shear (kN)
Storey Shear Model RS-5
LSM
Rsponse Spectrum
0 2 4 6 8 10 12 14
0 0.0005 0.001 0.0015 0.002
St
o
re
y
StoreyDrift(M)
StoreyDrift -RS-5 Response Spectrum LSM
0 5000 10000 15000 20000 25000 30000
0 50 100 150 200
B
as
e
S
h
e
a
r
(k
N
)
Lateral Displacement (mm)
Pushover Curve-Model RS-5
ISSN(Online): 2319-8753 ISSN (Print): 2347-6710
I
nternational
J
ournal of
I
nnovative
R
esearch in
S
cience,
E
ngineering and
T
echnology
(An ISO 3297: 2007 Certified Organization)
Website: www.ijirset.com
Vol. 6, Issue 9, September 2017
(Fig 2.7)By observing the deformed shape from (fig 2.8) it can be seen that some hingesare inD-E state and on storey7th, 10th, and 11th hinges are formed in columns. The all critical hinges D-E are formed in columns at 11thstorey.
III.5 Result Compression of regular Buildings III.5.1 Storey Shear Comparison:
Linear Static method/EQX: results of all models obtained by linear static method has been plotted on one graph.Fig2.9 shows the combined graph of Storey shear of all 4 models by LSM method
Fig 2.9:Combined plot of Storey shear by LSM Fig 3.0:Combined plot of Storey shear by LSM
Following are the observations from the plot of storey shear for all models by linear static method.
For regular building maximum design shear force obtained is 9411 kN which is slightly greater than regular building with softstorey. As the soft storey is moving from bottom to top of building design base shear is reducing as per LSM.
Response Spectrum method/Spec X::results of all models obtained by response method has been plotted on one graph. Fig3.0 shows the combined graph of Storey shear of all 4 models by RSM method
The obtained Storey shear results by RSM for regular building are close as compare to LSM due to ETABS calculated time period. For regular building etabs calculated time period is less that’s why Spectral acceleration value is higher
III.5.2: StoreyDrift Comparison:
Drift by Linear Static method/EQX: Storey Drift of all models obtained linear static method has been plotted on one graph. Fig3.1shows the combined graph of Storey drift of all 4 models by LSM method
Fig 3.1:Combined plot of Storey Drift by LSM Fig 3.2:Combined plot of Storey Drift by RSM
0 2 4 6 8 10 12 14
0 2000 4000 6000 8000 10000
St
o
re
y
Storey Shear (kN)
Storey Shear Plot by LSM/EQX
R RS-1 RS-3 RS-5 0 2 4 6 8 10 12 14
0 1000 2000 3000 4000 5000 6000
St
o
re
y
Storey Shear (kN)
Storey Shear Plot by Response Spectrum method (Spec X
)
R RS-1 RS-3 RS-5 0 2 4 6 8 10 12 14
0 0.0005 0.001 0.0015 0.002
St
o
re
y
Storey Drift
Storey Drift by EQX/LSM
R RS-1 RS-3 RS-5 0 2 4 6 8 10 12 14
0 0.0002 0.0004 0.0006 0.0008 0.001
St
o
re
y
Storey Drift
Storey Drift by RSM/Spec
X
R
RS-1
RS-3
ISSN(Online): 2319-8753 ISSN (Print): 2347-6710
I
nternational
J
ournal of
I
nnovative
R
esearch in
S
cience,
E
ngineering and
T
echnology
(An ISO 3297: 2007 Certified Organization)
Website: www.ijirset.com
Vol. 6, Issue 9, September 2017
Following are the observations from the plot of storey Drift for all models by linear static method.
For regular building with storey drift is maximum on soft storey level as compare regular building without soft storey.For regular building without softstorey drift plot is having very less kinks while regular building with soft storey is having Kinks in Storey drift plot at Soft storey level.StoreyDrift of regular building with Soft story is higher at Soft storey level as compare regular building without soft storey.
Drift by Response Spectrum method/Specx: Storey Drift of all models obtained Response Spectrum method has been plotted on one graph. Fig.3.2 shows the combined graph of Storey drift of all 4 models by RSM method.
Following are the observations from the plot of storeyDrift for all models by linear static method. Storey drift curve for regular building without softstorey is smooth but for regular building with soft storey shear plot is having Kinks at Soft storey level.
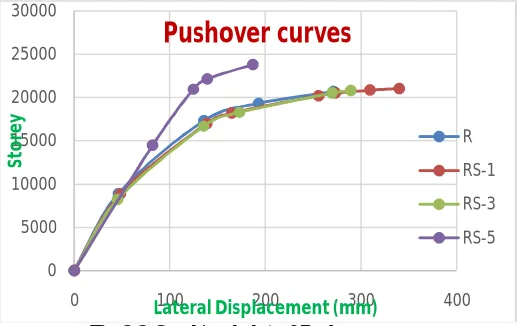
III.5.3 Pushover curve Comparison:Pushover curve obtained by Nonlinear Static analysis has been plotted on one graph. On horizontal axis lateral displacement of top point has been taken and Base shear has been plotted on on Y axis. Before carrying analysis nonlinear hinges has been assigned to beams and columns.
Fig 3.3:Combined plot of Pushover curve
Following are the observations from the combined plot of Pushover curve
Pushover curve for Model R, RS-1 and RS-3 are almost overlapped, which means that these three models is having almost equal lateral load carrying capacity. As the model RS-1 has been gone maximum lateral deflection RS-1 is more flexible than RS-3 and R building.Model RS-5 (Regular building with 5thstorey as soft storey) is having the highest lateral load carrying capacity as compare to all model. This isdue to fact that the column of this models are stronger than other models. But the lateral deflection of model is very less as compare to other regular model. Which means that this model is less flexible than other regular buildings.
IV.CONCULSION
A total 4 building models having vertical regularity with and without Soft storey has been modeled in ETABS. Softstorey has been considered at storey 1, Storey 3 and Storey 5. All the loads has been applied and nonlinear hinges has been assigned as per ATC-40. After modelling and load application analysis has been done by Linear Static method (LSM), Response Spectrum method (RSM) and Nonlinear Static method (NSA). The results in the form of Storey shear, Storey drift, Pushover curve and time period has been represented and compared. From the study following conclusion can be made.
Linear Static method (LSM) over estimates the Storey shear and Storey drift as compare to Response Spectrum method. Storey shear plot of regular building building are close by Response spectrum method (35 % difference) as compare to Linear static method storey shear plot of regular (82- 88 % difference).Program (ETABS) calculated time
0 5000 10000 15000 20000 25000 30000
0 100 200 300 400
St
o
re
y
Lateral Displacement (mm)
Pushover curves
R
RS-1
RS-3
ISSN(Online): 2319-8753 ISSN (Print): 2347-6710
I
nternational
J
ournal of
I
nnovative
R
esearch in
S
cience,
E
ngineering and
T
echnology
(An ISO 3297: 2007 Certified Organization)
Website: www.ijirset.com
Vol. 6, Issue 9, September 2017
period gives the more accurate value as it based on actual Mass matrix and Stiffness matrix of building. Code based time period is only depends on the height of structure and it’s not considering any Mass changes and stiffness changes in building with soft storey. it’s better to use software time period for analysis or some different formula has to be developed which should berelated to mass and stiffness of building. Storey drift plot for all building is within allowable limit. Storey drift plot of regular building is smooth curve and for regular building with soft storey there is kink at soft storey level. Lateral displacement capacity of regular building can go higher deformation upto 325 mm
REFERENCES
[1] SEISMIC RESPONSE OF VERTICALLY IRREGULAR STRUCTURES(Journal of Structural Engineering, Vol. 110, No. 9, September,
1984) - Jack P. Moehle
[2] SEISMIC ANALYSIS METHODS FOR IRREGULAR BUILDINGS (Journal of Structural Engineering, Vol. 112, No.1, January, 1986)
[3] Influence of vertical irregularity on seismic response of building ( Ninth world conference on Earthquake Engineering, Vol V, Aug 1988 )-
Anibal G. Costa, Carlos and Ricarda T Duarte
[4] Seismic Response of Building Frames With Vertical StructuraIrregularities(Journal of Structural Engineering, Vol.123, No. I, January, 1997)-
Eggert V. Valmundsson and James M. Nau
[5] J. N. Arlekar, S. K. Jain and C.V.R. Murty, “Seismic Response of RCFrame Buildings with Soft First Storeys,” Dept. of Civil Engineering,IIT
Kanpur, India. (CBRI) 1997.
[6] Sujatha A., Jiji Anna Varughese, Bindhu K.R, “The Influence ofMasonry Infill in RC Multi-Storey Buildings,” (NCTT09) 6-7 Nov2009.
[7] S. Haque, Khan M. A., “Seismic Vulnerability of Columns of RCFramed Buildings with Soft Ground Floor,” International Journal
OfMathematical Models And Methods In Applied Sciences, Issue3,Volume-2,2008.
[8] M.R. Amin, P. Hasan, B.K.M.A. Islam, “Effect of soft storey on multistoried reinforced concrete building frameCongress, December 22-24
2011.
[9] C V R Murty, the Classroom section, a series of short articles, 'Earthquake Tips', related to earthquakes design & construction of buildings.
IIT Kanpur and BMTPC, New Delhi. August 2004.
[10] A.K. Chopra, D.P. Clough, R.W. Clough, “Earthquake Resistance of Building with a „SOFT‟ First Storey”, Earthquake Engineering and
Structural Dynamics, Vol.1, 347-355, 1973.
[11] Bento R., Azevedo J., “Behavior coefficient assessment for Soft Storey Structures”, 12WCEE,2000.