Pavement Rehabilitation Prioritization Using
Analytical Hierarchy Process (AHP)
Anjali Ashok1, Thasneem K M2, Sony Vincent3
U G Student, Department of Civil Engineering, IES College of Engineering, Chittilappilly, Kerala, India1, 2
Assistant Professor, Department of Civil Engineering, IES College of Engineering, Chittilappilly, Kerala, India3
ABSTRACT: The roads are not perfect in their functions due to the lack of proper maintenance and it makes the city more traffic congested.Decision makers often perform pavements repairs without considering the maintenance priority and without utilizing a systematic procedure. The analytical hierarchy process (AHP) is one of the most effective techniques in decision making process, which is used to facilitate the prioritization of alternatives on basis of important parameters or criteria affecting the pavement rehabilitation, which are mainly based on cost and benefit point of views. In this study, some basic scoring rules were introduced to convert the qualitative factors into a quantitative scale and with the help of comparison matrix the weightage of each of these factors were determined. Finally a priority ranking is obtained from the benefit to cost analysis. As a case study the Perinthalmanna municipality (India) was selected and the total area was divided into 6 zones according to the land use. The benefit to cost ratio were analyzed to determine the maintenance priority of the zones. It was concluded that based on the existing conditions, the rating approach in AHP method prioritized the impaired sections for maintenance easily and effectively.
KEYWORDS: Analytical hierarchy process, benefit to cost ratio, comparison matrix, pavement rehabilitation, scoring rules
I. INTRODUCTION
The pavement maintenance management is the method of finding cost effective strategies for providing, evaluating and maintaining the pavement network in a serviceable condition. Lack of adequate funding has always been a problem for the management of pavements. So it is necessary to develop a comprehensive prioritization schedule to choose sections with higher priority first, in order to fulfil the needs in pavements network. In this paper, rating approach in AHP was utilized and prioritization was done on the basis of important criteria like benefit cost and their sub-criteria. These qualitative factors were quantified with the help of some basic scoring rules. Pairwise comparisons between the factors were obtained by capturing the PMS (Pavement Management System) experts’ perceptions towards the importance of factors affecting the maintenance priority. Relative weights of factors in each pairwise comparison matrix were calculated manually and the final benefit to cost ratios was obtained from the weightages and scores. The main objective of this study was developing a systematic way to determine the maintenance priority of various road sections based on their existing conditions.
In the case study the Perinthalmanna municipality (India) was selected and the total area was divided into 6 zones according to the land use and the zones were ranked according to the maintenance priority by analyzing benefit to cost ratio. Since large amounts of money are wasted for inadequate rehabilitation works, it would be wise to develop a priority ranking for maintenance of pavements and thus it can guarantee the effectiveness of budget allocation.
II. METHODOLOGYOFTHESTUDY
scores represent the existing condition of the respective road sections. In this rating approach, pairwise comparisons between criteria and sub-criteria were done by considering ideas of PMS experts. The weightage of each of the factors were determined with the comparison matrices. The final benefit to cost ratio were calculated by multiplying the scores and the weightages of each of the factors. The zones having the highest benefit to cost ratio is given the highest priority ranking. Methodology of the study will be discussed more in detail further on.
Table 1: Sub-criteria for Benefit and cost
BENEFIT COST
Possibility to improve quality of traffic Repair cost
Possibility to improve capacity of pavement Traffic impact
Local access and effective service area Time for completion
Population, Public facility and Economic importance of the zone
Sensitivity of surrounding to noise, dust and gases
Safety Impact on commerce and residence
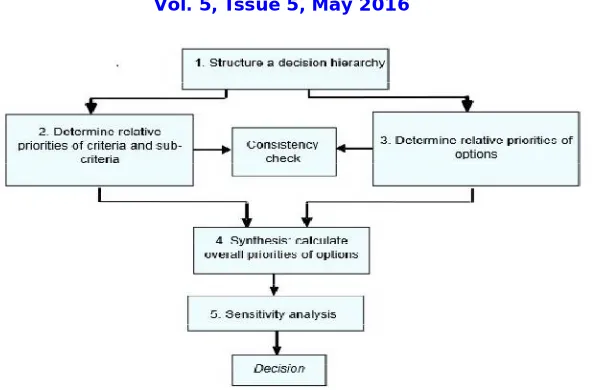
III. ANALYTICALHIERARCHYPROCESS
Fig. 1.Basic steps in AHP
IV.SCORINGRULES
This is the method of quantifying the qualitative factors by assigning respective range of scores on the basis of conditions they depends. The scoring rules of the criterion are as follows:
Scoring rules for factors under Benefit
a. Possibility to improve quality of traffic
Quality depicts the functionality of a road. It means the smoothness and easiness of transportation through that particular road and it mainly depends on the depth of damages.
To quantify this factor, a score of 0-10 is considered in which the score varies linearly with the depth of damage of the particular zones.
b. Possibility to improve capacity of pavement
The capacity of road also mainly depends on the degree of damage of the road sections. Here also a score of 0-10 is given and the scores vary linearly with the degree of damages. Linear variations are preferred in order to give a great concern to the highly damaged roads during the maintenance activities.
c. Local access and effective service area
This factor depicts the idea of improvement in the local access as well as how much area the road network serves after the rehabilitation process. So a score of 0-10 is given and the scores vary linearly with the effective area of the zones.
d. Population, Public facility and Economic importance of zones
After the rehabilitation of an existing road, the road users via that particular road increases. As population increases public places, offices etc will also increase which leads to increase in the economic importance of the zone. So this factor depends on the population of each zones and a score of 0-10 is given which varies linearly with the population.
e. Safety
Scoring rules for factors under Cost
a. Repair Cost
If the repair cost is high then the possibility of maintenance is less. The repair cost mainly depends on the road type, width of pavement, present road condition, depth of damage, type of repair required, etc. The repair cost considerably varies with the type of road to be repaired and method of construction. So the rule adopted for scoring this criterion is according to the type of the road network whether it is national highway, state highway, district road, or municipal roads. For minor road networks the cost will be minimum, hence score is also minimum and for major roads score will be maximum. The score distribution is given in the Table 2.
Table 2: Scoring for repair cost
Type of Road Scores
Major Roads 10
Minor Roads 6
Streets 3
b. Traffic Impact
Traffic impact indicates the risk to traffic movement which arises due to the maintenance activities during the rehabilitation period. The maintenance activities make the traffic more congested especially if alternative routes are not available. The traffic impact mainly affects the traffic flow in main roads. So maximum score is provided to major roads where the numbers of vehicles are more. Here the score is distributed according to the traffic volume. A score range of 0-20 is given for traffic volume varying from 500-3500 pcu /hr.
c. Time for completion
This implies the total time required to complete the repair work. It depends on depth of damage. A score range of 0-10 is given and the maximum score is given to highly damaged roads.
d. Sensitivity of surrounding to noise, dust and gases
This factor mainly depends upon presence of public. As the population increases, the problems caused due to noise, dust and gases produced during maintenance activities also increases. A score range of 0-10 is given and maximum score is given to areas having high population.
e. Impact on Commerce and Residence
It indicates the effect of maintenance activities on residential and commercial areas. As population increases, the roads get busier and thus maintenance cost increases. When the roads to be repaired is in a remote area, the problems arising due to the noise, dust and gases produced due to the maintenance activities is of less concern. So a score range of 0-10 is adopted and areas having maximum population are given the maximum scores.
V. COMPARISONMATRIX
Table 3: comparison matrix for Benefit criteria Possibility to improve quality of traffic Possibility to improve capacity of pavement Local access and effective service area Population, Public facility and economic importance of the zone
Safety Weightage
Possibility to improve quality of
traffic
1 2 2 3 2 0.326
Possibility to improve capacity of
pavement
0.5 1 2 3 2 0.277
Local access and effective service area
0.5 0.5 1 1 2 0.163
Population, Public facility and economic importance of the zone
0.33 0.33 1 1 1 0.119
Safety
0.5 0.5 0.5 1 1 0.114
Table 4 represents the comparison matrix for the cost criteria. From these tables the weightages of each factor are obtained. Here the pairwise comparisons between the factors were obtained by capturing the PMS (Pavement Management System) experts’ perceptions towards the importance of factors.
Table 4: Comparison matrix for Cost criteria
Repair Cost Traffic Impact
Time for Completion
Sensitivity of surrounding to noise, dust and gases
Impact on commerce and residence
Weightage
Repair Cost 1 2 3 4 4 0.358
Traffic Impact
0.5 1 2 3 4 0.268
Time for Completion
Sensitivity of surrounding to noise, dust
and gases
0.25 0.33 0.5 1 1 0.078
Impact on commerce and residence
0.25 0.25 0.2 1 1 0.069
VI.BENEFITTOCOSTRATIO
Various criterions under benefit and cost affecting the pavement rehabilitation are compared to obtain the final results. The benefit to cost ratio is obtained by,
B/C = Σ (Wa * Sa) / Σ (Wb * Sb) (1)
Where, Wa = Benefit based weight
Sa = Benefit based score
Wb = Cost based weight
Sb = Cost based score
The zones having the highest benefit to cost ratio is given the highest priority ranking because as the benefit to cost ratio becomes greater than or as it approaches to 1, the maintenance and rehabilitation activities becomes more economical.
VII. CASE STUDY AND DATA COLLECTION
The Perinthalmanna municipality of Malappuram district is the most important as it is the hospital city and major industrial areas are covered through it. The municipality consists a total of 34 wards and the total area were divided along the ward boundaries into 6 zones according to their land use as Residential I, Residential II, commercial I, commercial II, Institutional and a mixed zone. In this case study the data regarding pavement failures and its causes, traffic volume, construction history, pavement condition, total area and population were collected. Pavement failures were measured along the road sections. The major pavement failures along the road sections include potholes/patches, alligator cracks, longitudinal cracks, transversal cracks, ruts and it was converted into percentage damage with the help of PAVEMENT DISTRESS IDENTIFICATION MANUAL prepared by federal highway administration.
Traffic survey were conducted at the major junctions of all the zones for 3 peak hours and the peak value was chosen as the traffic volume of that particular zone. The details like total effective area, population, type of road etc were collected from the concerned departments. Table 5 shows a sample of traffic survey conducted.
Table 5: Traffic survey details
TRAFFIC SURVEY DATE TIME TWO WHEE-LER CAR/ JEEP/ VAN/ AUTOR-IKSHA BUS LIGHT COMM-ERCIAL VEHIC- LES TWO AXLE TRUCK MULTI AXLE TRUCK TRAC-TOR CYC-LE From To
9:00 10:00 379 467 11 27 1 0 0 0
12:30 13:30 316 374 5 19 0 0 0 1
16:00 17:00 345 485 16 31 0 0 0 0
PEAK HOURLY VOLUME 379 485 16 31 1 0 0 1
EQUIVALENT
PASSENGER CAR UNIT
TOTAL P C U 190 485 48 78 3 0 0 1
TOTAL 805
VIII. RESULTS AND DISCUSSIONS
The final benefit to cost ratio of all the zones were computed. Table 6 shows a sample of benefit to cost ratio of the zones. The existing condition of the road is represented by the scores against each factor.
Table 6: Benefit to Cost ratio
ZONE 4
BENEFIT
Score Weightage(w) W*100 Final score
Possibility to improve quality of traffic 3.368 0.326 32.6 109.7968 Possibility to improve capacity of pavement 3.368 0.277 27.7 93.2936
Local access and effective service area 6.648 0.163 16.3 108.3624
Population, public property, economic importance of the zone
7.295 0.119 11.9 86.8105
Safety 3.368 0.114 11.4 38.3952
Total score 436.6585
COST
Repair cost 6 0.358 35.8 214.8
Traffic impact 6.12 0.268 26.8 164.016
Time for completion 3.368 0.226 22.6 76.1168
Sensitivity of surrounding to noise, dust and gases 7.295 0.078 7.8 56.901
Impact on commerce and residence 7.295 0.069 6.9 50.3355
Total score 562.1693
B/C RATIO 0.7767
From the final benefit to cost ratios of zone 1, zone 2, zone 3, zone 4, zone 5 and zone 6 the maintenance priority ranking of the zones can be well assigned. Table 7 represents the priority ranking of each of the zones.
Table 7: Priority ranking of zones
Zones Land use B/C ratio Priority ranking
Zone 1 Residential I 0.8017 2
Zone 2 Residential II 0.8478 1
Zone 3 Commercial I 0.3040 5
Zone 4 Mixed 0.7767 3
Zone 5 Commercial II 0.2710 6
From the priority ranking it can be seen that the Residential area gets the highest ranking. This is due to the fact that the percentage damage of zone 2 is the largest, that is, 38.76%. Thus the factors depending on percentage damage give greater scores which imply that great care and preference should be given to that area. This greater score in turn increases the final B/C ratio. The traffic volume in the commercial areas can be reduced to a great extend by providing alternate routes along the first maintained areas. The commercial zone with greater traffic volume gets the least ranking. This is because it undergoes maintenance activities more often leaving behind other areas with poor maintenance. With maintenance priority rating of these areas, the maintenance and rehabilitation activities can be carried out in a most beneficial and cost effective manner.
IX.CONCLUSIONS
1. The major pavement pavement failures along the road sections and its causes were studied and the pavement failures were quantified in terms of percentage damage.
2. Due to the fact that, allocated budget for maintenance and rehabilitation operations is limited therefore all the sections that need rehabilitation do not receive enough budget and would not undergo the annual maintenance program. Consequently, prioritization is of high significance.
3. Using maintenance priority rating, introduced in this study, managers would be able to prioritize the maintenance of impaired sections based on their existing conditions. This systematic selection will guarantee the effectiveness of budget allocation.
4. In this study the benefit cost ratios of the zones were determined and the priority ranking of the zones were obtained from the benefit to cost ratios.
REFERENCES
[1] D. Moazami1, R. Muniandy, H. Hamid and Z. Md Yusoff , The use of analytical hierarchy process in priority rating of pavement maintenance, science research and essays, volume.6(12),2011, pp. 2447-2456.
[2] J. Farhan, F. T. Fang (2009), Pavement Maintenance Prioritization Using Analytic Hierarchy Process, Trans. Res. Record., 2093: 12-24. [3] D. Moazami, R. Muniandy (2010), Fuzzy Inference and Multi-criteria Decision Making Applications in Pavement Rehabilitation Prioritization, Australian J. Basic Appl. Sci., 4(10): 4740-4748.
[4] T.L Saaty, L.G.Vargas (2000), Models, Methods, Concepts and Application of the Analytic Hierarchy Process, Kluwer Academic Publishers. [5] Z. Zhang, R. B. Machemehl, I. Ahson, Application of the analytic hierarchy process for prioritization of pavement data collection for the TXDOT PMIS,center for transportation research Bureau of Engineering Research, university of texas at Austin, 2004.
[6] F. Javed, Integrated prioritization and optimization approach for pavement management, doctoral diss., National university of Singapore, 2011.