GSM Based Air Quality Monitoring and
Analysis Using Wireless Sensor Node
Afrah Mohammad
P.G. Student, Department of Electronics & Telecomm Engineering, Anjuman College of Engineering & Tech, Nagpur,
Maharashtra, India
ABSTRACT:The main objective of this project is to devise a simple low cost air pollution monitoring system based on
microcontroller using wireless technology which detects presence of various gases like CO2,SO,NO,etc and parameters like humidity ,temperature ,etc. , displays it on LCD and forwards it to remote user. This project is developed by using PIC 16F877A Microcontroller, SIM 900 GSM Module, JHD204A LCD display and gas sensors. The advantage of using GSM based technology is that GSM based communication network is distributed over a large area and have almost reached to every part of the world. GSM technology also does provide users with high quality signal and channels, giving them access to high quality digital communication at affordable cost.
This embedded system can be useful for anyone who wish to monitor the quality of air at a location without being physically present there .The main advantages of the research are that the system may be able to collect the pollution levels throughout the day and also the data so collected may serve as a data base which can be used for various analysis as and when required .The system may offer pollutant levels of a particular industry and this estimation may serve as an ready reckoner to the government for allowing or disallowing a particular industry to be set up in a particular area..
KEYWORDS: Air pollution,Mictrocontroller, Embedded system, Pollutant levels
I.INTRODUCTION
II.LITERATURE REVIEW
In [6], an actual deployment of a wireless sensor network is described. The purpose of the sensor network is to monitor and analyze air quality in Doha. Small scale wireless sensor stations communicate with a backend server to relay their measurements in real-time. Data stored on the server is subjected to intelligent processing and analysis in order to
present it in different formats for different categories of end users. This paper describes a user friendly computation of an air quality index to disseminate the data to the general public. In addition, it describes data presentation for environmental experts using dedicated software tools, e.g. the R software system and its Open Air package. Analysis and assessment of real measurement data is also performed in the paper.
In [8] an Environmental Air Pollution Monitoring System (EAPMS) for monitoring the concentrations of major air pollu- tant gases has been developed, complying with the IEEE 1451.2 standard. This system measures concentrations of gases such as CO, NO , SO , and O using semiconductor sensors. The smart transducer interface module (STIM) was implemented using the analog devices’ ADuC812 microconverter. Network Capable Ap- plication Processor (NCAP) was developed using a personal com- puter and connected to the STIM via the transducer independent interface. Three gas sensors were calibrated using the standard calibration methods. Gas concentration levels and information re- garding the STIM can be seen on the graphical user interface of the NCAP. Further, the EAPMS is capable of warning when the pollutant levels exceed predetermined maxima and the system can be developed into a low cost version for developing countries.
III
.
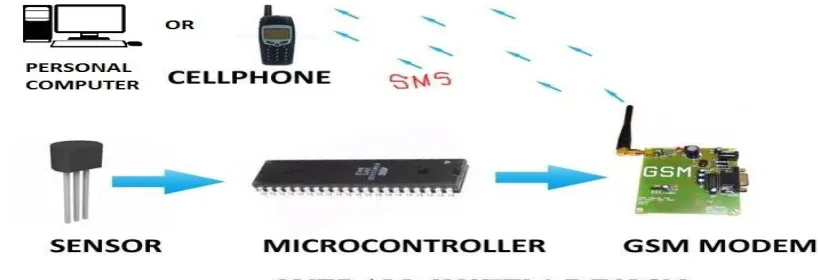
SYSTEM MODELOur air pollution monitoring System is an automated version of monitoring the quality of air and sending the information to a distant database wirelessly. Our system has got almost all things automated so that we get an advantage of this concept ie the real time direct measurement of the parameters (here air quality) through GSM/PC. Maintaining backup of sent data is easy and can be done within a few seconds. This model uses gas sensors, GSM module (SIM900), LCD JHD 162A and a PIC 16F877 microcontroller. The GSM module is connected to PC through RS232 cable.
Figure 1. System hardware architecture
The system model is shown in figure 1which says about the connectivity of all mentioned devices. The LCD is attached to PIC 16F877 to simultaneously display the measured temperature, through which we can experimentally check whether the data that is being sent is correct .
different places. These sensors will record the pollutant levels of gases like CO, SO and NO and relay the information through Internet/GSM network to the base station. The data received at the base stations will be arranged in a data base. The data so collected will then be processed and it involves validation, verification, standardization, normalization, aggregations and transformations. After the data is suitably processed the data prediction and analysis will be carried out. Finally conclusion, regulations and recommendations will be proposed. The communication protocol will serve as a mediator between the end user and the data base server.
Our system has got almost all things automated so that we get an advantage of this concept i.e. the real time direct measurement of the parameters (here air quality) through GSM/PC. Maintaining backup of sent data is easy and can be done within a few seconds. This model uses gas sensors, GSM module (SIM900), LCD JHD 162A and a PIC 16F877 microcontroller. The GSM module is connected to PC through RS232 cable. The system model is shown in Figure 3.1 which says about the connectivity of all mentioned devices. The LCD is attached to PIC 16F877 to simultaneously display the measured temperature, through which we can experimentally check whether the data that is being sent is correct .
The proposed system is designed by integrating the following hardware modules shown in figure 2. As the figure 2 shows, the system consists of a PIC16F877A microcontroller integrated with a sensor array using analog ports. The hardware unit is also connected to a GPS module and a GSM-Modem using the RS-232 interface. Each of these components is described below:
1. PIC16F877A microcontroller
The PIC16F877A microcontroller is the main component of a pollution detection unit . The operating system that runs inside the chip coordinates the substances measurement process, the acquisition of the GPS coordinates and the data transmission to the central server. The microcontroller is mounted on a development board that provides an RS232 serial communication to the GSM modem and GPS receiver and a parallel connection to the gas sensors. The connection between the gas sensors and the PIC16F877A microcontroller can’t be made directly because of the very small output voltages provided by the sensors (mA).This problem is solved by using auxiliary electronic circuits for signal conversion like OA (Operational Amplifiers) and transistors.
2. Sensors Array
The sensor array consists of three air pollutions sensors including Carbon Dioxide (CO2), Nitrogen Dioxide (NO2), and Sulfur Dioxide (SO2). The resolution of these sensors is sufficient for pollution monitoring. Each of the above sensors has a linear current output in the range of 4 mA–20 mA. The 4 mA output corresponds to zero-level gas and the 20 mA corresponds to the maximum gas level. A simple signal conditioning circuit is designed to convert the 4 mA–20 mA range into 0–5 V to be compatible with the voltage range of the built-in analog-to-digital converter in the PIC microcontroller.
3. GPS Receiver
Figure 2 : Block Diagram Of Proposed Air Quality Monitoring System
variation and direction, mode, and checksum. The only information required for the proposed system is date, time, latitude and longitude. The GPS modem is interfaced with the microcontroller using the RS-232 communication standard.
4. GSM Modem
The GSM net used by cell phones provides a low cost, long range, wireless communication channel for applications that need connectivity rather than high data rates. Machinery such as industrial refrigerators and freezers, HVAC, vending machines, vehicle service etc. could benefit from being connected to a GSM system. This application note describes how to use an AVR to control a GSM modem in a cellular phone. The interface between modem and host is a textual protocol called Hayes AT-Commands. These commands enable phone setup, dialing, text messaging etc. This particular application connects an AVR Butterfly and Siemens® M65 cellular phone using a RS232 based data cable. Most cellular phones could be used, except Nokia® phones using F or M-bus.
5. Central Server
The Central-Server is an off-the-shelf standard personal computer with accessibility to the Internet. The Pollution-Server is connected to the GSM Modem via RS- 232 communication standard. The air pollution information sent from GSM transmitter is collected to the GSM receiver and then the data is saved to database of central server.
Clients such as the municipality, environmental protection agencies, travel agencies, insurance companies and tourist companies can connect to the Central-Server through the Internet and check the real-time air pollutants level using a normal browser on a standard PC or a mobile device. The Pollution- Server can be physically located at the Environmental Protection Agency (EPA) or similar government agencies.
IV. SOFTWARE MODULE
V. RESULT ANALYSIS AND DISCUSSION
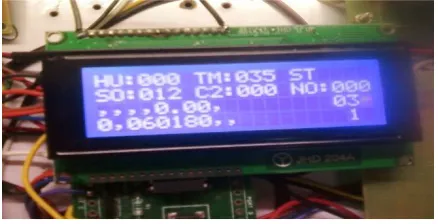
The gas sensor senses the pollutant levels in an area and the data is sent to MCU. Crystal-oscillator generates frequency of 11.0952MHz used for operation, the data is stored in EPROM chip which is simultaneously displayed on LCD. Microcontroller stores the digital data after converting the analog data from sensor unit through ADC, for some delay unit of time and resets the reading in MCU as well as in LCD. After the sensors sense the pollutant levels,the LCD displays the output as shown in figure 3.
Figure 3. LCD frame showing pollutant levels
After the data has been processed by PIC and transmitted over the GSM,it is fed to the database and the pollutant levels are displayed on the front end created in visual basic.The following figure 4 is a VB frame showing the pollutant levels.
Figure 4. VB frame showing pollutant levels
VI.CONCLUSION
REFERENCES
1] Hiroaki Kuze ,Yutaro Goto,Yusaku Mabuchi,Hayato Saitoh,Ilham Alimuddin,Gerry Bagtasa,Ippei Harada,Toshihiko Ishibashi,Takuma Tsujimoto And Shumpei Kameyama, “Urban Air Pollution Monitoring Using Differential Optical Absorption Spectroscopy (DOAS) And Wind Lidar”,IGARS 2012, p.p 3638-3641.
[2] C. J. Wong, M. Z. MatJafri, K. Abdullah, H. S. Lim and K. L. ,“Temporal Air Quality Monitoring Using Surveillance Camera”
[3] Sebastian Bader, Mathias Anneken, Manuel Goldbeck and Bengt , “SAQnet: Experiences From The Design Of An Air Pollution Monitoring System Based On Off-The-Shelf Equipment”,ISSNIP 2011 IEEE,p.p 223-228
[4]Zhixian Yan, Julien Eberle and Karl Aberer , “OptiMoS: Optimal Sensing for Mobile Sensors”,2012 IEEE 13th International Conference On Mobile Data Management.
[5]Zhou Guobing and Wang Shigong , “The Research Of Urban Air Pollution Weather Characteristics Under The Special Terrain”,2010 International Conference On Digital Manufacturing And Automation.
[6] Elias Yaacoub, Abdullah Kadri, Mohammed Mushtaha, and Adnan Abu-Dayya, “Qatar,Air Quality Monitoring and Analysis in Qatar using a Wireless Sensor Network”, IEEE 2013,p.p. 593-601
[7] Kai Wang,Yanan , Ding,Hong Zhao , Lujian Hou,Fengjuan Sun , “Optimization Of Air Pollutant Monitoring Stations Based On Genetic Algorithm”, 2013 4th International Conference On Emerging Intelligent Data And Web Technologies.
[8] Nihal Kularatna and B. H. Sudantha, “An Environmental Air Pollution Monitoring System Based on the IEEE 1451 Standard for Low Cost Requirements”,IEEE Sensors Journal, vol 8,no. 4,april 2008.
[9]Young Jin Jung, Yang Koo Lee, Dong Gyu Lee, Keun Ho Ryu, Silvia Nittel “Air Pollution Monitoring System Based On Geosensor Network”,IGARS, p.p. 1370-1373,2008.