Study and Comparison of Surface Roughness
between Experimental and Analytical Data of
Forged Al-Tib
2
Composite
Hemavathy.S
1, C.N.Chandrappa
2,Swathi M B
3, Shaila d Hosmani
4Research Scholar, Department of Mechancial Engineering, M.S.Ramaiah Institute of Technology, Bangalore,
Karnataka, India.1
Professor & Head, Department of Mechanical Engineering, Acharya Institute of Technology, Bangalore, Karnataka,
India.2
Assistant Professor, Department of Mechanical Engineering, Acharya Institute of Technology, Bangalore, Karnataka,
India.3
Associate Professor, Department of Mechanical Engineering, R R Institute of Technology, Bangalore, Karnataka,
India.4
ABSTRACT: Aluminium composites are very rapidly replacing engineering metals and alloys because of its lightweight and high strength in Aerospace and Bio-medical applications etc. In the present work Al-TiB2 composite is
fabricated by In-situ technique. The intensive study and comparison of surface roughness of Aluminium TiB2
composite is carried out. The material is subjected for turning operation to study the surface roughness.
This study focuses on developing an empirical model for prediction of surface roughness on forged, forged-heat treated composite. The working parameters considered in the model are, speed, feed, depth of cut, and tool nose radius. The test results show that the value of surface roughness is low at high cutting speed and comparatively high at low cutting speed. Surface roughness increases with increase in feed and depth of cut. However it decreases with increasing tool nose radius and surface roughness increases as wt. % of TiB2 increases in aluminium.
The value of surface roughness predicted this model compares verified/ with experimental results. Results so obtained from experimentation and statistical test results demonstrate that the model developed in this study have a satisfactory compatibility in both model construction and verification.
KEYWORDS:Al-TiB2, composites, empirical model, surface roughness
I. INTRODUCTION
automobile industries [1]. But machining MMCs is one of the major problems, which limits the spectrum of engineering application [2].
From some early conventional turning tests on MMCs [3, 4], it is found that the tool wear is excessive and surface finish is very poor when carbide tip tools are used for machining. The hard reinforcement particles of MMC, which intermittently come in contact to the hard surface, are acting as small cutting edges like those of a grinding wheel on the cutting tool edge which in due course is worn out by abrasion and resulting in the formation of poor surface finish during turning [5].
Al-TiB2 composite being a new material not much data is available on machining the same and it require to
optimize the cutting parameters in order to have a good surface finish, which is one of the important criteria in aerospace application. Hence machinability study on this material has been carried out. Finally developing a mathematical model using data mining technique, which is commonly referred as nonlinear- regression analysis. The mathematical model is transformed to software, which can predict optimum cutting parameters for surface roughness and vice versa. Further actual machining has been carried out to ascertain the feasibility of predictor. Also the same procedure of developing a surface roughness model for Al-TiB2 composite is carried out after the material is subjected
to forging and forged-heat treatment processes and the results are compared among forged, forged-heat treated process.
II.EXPERIMENTAL RESULTS
The matrix alloy chosen for this work is A2024 Al-Cu-Mg alloy. It is one of the high strength alloys that render favorably heat treatment.
Reinforcement:
TiB2 as reinforcement has been synthesized with chemicals by initiating an exothermic reaction.
Chemical Reactants:
Titanium boride was been synthesized in the matrix as reinforcement by addition of the reaction mixture into the molten matrix alloy.
The reactants used were;
(i) Titanium di oxide (TiO2) particles
(ii) Cryolite (Na3 AlF6, i.e. Sodium hexafluro aluminates) particles
(iii) Potassium tetra fluoro borate (KBF4)
Exothermic reaction takes place due to the heat in the alloy, with the formation of TiB2.
2.2 Apparatus Melting unit:-
The details of composite preparation and processing parameters are presented. The melting unit depicted in Fig.1 was an electric resistance-heating furnace of 4kw heating capacity, with a controller to monitor the temperature with in ±20 C accuracy. The furnace has a chromel - alumel thermocouple and digital indicator and is capable of melting 5kg of metal. The furnace can attain a maximum temperature 12000 C. The melt temperature was maintained at 8100 C.
Property measurements
Fig.2 shows, the software is developed by using visual basic programming language for predicting surface roughness for given cutting parameters and vice versa. Using the prediction models obtained by regression analysis both before and after the heat treatment, the models are utilized separately in the development of the software to get surface roughness predictor for each ‘before heat treatment and after heat treatment’ conditions.
Fig.2 Window of surface roughness predictor software
III. RESULTS AND DISCUSSIONS
Composite materials with various weight percentages of TiB2 were prepared as per the procedure given in
previous chapter and subjected to different processing conditions. In this section, in-situ composites were subjected to machinability studies under as cast state, where surface roughness is determined experimentally and compared the same with the analytical results obtained by a computer program. Then this material is subjected to heat treatment and the surface roughness is determined experimentally and analytical method. In this section, the effect of cutting parameter like speed, feed, depth of cut and tool nose radius on surface roughness by prediction and experimental are presented and discussed.
Comparison of experimental and predicted Ra when cutting speed is varied
From the Fig 3,it is observed that the Ra values decreases as the speed increase as against predicted constant Ra value. The maximum error between experimental and the predicted surface roughness is 0.983µm and the maximum relative percentage error is 14.66.
Fig.3 Comparison of experimental and predicted Ra when cuttingspeed is varied
Comparison of experimental and predicted Ra when cutting feed is varied
From the Fig.4, it is observed that the experimental and the predicted surface roughness are very close. The experimental and the predicted surface roughness increases as feed increases. It is observed that the maximum error between the experimental surface roughness and predicted surface roughness is 1.11µm and maximum relative percentage error is 11.71.
0 1 2 3
420 1200
R
a
(µ
m
)
Speed, rpm
predicted
Fig. 4 Comparison of experimental and predicted Ra when cutting feed is varied
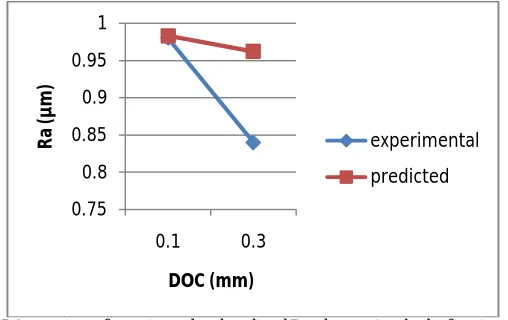
Comparison of experimental and predicted Ra when cutting depth of cut is varied
In the Fig.5, experimental surface roughness is less compared to predicted surface roughness. It is observed that the maximum error between the experimental surface roughness and predicted surface roughness is 0.983µm and maximum relative percentage error is 0.305.The variation in the figure shows that experimental and predicted values decreasing as depth of cut increases so it concludes that the mixing of TiB2 particles and while turning operation the
tool surface will be improper, in that case the variations occur.
Fig. 5 Comparison of experimental and predicted Ra when cutting depth of cut is varied
Comparison of experimental and predicted Ra when cutting tool nose radius is varied
From Fig.6, it can be considered that the experimental surface roughness decreases as the tool nose radius increases as against predicted surface roughness. It is observed that the maximum error between the experimental surface roughness and predicted surface roughness is 0.395 µm and maximum relative percentage error is 0.041.
0 0.5 1 1.5
0.05 0.11
R
a
(µ
m
)
Feed (mm/min)
experimental
predicted
0.75 0.8 0.85 0.9 0.95 1
0.1 0.3
R
a
(µ
m
)
DOC (mm)
experimental
Fig.6 Comparison of experimental and predicted Ra when cutting tool nose radius is varied
Comparison of experimental and predicted Ra when cutting % of TiB2 is varied
From the Fig.7 shows that Ra values are higher than predicted values at 2% TiB2. It is observed that the
maximum error between the experimental surface roughness and predicted surface roughness is 0.42 µm and maximum relative percentage error is 45.
Fig.7 Comparison of experimental and predicted Ra when cutting % of TiB2 is varied
IV. CONCLUSION
Surface roughness is low at low wt. % of TiB2 in aluminium and comparatively high at higher % of TiB2 in aluminium.
However maximum value of surface roughness is observed with 2% TiB2 composition. The trend of surface roughness
predicted by model is similar to the trend obtained by experimental values. However marginal deviations are observed from prediction which may be due to the model prediction accuracy.Hardness of the forged- heat treated under different wt% of TiB2 composite increases than the forged Al-TiB2 composite. Irrespective of the percentage composition of
TiB2, surface roughness values increase after forged-heat treatment.In many cases it was observed that forged-heat
treated composite had higher surface roughness value whereas forged Al-TiB2 composite showed comparatively lesser
values.
REFERENCES
[1] M. Bertalmio, G. Sapiro, V. Caselles, and C. Ballester, “Image inpainting”, in Proc. SIGGRAPH, pp. 417–424, 2000.
0 0.2 0.4 0.6 0.8 1 1.2
0.4 0.8
R
a
(µ
m
)
TNR (mm)
experimental
predicted
0 0.2 0.4 0.6 0.8 1 1.2
0 2 4 6 8 10 12
R
a
(µ
m
)
% of TiB2
experimenta l
[3] Marcelo Bertalmio, Luminita Vese, Guillermo Sapiro, Stanley Osher, “Simultaneous Structure and Texture Image Inpainting”, IEEE Transactions On Image Processing, vol. 12, No. 8, 2003.
[4] Yassin M. Y. Hasan and Lina J. Karam, “Morphological Text Extraction from Images”, IEEE Transactions On Image Processing, vol. 9, No. 11, 2000
[5] Eftychios A. Pnevmatikakis, Petros Maragos “An Inpainting System For Automatic Image Structure-Texture Restoration With Text Removal”, IEEE trans. 978-1-4244-1764, 2008
[6] S.Bhuvaneswari, T.S.Subashini, “Automatic Detection and Inpainting of Text Images”, International Journal of Computer Applications (0975 – 8887) Volume 61– No.7, 2013
[7] Aria Pezeshk and Richard L. Tutwiler, “Automatic Feature Extraction and Text Recognition from Scanned Topographic Maps”, IEEE Transactions on geosciences and remote sensing, VOL. 49, NO. 12, 2011
[8] Xiaoqing Liu and Jagath Samarabandu, “Multiscale Edge-Based Text Extraction From Complex Images”, IEEE Trans., 1424403677, 2006 [9] Nobuo Ezaki, Marius Bulacu Lambert , Schomaker , “Text Detection from Natural Scene Images: Towards a System for Visually Impaired
Persons” , Proc. of 17th Int. Conf. on Pattern Recognition (ICPR), IEEE Computer Society, pp. 683-686, vol. II, 2004
[10] Mr. Rajesh H. Davda1, Mr. Noor Mohammed, “ Text Detection, Removal and Region Filling Using Image Inpainting”, International Journal of Futuristic Science Engineering and Technology, vol. 1 Issue 2, ISSN 2320 – 4486, 2013
[11] Uday Modha, Preeti Dave, “ Image Inpainting-Automatic Detection and Removal of Text From Images”, International Journal of Engineering Research and Applications (IJERA), ISSN: 2248-9622 Vol. 2, Issue 2, 2012
[12] Muthukumar S, Dr.Krishnan .N, Pasupathi.P, Deepa. S, “Analysis of Image Inpainting Techniques with Exemplar, Poisson, Successive Elimination and 8 Pixel Neighborhood Methods”, International Journal of Computer Applications (0975 – 8887), Volume 9, No.11, 2010