ABSTRACT
HO, TSUNG-HSUAN. PREC: Practical Root Exploit Containment for Android Devices. (Under the direction of Dr. Xiaohui (Helen) Gu and Dr. William Enck.)
Application markets such as the Google Play Store and the Apple App Store have
become the de facto method of distributing software to mobile devices. While the offi -cial markets dedicate significant resources to detecting malware, state-of-the-art malware
detection can be easily circumvented using logic bombs or checks for an emulated
envi-ronment. We present a Practical Root Exploit Containment (PREC) framework which
protects users from this type of conditional malicious behavior. PREC can dynamically
identify system calls from high-risk components (e.g., third-party native libraries) and
execute those system calls within isolated threads. This allows PREC to detect and stop
root exploits with high accuracy without interfering with benign applications. We have
implemented PREC and evaluated our methodology using 140 of the most popular
be-nign applications along with 10 root exploit malicious applications. Our results show
that PREC can successfully detect and stop all the tested malware while reducing the
false alarm rates by more than an order of magnitude over traditional malware detection
algorithms. PREC is light-weight, which makes it practical for runtime on-device root
©Copyright 2013 by Tsung-Hsuan Ho
PREC: Practical Root Exploit Containment for Android Devices
by
Tsung-Hsuan Ho
A thesis submitted to the Graduate Faculty of North Carolina State University
in partial fulfillment of the requirements for the Degree of
Master of Science
Computer Science
Raleigh, North Carolina
2013
APPROVED BY:
Dr. Xiaohui (Helen) Gu Co-chair of Advisory Committee
Dr. William Enck
Co-chair of Advisory Committee
DEDICATION
BIOGRAPHY
The author has completed his B.S. degree in Computer Science and Engineering in 2006
from National Sun Yat-sen Univeristy, Taiwan and M.S. degree in Information Systems
and Applications in 2008 from National Tsing Hua University respectively. He then joined
CyberLink for smartphone and multimedia development. In fall 2011, he returned to
school joining NC State University as a Ph.D. student in Computer Science Department.
He transferred to M.S. track in 2013. After completion of his master degree, he will be
ACKNOWLEDGEMENTS
I would like to thank Dr. Xiaohui Gu and Dr. William Enck for being great advisors and
mentors. This thesis would not have been possible without their guidance and support. I
would like also thank Dr. Min Chi for taking the time to be on my thesis committee and
for being supportive to my research. I would like especially thank Daniel Dean for his
tremendous help to this thesis. I also thank my peers Al Gorski, Chin-Jung Hsu, Adwait
Nadkarni, Hiep Nguyen, Ashwin Shashidharan, and Vasant Tendulkar for their valuable
TABLE OF CONTENTS
LIST OF TABLES . . . vi
LIST OF FIGURES . . . vii
Chapter 1 Introduction . . . 1
1.1 Motivation . . . 1
1.2 Summary of the State of the Art . . . 2
1.3 Proposed Solution . . . 3
1.4 Thesis Statement . . . 4
1.5 Contributions . . . 5
1.6 Assumptions . . . 5
1.7 Summary of Experiment Results . . . 6
1.8 Thesis Organization . . . 7
Chapter 2 Overview . . . 8
Chapter 3 System Design and Prototype Implementation . . . 12
3.1 System Call Origin Identification . . . 12
3.2 On-Device Root Exploit Detection . . . 15
3.2.1 Normal app behavior learning. . . 15
3.2.2 Use of system call arguments. . . 18
3.2.3 Runtime root exploit detection. . . 19
3.3 Automatic Root Exploit Containment . . . 19
Chapter 4 Experimental Evaluation. . . 21
4.1 Evaluation Methodology . . . 21
4.2 Results and Analysis . . . 27
Chapter 5 Related Work . . . 42
Chapter 6 Discussion . . . 46
Chapter 7 Conclusion . . . 48
LIST OF TABLES
Table 4.1 Malware samples tested in the experiments. The first 4 malware samples are existing malware and the last 6 malware samples are repackaged AngryBirds applications with existing root exploits. . . 22 Table 4.2 Anomaly detection model training time comparison. The experiment was
conducted on a CentOS 6.2 Linux server with a 2.5GHz Intel XEON X3440 qual-core processor (HyperThreading disabled) and 8GB of phys-ical memory. The average per-app system call sequence number is 244K under all system call monitoring and 106K under native thread system call monitoring. . . 34 Table 4.3 Malware detection and containment results.. . . 37 Table 4.4 Delay-based containment impact to benign apps with false alarms. Each
application run lasts three minutes. . . 39 Table 4.5 Anomaly detection model training and runtime detection time
compari-son. For HMM, “S=i” means the number of states is configured to bei
LIST OF FIGURES
Figure 2.1 Overview of the PREC architecture. When the developer submits an app to the app market, the market performs extensive malware detection in a controlled emulator. If the app is detected as mal-ware, it is rejected. If not, a normal execution profile is saved and forwarded to the PREC service. When a smartphone user down-loads an app, the normal execution profile is retrieved. PREC then monitors operation and contains root exploits on the phone. . . . 9
Figure 3.1 Thread-based system call origin identification. When a third-party native function is called, we dynamically choose a thread from a pool of special “native threads” to execute the function. . . 13 Figure 3.2 SOM update example using the input vector [1,2,4]. . . 16
Figure 4.1 Percentage of system calls originated from native code for 10 mali-cious apps. . . 27 Figure 4.2 Percentage of system calls originated from native code for 80 apps
with native code. . . 28 Figure 4.3 Per-app malware detection accuracy comparison results for 80 apps
with native code. Detection was performed without consideration of arguments. . . 30 Figure 4.4 Percentage of system calls originated from native code for 80 apps
with native code. Detection was performed with consideration of arguments. . . 30 Figure 4.5 Per-app malware detection accuracy comparison results for 60 apps
that do not have any native code. Detection was performed without consideration of arguments. . . 31 Figure 4.6 Per-app malware detection accuracy comparison results for 60 apps
that do not have any native code. Detection was performed with consideration of arguments. . . 31 Figure 4.7 Per-sequence false positive rate comparison for 80 apps that
in-clude native code. Detection was performed without consideration of arguments. . . 32 Figure 4.8 Per-sequence false positive rate comparison for 80 apps that
in-clude native code. Detection was performed with consideration of arguments. . . 32 Figure 4.9 Per-sequence false positive rate comparison for 60 apps that do not
Figure 4.10 Per-sequence false positive rate comparison for 60 apps that do not include any native code. Detection was performed with considera-tion of arguments. . . 33 Figure 4.11 Per-app malware detection accuracy comparison (with or without
cross-validation) results for 80 apps with native code. Detection was performed without consideration of arguments. . . 35 Figure 4.12 Per-app malware detection accuracy comparison (with or without
cross-validation) results for 80 apps with native code. Detection was performed with consideration of arguments. . . 35 Figure 4.13 Per-sequence false positive rate comparison (with or without
cross-validation) for 80 apps that include native code. Detection was performed without consideration of arguments. (CV: cross validation) 36 Figure 4.14 Per-sequence false positive rate comparison (with or without
cross-validation) for 80 apps that include native code. Detection was performed with consideration of arguments. (CV: cross validation) 36 Figure 4.15 PREC runtime performance overhead under di↵erent benchmark apps
Chapter 1
Introduction
1.1
Motivation
The rise in popularity of smartphones can be greatly attributed to the vast and
di-verse collection of available third-party applications. Popular application markets (e.g.,
Apple’s App Store, and the Google Play Store) currently contain over 700,000
applica-tions each [13, 55]. Markets have become a boon for users and developers, but they also
provide a distribution point for malware. While markets perform malware analysis (e.g.,
Bouncer [40]), dynamic analysis environments can be easily detected by malware through
methods such as checking certain system properties or IP addresses [20, 23, 45]. Once an
analysis environment is detected, the malware can simply mask its malicious activities
by using logic bombs or by disabling the attack. Current mitigation solutions include
hiding or removing emulated features commonly detected by malware and using static
analysis to identify all possible code paths [23]. The latter is expensive and can be easily
perturbed using code obfuscation.
market malware analysis. Our key observation is that dynamic malware analysis
per-formed by application markets provides an opportunity to learn a normal behavior pro-file for an application. We then use runtime system call anomaly detection and malware containment to protect the user from malicious activities (e.g., exploiting a root
privi-lege escalation vulnerability). In e↵ect, this forces application authors to commit to the behavior during market malware analysis. Therefore, zero-day malware that uses logic
bombs or other techniques to change execution based on an emulated environment will be
detected on the smartphone device at runtime. Our approach is designed specifically to
target malware that tries to evade powerful dynamic malware analysis which can detect
any suspicious system state changes using more heavyweight techniques such as virtual
machine introspection [57].
1.2
Summary of the State of the Art
To develop a normal execution profile for each application, we use system call sequence
monitoring. System call based intrusion detection system (IDS) was first introduced by
Forrest et al. [25] in 1996. There are two general system call sequence monitoring
ap-proaches used by IDS to detect malicious code. The first approach, called signature-based
detection, learns the specific sequence of system calls or patterns corresponding to the
malicious code. Recent work such as CloudAV [46] and DroidRanger [62] falls into this
category. While signature-based detection is very good at identifying known malicious
sequences, it cannot detect zero-day malware. It is also difficult for such signature based
approaches to detect mimicry attacks. The second approach, called anomaly-based
de-tection, tries to learn the normal system call sequences generated by the application as
knows the normal behavior, malicious code should be detected as abnormal behavior.
For-rest’s work [25] is an example of this approach. Their approach characterizes system call
sequences into fixed-length ngram patterns that are stored in a database. Any behavior that deviates from these patterns is determined malicious. While this approach can
usu-ally detect malicious behaviors, it su↵ers from false positives and is vulnerable to mimicry
attacks. These two aspects are at odds. Reducing false positives often requires making
the detection algorithm less sensitive to change; however, this simultaneously makes the
algorithm more susceptible to mimicry attacks. Hence, several algorithms have been
in-troduced to improve the precision and the accuracy of anomaly-based intrusion detection
systems. For example, Warrender et al. [54] uses hidden Markov models (HMMs) and
previous work has adapted algorithms from artificial neural network (ANN) [16, 35, 22].
Although these e↵orts can achieve reasonably low false positive rates, we observe that
existing approaches raise false alarms for most of the tested applications. We call this
kind of false alarms per-application false positives.
1.3
Proposed Solution
To this end, we present the Practical Root Exploit Containment (PREC) framework for
the Android platform. PREC adapts anomaly-based approach to detect root privilege
escalation attacks due to the ability of the anomaly-based approach to find zero-day
malware, along with the benefit of not requiring any malicious sequences. Like many
similar anomaly detection systems, the primary challenge of making PREC practical
is achieving a low false alarm rate [18] to minimize the interruption of using benign
applications. PREC addresses this challenge by using two novel techniques.
on their origins (e.g., the library that initiates the system call). Specifically, PREC focuses
on system calls originating in third-party native libraries to defend against malware that
attempts to gain root privilege of the system [32]. The intuition behind this is that
we observed that existing root privilege escalation attacks are released and performed
through native libraries. Therefore, we focus on the possibly malicious component only
to enhance to detection accuracy.
To stop detected potential attacks, we propose two novel containment approaches. The
first one is calledthread-based termination containment. Unlike traditional ways where the system kills the malicious process when malicious behavior is detected, we only terminate
the malicious thread when PREC raises an alarm. The rationale behind this mechanism
is that the malicious code is usually planted in a benign app. Simply terminating the
malicious thread will not a↵ect the execution of the normal part. Another mechanism we
use is called delay-based containment. When PREC raises alarms, it delays the system call for a period of time. The delay period increases exponentially and decreases linearly.
The intuition behind this mechanism is that we observe malicious attacks usually need
to swamp a large number of system calls in a short time, and delaying the system call
execution can e↵ectively stop the attack. Normal applications, on the other hand, only
have some isolated false alarms, and therefore will not be a↵ected by this approach.
1.4
Thesis Statement
“Monitoring system calls via origin classification and using delay-based containment
1.5
Contributions
This thesis makes the following contributions:
• We present an architecture for mitigating root exploit malware that hides its
ex-istence during dynamic analysis. Our approach forces malware to commit to a
behavior during analysis and malicious attacks are detected and stopped at
run-time.
• We describe a runtime, kernel-level, system call origin identification mechanism
that allows us to build fine-grained behavior models for higher anomaly detection accuracy and more practical malware containment.
• We provide a scalable and robust behavior learning and anomaly detection scheme
using the self-organizing map (SOM) learning algorithm [36] that can achieve both
high accuracy and low overhead.
• We propose a novel delay-based fine-grained approach to contain possible root
privilege attacks while minimizing the false alarm impact to benign applications.
1.6
Assumptions
Our work makes a set of assumptions that are summarized as follows.
• We assume that root escalation attacks can only be performed through native
libraries. Although it is possible for a root privilege escalation attack to originate
from Java code, exploits usually require access to low-level APIs which are difficult
to execute purely in Java. As a result, there is no known existing root exploits
scope, we argue that the protection provided by PREC is extremely valuable in
practice because once the malware has root, it 1) can perform nearly any action,
2) is extremely difficult to remove, and 3) cannot be easily detected with existing
malware analysis techniques based on permissions [51, 47, 19].
• We also assume that the in-market detection system can detect any malicious
be-haviors that can possibly be used to perform root privilege escalation attacks. This
is a reasonable assumption because o✏ine detection system can use powerful
de-tection methods to detect possible attacks from the applications.
• We also assume that the in-market detection system can provide good coverage of
the application behavior.
1.7
Summary of Experiment Results
We have implemented PREC and evaluated our methodology on 140 of the most popular
benign applications (80 with native code and 60 without native code) covering all di↵erent
application categories and 10 root exploit malware (4 known root exploit applications
from the Malware Genome project [61] and 6 repackaged root exploit applications). Our
experiments show that PREC can successfully detect and stop all the tested root exploits.
More importantly, PREC achieves practicality by 1) raising 0 false alarm on the benign
applications without native code. In contrast, traditional schemes without our classified
system call monitoring raise 67-92% per-app false alarms; and 2) reducing the false alarm
rate on the benign applications with native code by more than one orders of magnitude
over traditional anomaly detection algorithms: from 100% per-app false alarm rate (FSA)
Since less than 10% apps in the whole market have native code [32], we expect the false
alarm rate for PREC will be very low in practice. Cross validation does not improve our
per-app false positive rates but posts a huge amount of overhead to the training phase.
Therefore we did not use cross validation in our prototype. Our delay-based fine-grained
containment scheme can not only defeat all the tested root exploit attacks but also
minimize the false alarm impact to the benign applications. Our experiments show that
PREC imposes noticeable false alarm impact to only 1 out of 140 tested popular benign
applications. PREC is light-weight and only imposes less than 3% runtime execution
overhead on the smartphone device.
1.8
Thesis Organization
This thesis is organized as follows. Chapter 2 gives an overview about the system. Chapter
3 presents the detailed design and prototype implementation of the system. In Chapter 4,
we explain the experiment setup and discuss the experimental results. Chapter 5 provides
a survey about the related work. Chapter 6 discuss the assumptions and limitations.
Chapter 2
Overview
ThePractical Root Exploit Containment (PREC) framework extends the existing mobile application market model by providing practical online root exploit detection and
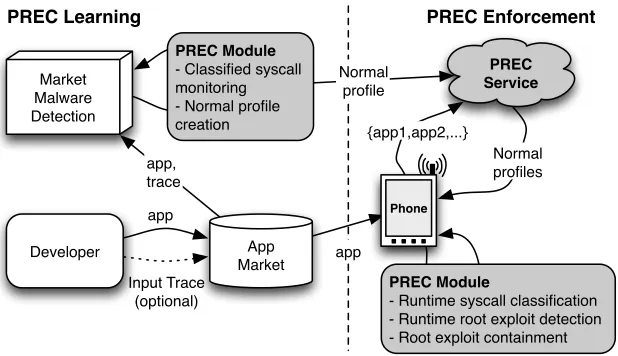
con-tainment for smartphone users. Figure 2.1 depicts the overall PREC architecture. PREC
operates in two phases: 1) PREC Learning: o✏ine training when a developer submits an app into the market; and 2) PREC Enforcement: online enforcement when the user downloads and installs the app.
When a developer submits an app into the market, the market server (e.g., Google’s
Bouncer) runs the app within a controlled emulator, performing comprehensive malware
detection using a combination of signature detection and dynamic analysis. If the
appli-cation contains malicious functionality, the market will reject it. However, as mentioned
earlier, malware authors often attempt to evade the malware detection system using logic
bombs or by not executing malicious code when running in a dynamic analysis
environ-ment [20, 23, 45]. This is where PREC provides its contribution by forcing the app to
commit to a normal behavior. During dynamic malware analysis, PREC records and
App Market Developer Market Malware Detection Phone PREC Service {app1,app2,...} app Input Trace (optional) app, trace
PREC Learning PREC Enforcement
PREC Module
- Runtime syscall classification - Runtime root exploit detection - Root exploit containment
Normal profiles
app PREC Module
- Classified syscall monitoring - Normal profile creation
Normal profile
Figure 2.1: Overview of the PREC architecture. When the developer submits an app to the app market, the market performs extensive malware detection in a controlled emulator. If the app is detected as malware, it is rejected. If not, a normal execution profile is saved and forwarded to the PREC service. When a smartphone user downloads an app, the normal execution profile is retrieved. PREC then monitors operation and contains root exploits on the phone.
labels each system call as originating either from third-party native code or from Java
code. This labeled trace is then used by PREC to create a normal behavior model for
the app. The normal behavior model is sent to the PREC service which could be hosted
within a computing cloud.
During dynamic malware analysis, PREC records and labels a system call trace based
on our classified monitoring criteria. For example, PREC labels each system call as
orig-inating either from third-party native code or from Java code. This labeled trace is then
used by PREC to create a normal behavior model for the app. The normal behavior
model is sent to the PREC service which could be hosted within a computing cloud
(e.g., Amazon EC2). When choosing a model to represent the normal behavior of an
application, we considered several factors such as accuracy, overhead, and robustness to
model (HMM) and finite state automata (FSA), we developed a new lightweight and
robust behavior learning scheme based on the self-organizing map (SOM) [36]. The
SOM was designed to project a high dimensional input space onto a low dimensional
output space. We chose the SOM because it is resilient to noise and is significantly less
computation-intensive than other approaches such as clustering.
Ideally, the normal behavior model should be comprehensive in order to avoid false
alarms. As a result, PREC allows developers to submit an optional input trace to collect
a precise normal execution profile. Dynamic analysis of smartphone apps is currently a
significant challenge for mobile app researchers [29]. Recent research [12] has shown that
submitting an input trace allows developers to reduce the possibility of false positives in
the enforcement phase. More specifically, PREC generates a normal profile by following
an input trace when an input trace is available. If an input trace is not provided, more
traditional test case generation techniques or random input fuzz-testing [31] can be used.
The current prototype of PREC uses a simple random input fuzz testing tool [10]. Our
experiments show that this simple approach can produce high quality behavior models for
most of the real Android apps. However, PREC is a general behavior learning framework,
which can be integrated with any input testing tools.
The enforcement phase uses the normal behavior model from the PREC service to
perform on-device anomaly detection. We specifically focus on malware that exploits root
privilege escalation vulnerabilities. This type of malware represents the highest risk for
smartphones, because it allows for the greatest amount of malicious functionality, can
hide its existence, and is difficult to remove [32]. All existing malware exploiting root
privilege escalation vulnerabilities have done so using third-party native code, whether
it be a library invoked via the Java native interface (JNI), or a stand-alone executable.
third-party native code. Monitoring only third-party native code significantly reduces
false alarms of runtime root privilege escalation attack detection.
PREC further reduces the impact of false alarms by intelligent anomaly containment.
In order to classify system calls originating from third-party native libraries, PREC
ex-ecutes calls to native libraries in a separate native thread. Therefore, when an anomaly occurs, PREC can isolate the infringing thread. At this point, PREC can do one of two
things. The first option is to simply kill the native thread. The intuition behind this
ap-proach is that malware authors usually graft an attack onto a benign application. Killing
just the anomalous native thread will not a↵ect the execution of the benign components.
PREC’s second option is to slow the thread down by inserting an exponentially increasing
artificial delay into system calls that increases whenever an anomaly occurs. Intuitively,
anomalies should be infrequent for benign applications. However, exploiting
vulnerabili-ties will almost always result in a burst of anomalies. The rationale behind our approach
is that address space layout randomization (ASLR) in Android [5] enforces exploits to
repeat the attack sequence many times in order to guess the right stack address.
More-over, most existing root exploits (e.g., Rage Against the Cage) are resource exhaustion
attacks (e.g., continuously forking). By slowing down the malicious activity with a suffi
-cient delay, the exploit becomes invalid or cause an Application Not Responding (ANR)
Chapter 3
System Design and Prototype
Implementation
In this section, we present the design and implementation details of the PREC system.
We first describe the system call origin identification scheme. We then describe our
on-device root exploit detection schemes. Finally, we present our automatic root exploit
containment scheme.
3.1
System Call Origin Identification
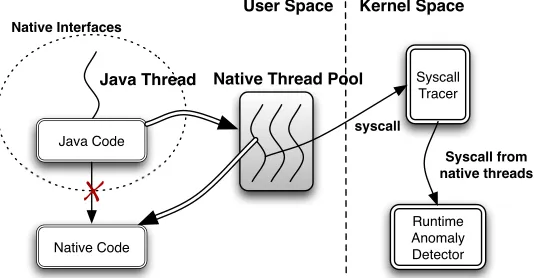
PREC performsclassifiedsystem call monitoring by separating the system calls originated from high risk third-party native code from the system calls issued by the less dangerous
Java code. However, we cannot simply look at the return address of the code that invokes
the system call, because both Java code and third-party native code use system-provided
native libraries (e.g.,libc) to invoke system calls. Performing user-space stack unwinding
Native Thread Pool Java Thread
Java Code
Native Code
User Space Kernel Space Native Interfaces
Syscall Tracer
Runtime Anomaly Detector
Syscall from native threads
X
syscall
Figure 3.1: Thread-based system call origin identification. When a third-party native function is called, we dynamically choose a thread from a pool of special “native threads” to execute the function.
However, such backtrace information resides in the user-space and therefore, needs to
be well protected. Furthermore, most system libraries do not include debug information
(e.g., DWARF [3] or EXIDX [4]) that is needed to unwind the stack. Therefore, we
propose a thread-based approach to identify the system call origins. The basic idea is to
maintain a pool of special threads called native threads and execute all the third-party native functions using those native threads as shown in Figure 3.1.
We build our system call tracer as a Linux kernel module on top of kprobes. Kprobes
are a set of Linux interfaces that allow us to implant probes and register corresponding
handlers. Compared to user space system call tracers (e.g., ptrace [6]) that can introduce
over 20% overhead due to frequent context switches, our kernel tracer only incurs less than
2%. PREC could also use other kernel space system call tracing tools such as SystemTap
[9], DTrace [2], or Linux Trace Toolkit - next generation (LTTng) [7] that are orthogonal
to our approach.
Our system call origin identification scheme leverages the natural boundary between
(including both libraries and executables) in three di↵erent ways. First, Java components
can use the JNI Bridge to call native functions. The JNI Bridge is the aggregation point
that maps Java abstract native function names (i.e.,static native functionappeared
in Java code) to real native function addresses. Second, when the Java code requires a
native library to be loaded, System.loadLibrary() will load the native library to the
memory and then call the JNI OnLoad() callback in the library. Since JNI OnLoad() is
defined by the developer of the native library, it can be used by an adversary to execute
native code. Lastly, Java allows applications to use System.Runtime.exec()to execute
native executables. This function is the best place for attackers to apply root privilege
escalation attacks because most exploits are released as native executables. For the rest
of this thesis, we use native interfaces to represent di↵erent ways to invoke third-party native functions.
When a Java thread needs to invoke a third-party native function through one of the
aforementioned native interfaces, PREC is triggered to suspend the Java thread and use
a native thread to execute the native function instead. One brute force implementation
is to create a new native thread each time the native function is invoked. However,
this simple implementation su↵ers from high performance overhead when the application
frequently invokes native functions. Instead, PREC creates a pool of native threads at
application launch. When a Java thread needs to execute a third-party native function,
we suspend the Java thread and dynamically select an idle native thread to execute
the native function. The native function sometimes calls back to the Java code (e.g.,
NewStringUTF(), which is a function that creates a Java string inside the Java heap).
Under those circumstances, we continue use the native thread to execute the Java function
because it might be a potential attack to Java components. When the native function
Our thread-based system call origin identification scheme has several advantages over
other alternatives. First, the kernel tracer can easily identify the system call origins (i.e.,
from Java or native components) by checking whether the thread belongs to the native
thread pool. Second, the thread-based approach allows us to contain a small portion
of the application rather than kill the whole application. This allows us to minimize the
containment scope (i.e., reducing the disturbance to the user) when the anomaly detection
raises an alarm. We will describe our containment scheme in Section 3.3. Third, PREC can
easily incorporate other execution sandboxing mechanisms (e.g., software fault isolation
[59]) to provide additional security isolations between Java code and malicious native
code.
3.2
On-Device Root Exploit Detection
After we extract the system calls from the high-risk native code, we need to build a normal
profile for the app before it is released to the market. The profile is then transferred to
the smartphone device for runtime root exploit detection.
3.2.1
Normal app behavior learning.
We capture the normal behavior of each application during the market dynamic malware
analysis. As mentioned in the Introduction, we develop a new lightweight and robust
behavior learning scheme based on the self-organizing map (SOM) technique [36]. SOM
is a type of artificial neural network that is trained using unsupervised learning to map
the input space of the training data into a low dimensional (usually two dimensions)
map space. SOM preserves the topological properties of the original input space (i.e.,
Train with [1,2,4]
1 Best Neuron Other neurons
SOM before the update SOM after the update [3,2,4] 2 [4,2,4] 3 [1,3,2] 4 [5,1,4] 5 [2,4,1] 6 [4,2,3] 7 [4,1,4] 8 [2,4,2] 9 [3,3,5] 2 [4,2,4] 3 [1,3,2] 4 [5,1,4] 5 [2,4,1] 6 [4,2,3] 7 [4,1,4] 8 [2,4,2] 9 [3,3,5] 1 [3,2,4] Neighbor neurons Frequency Map 1) [2,2,4]: Count 5 2) [3,2,4]: Count 2
3) [1,2,4]: Count 1
Frequency Map 1) [2,2,4]: Count 5 2) [3,2,4]: Count 2
Frequency Map
1) [1,2,4]: Count 0.8
Figure 3.2: SOM update example using the input vector [1,2,4].
map consists ofn⇥m nodes calledneurons arranged in a grid, illustrated by Figure 3.2. Each neuron is associated with a weight vector that has the same length as the input vector. In our case, both input vectors and weight vectors are sequences of system call
identifiers (ids) of lengthk (i.e., k-grams). Both n,m, andk are configurable parameters
that can be dynamically set during map creation. At map creation time, each weight
vector element is initialized randomly to be a value isuch that 1iS, andS is equal
to the largest system call id. In order to handle applications with di↵erent behaviors,
PREC builds a SOM for each individual application and only uses the system calls
originated by high-risk third-party native code to train the SOM.
The traditional SOM learning algorithm updates weight vectors continuously.
How-ever we cannot use this method directly, since two system calls with similar ids do not
necessarily have similar actions. For example, system call id 12 (sys chdir) is completely
di↵erent than system call id 13 (sys time). To address these issues, we have made two
distance instead of Euclidean or Manhattan distance as a measure of similarity when
mapping input vectors to neurons. This is because graph edit distance only considers
if two items are exactly the same in the weight vector. Second, to address the
continu-ous update problem, we have developed a frequency-based weight vector update scheme,
which we describe next.
Each SOM model training occurs in three iterative steps, illustrated by Figure 3.2.
First, we form an input vector of length k by reading k system calls from the training
data. Second, we examine the graph edit distance from that input vector to the weight
vectors of all neurons in the map. Whichever neuron has the smallest distance is selected
as the winning neuron to be trained. We break ties using Euclidean distance. Third, we
add 1 to the count for the input vector in the frequency map of the winner neuron. At this point we also update the frequency maps of all neighbor neurons. In this example, we
define our neighborhood to be the neurons in a radius of r = 1. The count value added
to the neighbor neuron is reduced based on a neighborhood function (e.g., Gaussian
function) which depends on the grid distance from the winning neuron to the neighbor
neuron. For example, in Figure 3.2, the input vector [1,2,4] is added into the frequency
map of the winning neuron 1 with a count 1 and is also added into the frequency map of
the neighbor neuron 2 with a reduced count 0.8.
The frequency map keeps track of how many times each particular system call
se-quence has been mapped to that neuron. For example, in Figure 3.2, the frequency map
of neuron 1 shows that the sequence [2,2,4] is mapped to the neuron 1 five times, the
sequence [3,2,4] is mapped to neuron 1 two times, and the sequence [1,2,4] is mapped
to neuron 1 just once. We repeat the above three steps for all the system call sequences
recorded in the training data. After training is complete, we use the sequence with the
the count values of all the sequences in the frequency map to denote the frequency count
value for this neuron.
3.2.2
Use of system call arguments.
System call arguments provide finer-grained information to system call anomaly
detec-tions. In PREC, we selected two types of arguments to help detect root exploits: file paths
and socket arguments. We divide each file and socket related system call into multiple
subgroups based on the arguments it contains. Specifically, we classify file paths into two
types: application accessible directories and system directories. We divide socket system
calls into three di↵erent groups based on its protocol type: 1) the socket call that connects
to a remote server on the network, 2) a local server on the device, and 3) a kernel
com-ponent with theNETLINKsocket. Each file or socket system call is assigned with di↵erent
identifiers based on the argument type. For example, the system call open is assigned
with an identifier 5 for accessing its home directory or SD card partition and a di↵erent
identifier (e.g., 300) for accessing the system directories.
Some system calls (e.g., symlink, rename) include two file paths in their arguments.
If the two file paths belong to the same type, we can assign the system call identifier in a
similar way as single file path ones. However, if the two file paths belong to di↵erent types,
we assign a unique identifier to the system call. The intuition behind our approach is that
we observe that benign applications do not simultaneously access files in the application
home directory and the system directory. For example, benign applications do not move
files from its home directory to system partitions and vice versa. In contrast, we observe
that most malicious applications try to access home directories and system directories at
3.2.3
Runtime root exploit detection.
When a user purchases an app from the market, the SOM model is downloaded to the
user’s smartphone. After the application starts, PREC performs runtime system call
origin identification to form the sequences of system calls originated by the native code.
We then match the system call sequences against the SOM model. If a root exploit
begins to execute, PREC identifies system call sequences that are mapped to rarely
trained neurons. Thus, if we map the collected system call sequence to a neuron whose
frequency count is less than a pre-defined threshold (e.g., 0 represents never trained),
the current sequence is considered to be malicious. The threshold allows users to control
the tradeo↵ between malware detection rate and false alarm rate. The map size and
the sequence length are other configuration parameters that might contribute to the
malware detection accuracy tradeo↵. We will quantify such tradeo↵s in the experimental
evaluation section.
3.3
Automatic Root Exploit Containment
When a root exploit is detected, PREC automatically responds to the alarm by containing
the malicious execution. A brute force response to the malware alarm would be killing the
entire application to protect the device from the root compromise. However, this brute
force approach might cause a lot of undesired disturbances to the user, especially when
the anomaly detector raises a false alarm. To address the challenge, PREC provides
fine-grained containment by killing or slowing down the malicious native threads only instead
of the whole application.
PREC enables dynamic native thread termination by inserting a signal handler inside
anomaly detection model sends a predefined signal to the malicious native thread to
terminate the thread. In our current prototype implementation, we use SIGSYS (signal
31) to trigger the native thread termination. We confirm that SIGSYS is not used by
any other Android system components. Furthermore, PREC disallows applications from
sending or registering handlers for SIGSYS.
Although killing native threads can e↵ectively stop the attack, it might still break
the normal application execution when the anomaly detector raises a false alarm. Thus,
PREC provides a second containment option that is less intrusive: slowing down the
native thread by inserting a delay during the native thread execution. Our experiments
show that most root exploits become ine↵ective after we slow down the malicious native
thread to a certain point. The delay-based approach can handle the false alarms more
gracefully since the application will not su↵er from crashing due to the thread killing.
To insert delay into the malicious thread, we force the kernel to call our sleep function
before each system call is dispatched to the corresponding handler. After the anomaly
detection module raises an alarm, it sets a delay value in the task struct of the
mali-cious native thread. Thus, PREC pauses the native thread based on the delay specified
by PREC. The delay time is applied to all subsequent system calls in the thread, and
exponentially increases for each new anomaly. Our prototype starts at 1 ms and
dou-bles per anomaly. There are many potential policies for delay decrease. Our prototype
currently exponentially decreases (halves) for each non-anomalous system call. We also
considered a linear decrease, but found expotential decrease to handle more false alarms.
Chapter 4
Experimental Evaluation
We implement PREC and evaluate our approach using real applications and root exploits.
We evaluate PREC in terms of detection accuracy, malware containment e↵ectiveness,
and overhead.
4.1
Evaluation Methodology
Benign application selection: We first test PREC with a variety of popular benign apps to evaluate the false alarm rate of PREC. We select our benign apps as follows. We
downloaded top 10 popular free apps from all di↵erent application categories (Android
Market includes 34 application categories) to use as benign applications. We then test
those applications from the most popular ones to less popular ones and check whether we
can run them successfully on the emulator and our Samsung Galaxy Nexus device. We
find 80 popular apps include native code and majority of them are games and multimedia
applications. We also test 60 popular apps without any native code. We use more benign
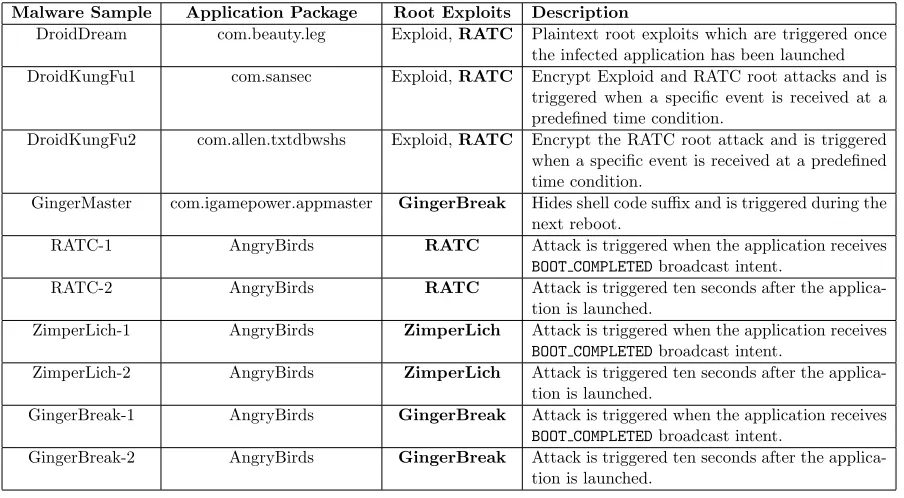
Table 4.1: Malware samples tested in the experiments. The first 4 malware samples are existing malware and the last 6 malware samples are repackaged AngryBirds applications with existing root exploits.
Malware Sample Application Package Root Exploits Description
DroidDream com.beauty.leg Exploid,RATC Plaintext root exploits which are triggered once the infected application has been launched DroidKungFu1 com.sansec Exploid,RATC Encrypt Exploid and RATC root attacks and is
triggered when a specific event is received at a predefined time condition.
DroidKungFu2 com.allen.txtdbwshs Exploid,RATC Encrypt the RATC root attack and is triggered when a specific event is received at a predefined time condition.
GingerMaster com.igamepower.appmaster GingerBreak Hides shell code suffix and is triggered during the next reboot.
RATC-1 AngryBirds RATC Attack is triggered when the application receives
BOOT COMPLETEDbroadcast intent.
RATC-2 AngryBirds RATC Attack is triggered ten seconds after the applica-tion is launched.
ZimperLich-1 AngryBirds ZimperLich Attack is triggered when the application receives
BOOT COMPLETEDbroadcast intent.
ZimperLich-2 AngryBirds ZimperLich Attack is triggered ten seconds after the applica-tion is launched.
GingerBreak-1 AngryBirds GingerBreak Attack is triggered when the application receives
BOOT COMPLETEDbroadcast intent.
GingerBreak-2 AngryBirds GingerBreak Attack is triggered ten seconds after the applica-tion is launched.
alarm rate of PREC since PREC will not raise any false alarm for benign apps without
any native code. In contrast, other alternative schemes without our classified monitoring
techniques will still raise false alarms on those benign apps without native code. We
evaluated all the benign apps using a Samsung Galaxy Nexus device with Android 4.2,
which is equipped with 1.2 GHz Dual-Core cortex A9 processor, and 1GB RAM.
Malware selection: To evaluate the root exploit containment capability of PREC, we extensively studied all the existing real root exploits. Table 4.1 shows the 10 malicious
applications used in our experiments that covers four real root exploits. We first used
four real malware reported by the Malware Genome project [61]. To evaluate PREC
under more challenging cases, we repackage existing root privilege escalation attacks into
believe our malware coverage is extensive, which is explained as follows.
We first studied all the six root exploit malware families (DroidDream, DroidKongFu1,
DroidKongFu2, Ginger Master, BaseBridge, DroidKungFuSapp) reported by the Malware
Genome Project [61]. Our experiments covered the first four malware families. The
Base-Bridge malware only attacks Sony and Motorola devices, which cannot be triggered on
our Nexus phones. The DroidKungFuSapp performs attacks by connecting to a remote
command and control server. However, we found this server is already down at the time
of our testing, which disallows us to trigger the root exploit.
The RiskRanker project [32] and the X-ray project [11] reported 9 root exploits in
to-tal. Our experiments covered four of them (Exploid, RATC, GingerBreak, ZimperLich).
We did not cover the other five root exploits for the following reasons. Three reported
root exploits (Ashmem, zergRush, Mempodroid) are not found in real Android
applica-tions. Ashmem uses a vulnerability that Android failed to protectAndroid Share Memory so unprivileged process can change the value of ro.secure arbitrarily. This variable is
used by the Android Debug Bridge Daemon (ADBD) to determine whether developer
can login asroot. However, attackers cannot embed this exploit into applications because Android applications cannot access ADBD. Similarly,zergRushrequires several informa-tion in ADBD and Mempodroidexecutes run-as inside the Android Debug Bridge shell. Therefore, it is feasible for attackers to utilize those exploits in applications. The rest
two root exploits (Asrootor namedWunderbarin X-ray,Levitator) are not tested due to lack of software or hardware. Asroot targets on Linux kernel version prior 2.6.30-4, and the earliest available version that we can use for Nexus One device is 2.6.32. Levitator targets PowerVR driver and our Nexus One device uses Adreno 200 GPU. However, we
system calls that should never be used by normal applications (e.g., syscall 187 inAsroot) or need to repeatedly execute certain system calls (similar to GingerBreak) to achieve
success.
We tested all the root exploit malware on a Google Nexus One device with Android
2.2 with 1GHz single core cortex A8 processor and 512MB RAM. Although the latest
root exploit in our data set targets Android 2.3, we believe that root privilege escalation
attack is an increasing concern in Android. For example, Google introduced SELinux
in Android 4.3 to mitigate the damage of root escalation attacks [8]. PREC provides a
complementary first-line defense to detect and contain the root escalation attacks.
Model learning data collection in emulator: All the application behavior model learning data were collected on the Android emulator enhanced with our classified
sys-tem call monitoring scheme. We used the Android Monkey [10] tool to generate random
inputs to simulate user behaviors. We chose Monkey in this work because it is the best
publicly available fuzz input generation tool we could find at the time of writing. Previous
work [53] also shows that Monkey can provide similar coverage as manual collection given
sufficient rounds of testing. We note that using Monkey input generation is a limitation
in our current implementation, which will be discussed in detail in Section 6. However,
our experiments show that PREC can achieve high accuracy even by using such a simple
tool. We expect PREC can achieve even more accurate malware detection given a more
powerful input generation tool or using developer provided input traces. Although
previ-ous work [60, 58, 50, 42] proposed to automate the trace collection process by analyzing
decompiled Java source code and standard Android user interface (UI) components, those
approaches cannot be applied to PREC for two main reasons. First, PREC focuses on
applications that contain native code do not use standard UI components. Rather, they
often draw UI components themselves.
Each application learning data collection lasted 10 minutes. For benign applications,
trace collection was performed on a modified Android 4.2 emulator (API level 17). We
collected traces for malicious applications on a modified Android 2.2 emulator (API
level 8) because they require Android 2.2 to trigger the exploits. Note there is no root
exploit triggered in the training data collection phase since we assume that malware try
to hide themselves in the dynamic analysis environment using logic bombs or detecting
emulation. If the root exploit is triggered, the malicious activities will be detected by the
market malware analysis and the application will be rejected.
On-device real application testing data collection: To evaluate the on-device be-nign application false alarm rates and malware detection accuracy of PREC, we employ
real users to run all the 140 benign applications on our Samsung Galaxy Nexus device
with Android 4.2 for collecting realistic user behaviors. For each app, the user is asked to
play the app for about three minutes. Although we could also use the same dynamic
test-ing tool to collect the testtest-ing data automatically, we chose not do so to avoid productest-ing
biased results using the same tool for both learning and testing. For those 10 malicious
applications listed in Table 4.1, we run them on a Google Nexus One device with Android
2.2 and make sure those root exploits are triggered during our testing phase.
prob-abilities and raises an alarm if the observed tradition probability is below a threshold;
3) HMM (full) that uses the hidden Markov model over all system calls; 4) FSA (na-tive)[43] that uses the finite state automaton over the system calls from the native code only, which learns normal system call sequence patterns and raises an alarm if the
ob-served system call sequence transition probability is below a pre-defined threshold; and
5)FSA (full) that uses a finite state automaton over all system calls. Note that we only compare PREC with common unsupervised learning methods since supervised learning methods (e.g., support vector machine [33]) cannot be applied to PREC as they require
malware data during the learning phase and cannot detect unknown malware.
Evaluation metrics: We evaluate the malware detection accuracy using the standard receiver operating characteristic (ROC) curves. ROC curves can e↵ectively show the tradeo↵ between the true positive rate (AT) and the false positive rate (AF) for an
anomaly detection model. We use standard true positive rate AT and false positive rate AF metrics, as shown in Equation 4.1. Ntp, Nf n, Nf p, and Ntn denote the true
posi-tive number, false negaposi-tive number, false posiposi-tive number, and true negaposi-tive number,
respectively.
AT =
Ntp Ntp+Nf n
, AF =
Nf p Nf p+Ntn
(4.1)
A false positive means that our anomaly detection system raises an alarm for a benign
application. A false negative means that we fail to raise any alarm for a malware sample.
In our results, we report both per-sequence (i.e., system call sequence) and per-app true
4.2
Results and Analysis
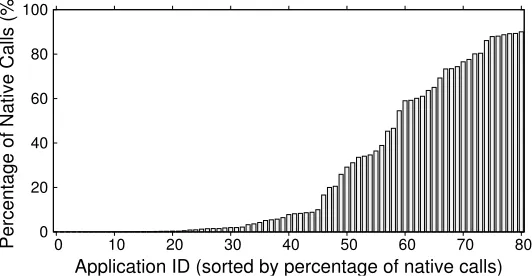
Runtime classified system call monitoring:We first evaluate the e↵ectiveness of our runtime classified system call monitoring module that serves as the foundation for PREC.
Figures 4.1 shows the percentage of the system calls originated from the native code for
the 80 benign apps that include native code. Although all those 80 apps contain native
code, we observe that over 50% of the apps execute less than 10% native code. Thus,
PREC can still filter out a large number of system calls for those benign applications with
native code during model creation and malware detection. We also observe that PREC
never misclassifies a system call from Java as a system call from native code. Thus, PREC
will not raise any false alarm for those benign applications that do not include any native
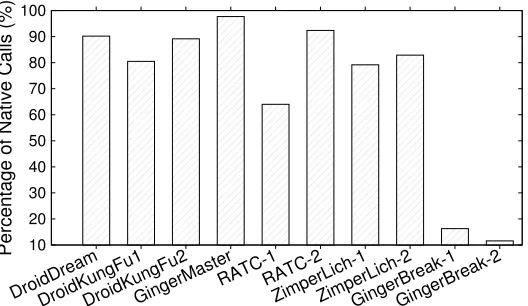
code. Figure 4.2 shows that the classified monitoring results for the 10 malware samples
used in our experiments. We can see most malware applications contain a large portion
of system calls from the native code. This also validates our hypothesis: malware exploits
root privilege escalation vulnerabilities using third-party native code. Thus, our classified
monitoring scheme will not reduce the root exploit detection capability.
0 20 40 60 80 100
0 10 20 30 40 50 60 70 80
Percentage of Native Calls (%)
Application ID (sorted by percentage of native calls)
10 20 30 40 50 60 70 80 90 100
DroidDreamDroidKungFu1DroidKungFu2GingerMasterRATC-1RATC-2ZimperLich-1ZimperLich-2GingerBreak-1GingerBreak-2
Percentage of Native Calls (%)
Figure 4.2: Percentage of system calls originated from native code for 80 apps with native code.
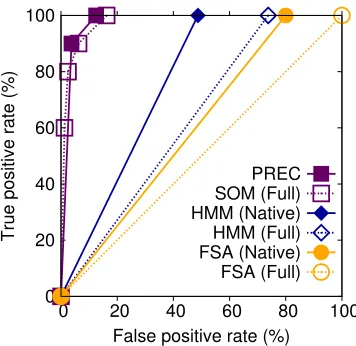
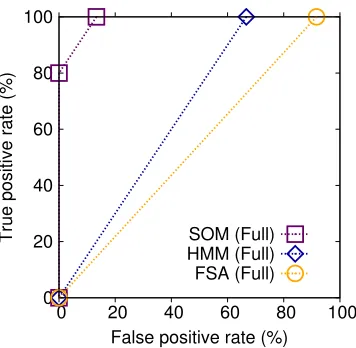
Runtime on-device detection accuracy:We now evaluate the runtime on-device de-tection accuracy of the PREC system. Figure 4.4 and Figure 4.3 shows the per-app true
positive and false positive rate using di↵erent anomaly detection algorithms for the 80
benign apps that include native code. Figure 4.3 shows the results without considering
system call arguments while Figure 4.4 shows the results of including system call
argu-ments. We adjust di↵erent parameters in each anomaly detection algorithm to obtain the
ROC curves. For SOM algorithms, we adjusted the map size, the length of the system
call sequences, the anomalous frequency threshold, and the neighborhood area size. For
HMM and FSA algorithms, we adjusted the number of states, the system call sequence
length, and the anomalous probability threshold. Each point on the ROC curve represents
one accuracy result under a certain configuration setting and we use the configuration
for all the 80 apps. If two configurations produce the same true positive rate but di↵erent
false positive rates, we only plot the point with the smaller false positive rate to show
the best accuracy result of each scheme. The results show that all algorithms can easily
can achieve 49% and 80% false positive rate at their best, respectively. In contrast, PREC
can significantly reduce the false positive rate to 3.75%. This validates our choice of SOM
since SOM is more robust to noise in system calls than HMM and FSA because it projects
the original noisy input space (noisy system call sequences) into a two-dimensional map
without losing principal patterns.
We believe that the user perceived false positive rate of PREC will be even lower
since most popular benign apps do not include native code and PREC will not raise any
false alarm on them with the help of classified system call monitoring. However, without
performing classified system call monitoring, any anomaly detection algorithm might still
raise false alarms on those apps without native code. Figure 4.5 and Figure 4.6 shows the
anomaly detection accuracy results of di↵erent algorithms without using the classified
system call monitoring scheme for 60 benign apps without native code. We observe that
SOM (full), HMM (full), and FSA (full) raise 13%, 67%, and 92% per-app false alarms
at their best under 100% true positive rate. This validates our hypothesis that classified
monitoring can greatly reduce the false alarms in practice during runtime root exploit
detection.
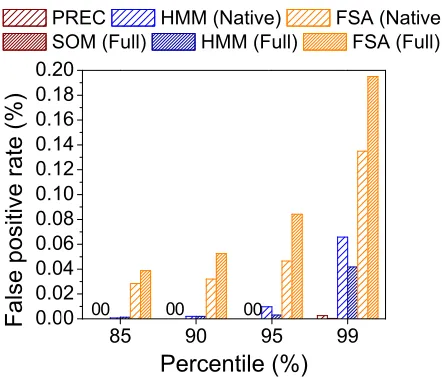
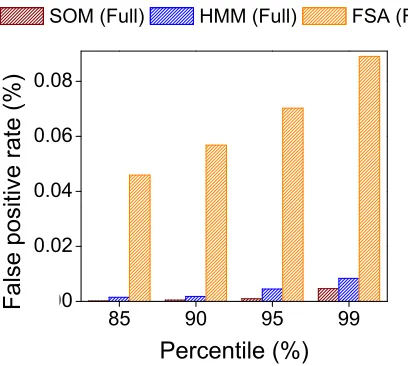
We further compare di↵erent anomaly detection algorithms at fine granularity by
measuring sequence false positive rates. Figure 4.7 and Figure 4.8 shows the
per-sequence false positive rates at 85-99 percentile achieved by di↵erent schemes for the 80
benign apps that include native code. For fair comparison, we pick the configuration for
each algorithm that yields the best per-app anomaly detection accuracy result for the
algorithm. We observe that SOM algorithms can reduce the per-sequence false positive
rates by more than one order of magnitude compared to HMM and FSA. Figure 4.9 and
Figure 4.10 shows the per-sequence false positive rate comparison for the benign apps
0 20 40 60 80 100
0 20 40 60 80 100
True positive rate (%)
False positive rate (%) PREC SOM (Full) HMM (Native) HMM (Full) FSA (Native) FSA (Full)
Figure 4.3: Per-app malware detection accuracy comparison results for 80 apps with native code. Detection was performed without consideration of arguments.
0 20 40 60 80 100
0 20 40 60 80 100
True positive rate (%)
False positive rate (%) PREC SOM (Full) HMM (Native) HMM (Full) FSA (Native) FSA (Full)
0 20 40 60 80 100
0 20 40 60 80 100
True positive rate (%)
False positive rate (%) SOM (Full) HMM (Full) FSA (Full)
Figure 4.5: Per-app malware detection accuracy comparison results for 60 apps that do not have any native code. Detection was performed without consideration of arguments.
0 20 40 60 80 100
0 20 40 60 80 100
True positive rate (%)
False positive rate (%) SOM (Full) HMM (Full) FSA (Full)
positive rate by orders of magnitude.
Figure 4.7: Per-sequence false positive rate comparison for 80 apps that include native code. Detection was performed without consideration of arguments.
Figure 4.9: Per-sequence false positive rate comparison for 60 apps that do not include any native code. Detection was performed without consideration of arguments.
Figure 4.10: Per-sequence false positive rate comparison for 60 apps that do not include any native code. Detection was performed with consideration of arguments.
We also evaluate the possible impact that cross validation can bring to our system.
ma-chine learning algorithms that require a random number to initiate the system. In this
experiment, we use a three-fold cross validation with four di↵erent random numbers. A
three-fold cross validation divides the training data into three pieces to perform three
rounds of tests. In each round, we pick two pieces for training and one piece for the
validation test. We repeat the process until all three pieces have been selected as the
tested piece. After three rounds of tests, we can have a best result out of three results
generated from the three rounds of tests. We than use the random number to evaluate
the performance of SOM.
As we can see in Figure 4.11 and Figure 4.12, cross validation does not a↵ect our
per-app result very much. This is because once the SOM has been well trained with the
sufficient data, the map should be able to represent all behaviors of the application, and
therefore, it does not a↵ect the result too much. Figure 4.13 and Figure 4.14 show the
deeper results of SOM: per-sequence results. These two figures show higher di↵erence
between with and without cross validation for per-sequence results. This is because we
have achieved very small false positive rates, any small fluctuation can vary the result
big change to the average shown in Figure 4.13 and Figure 4.14. Table 4.2 shows the
overhead of using cross validation. Cross validation increase training time 26-28 times.
Given that cross validation only improves marginally but brings huge overhead, most of
the experiments performed in this thesis do not enable the function of cross validation.
Malware containment results: We now evaluate the malware containment e↵ ective-ness of PREC. We trigger each malicious app on the smartphone and run the PREC
system on the phone to see whether it can stop the root exploit attack. Table 4.3
sum-marizes our malware containment results. As mentioned in Section 3.3, PREC provides
0 20 40 60 80 100
0 5 10 15 20 25 30
True positive rate (%)
False positive rate (%) PREC PREC with cross validation SOM (full) SOM with cross validation (full)
Figure 4.11: Per-app malware detection accuracy comparison (with or without cross-validation) results for 80 apps with native code. Detection was performed without con-sideration of arguments.
0 20 40 60 80 100
0 5 10 15 20 25 30
True positive rate (%)
False positive rate (%) PREC PREC with cross validation SOM (full) SOM with cross validation (full)
0 0.0005 0.001 0.0015 0.002 0.0025 0.003 PREC PREC with cross validation SOM
(full) with crossSOM validation
(full)
False positive rate (%)
Figure 4.13: Per-sequence false positive rate comparison (with or without cross-validation) for 80 apps that include native code. Detection was performed without con-sideration of arguments. (CV: cross validation)
0 0.0005 0.001 0.0015 0.002 0.0025 PREC PREC with cross validation SOM (full) SOM with cross validation (full)
False positive rate (%)
Table 4.2: Anomaly detection model training time comparison. The experiment was conducted on a CentOS 6.2 Linux server with a 2.5GHz Intel XEON X3440 qual-core processor (Hyper-Threading disabled) and 8GB of physical memory. The average per-app system call sequence number is 244K under all system call monitoring and 106K under native thread system call monitoring.
Scheme per-app training time per-app training time without cross validation with cross validation
PREC 158.2 ±259.9s 4232.6 ±7918.7s SOM (full) 343.2 ±291.1s 9827.3± 10648.9s
Table 4.3: Malware detection and containment results.
Alarm Termination-
Delay-Malware lead based based
Samples time containment containment
DroidDream 20.7 sec success success DroidKungFu1 16.1 sec success success DroidKungFu2 96.5 sec success success GingerMaster 318.3 sec success success RATC-1 26.6 sec success success RATC-2 17.1 sec success success ZimperLich-1 14.1 sec success success ZimperLich-2 20.9 sec success success GingerBreak-1 35 sec success success GingerBreak-2 34.6 sec success success
root exploit attack by killing the malicious native threads and 2) delay-based contain-ment that stops the root exploit attack by inserting exponentially increasing delays in anomalous system calls. The results show that our anomaly detection can successfully
detect and stop all the root exploit attacks before they succeed. We measure the alarm
lead time as the time elapsed between the root exploit is detected and the root exploit
is successful if no containment scheme is taken. For the repackaged malicious
applica-tions (RATC-1, RATC-2, ZimperLich-1, ZimperLich-2, GingerBreak-1, GingerBreak-2),
we can terminate the malicious native threads only and continue to run the AngryBirds
We further analyze which system call sequences first cause our anomaly detector to
raise alarms. For the GingerBreak and both repackaged RATC malware samples, PREC
detects the abnormal sequence [execve, execve, execve, execve, close, getpid,
sigaction, sigaction, sigaction]. This is consistent with the behaviors of those root
exploits which first copy exploit files to a given directory and execute chmod executable
to change permission to0755for later execution. Because di↵erent devices placechmodin
di↵erent directories, the root exploit needs to try several locations to find the right
direc-tory. For DroidDream, the detected anomalous sequence is [execve, execve, execve,
execve, close, execve, read, close, mprotect]. In this case, DroidDream first
ex-ecute theexplode exploit to try to compromise the system. The first detected alarm for
DroidKungFu1 is [writev, gettid, writev, writev, writev, pipe, getrlimit,
close, ustat]. This sequence contains several system calls that used by the RATC
attack.Pipeis used for the communication between attack parent process and child
pro-cesses. The system call getrlimit is used to understand the limitation on the number
of processes for the current user. DroidKungFu2 is detected with the sequence[execve,
close, getpid, sigaction, sigaction, sigaction, sigaction, sigaction,
sigaction]. The malware uses theexecvesystem call to execute the built-in root exploit
secbino. Both ZimperLich-1 and ZimperLich-2 are caught by PREC with the sequence
[sigaction, sigaction, sigaction, sigaction, getuid, geteuid, getgid,
getegid, stat]. The system calls from the 5’th position to the 9’th position are exactly
the first five system calls used in the ZimperLich source code. Those sequence analysis
results show that PREC accurately catches the malicious behaviors of those malware
samples.
Table 4.4: Delay-based containment impact to benign apps with false alarms. Each application run lasts three minutes.
Fine-grained Whole app Application containment containment
Forthblue.pool Hang Hang TalkingTom2Free 0.1 sec Hang CamScanner 0.25 sec Hang
using di↵erent containment schemes. As shown in Figure 4.3, Figure 4.4, Figure 4.5, and
4.6, PREC only raises false alarms in 3 (out of 140 tested) benign apps (Forthblue.pool,
TalkingTom2Free, CamScanner). We first tried the termination-based containment over those three benign applications. We found that those applications crashed even if we
only killed the malicious native threads. We then tested our delay-based containment schemeover these three apps. If we only insert delays in malicious native threads, we ob-served that our containment scheme incurs negligible impact (0.1-0.25 second total delay
during 3 minutes run) to the two benign applications, TalkingTom2Free and
CamScan-ner. Forthblue.pool hangs after the delay-based containment is triggered. To summarize,
PREC only incurs significant false alarm impact to 1 out of 140 benign popular apps
tested in our experiments.
PREC overhead results:We first evaluate our anomaly detection overhead. Table 4.5 shows the per-app model training time and per-sequence anomaly detection time
com-parison among di↵erent algorithms. We can see both SOM and FSA algorithms are
light-weight. However, FSA tends to raise a large number of false alarms, which makes
it impractical for runtime malware detection. HMM is sensitive to the number of states
configured in the model. As we increase the number of states to its maximum value (i.e.,
the number of distinctive system calls used in the training trace), the overhead of HMM
Table 4.5: Anomaly detection model training and runtime detection time comparison. For HMM, “S =i” means the number of states is configured to be i in HMM. “S =max” means the number of states equal to the number of distinctive system calls in the trace. The experiment was conducted on a Ubuntu 12.04LTS Linux desktop with a 3.4GHz Intel Core i7-2600 qual-core processor (HyperThreading disabled) and 8GB of physical memory. The average per-app system call sequence number is 244K under all system call monitoring and 106K under native thread system call monitoring.
Per-app Per-sequence Scheme training time detection time
PREC 39.7± 59.3s 0.07 ±0.03ms SOM (full) 131.3±88.6s 0.12 ±0.00001ms HMM (S= 10, native) 11.8 ±15.9s 1.1 ±2.7ms
HMM (S= 10, full) 32.3±22s 0.2 ±0.3ms HMM (S= 20, native) 72.5±107.7s 8.8 ±20.4ms
HMM (S= 20, full) 140.8±121.8s 1.8 ±2.7ms HMM (S = max, native) 1040± 2123s 7.7±13ms
HMM (S = max, full) 2449±1834.2s 105.9 ±143.2ms FSA (native) 0.6±1s 0.05 ±0.26ms
FSA (full) 1.1±0.7s 0.01 ±0ms
increase the number of states, the best case of HMM is still much worse than SOM, as
shown in our detection accuracy results. To quantify the runtime overhead of PREC, we
run PREC on a Galaxy Nexus phone with Andriod 4.2 using Antutu benchmarks [1].
Figure 4.15 shows the benchmark performance results. We observe that our classified
monitoring scheme imposes less than 1% overhead and the SOM anomaly detection
algo-rithm imposes up to 2% overhead. Overall, PREC is light-weight, which makes it practical
0 0.2 0.4 0.6 0.8 1
Antutu-CPUAntutu-MemAntutu-Graphics Antutu-IO
Normalized Benchmark Scores
Without PREC With syscall classification With syscall classification + SOM anomaly detection
Chapter 5
Related Work
Forrest et al. [25] first proposed the system call malware detection schemes by building
a database of normal system call sequences. Warrender et al. [54] extended this idea by using hidden Markov models (HMMs) to model sequences of normal system calls. Other
researchers [16, 35, 22] adapt artificial neural network to perform intrusion detection.
Kruegel et al. [38] proposed to use system call arguments to improve the performance of
host-based intrusion detection. Maggi et al. [41] proposed to cluster similar system calls
or similar system call arguments to further improve the accuracy. Previous work [30, 39]
also used SOM for network intrusion detection by clustering system call arguments such
as user name, connection type, and connection time. Gao et al. [27, 26] perform real-time
anomaly detection based on di↵erences between execution graphs and the replica graphs
constructed using system call traces and runtime information (e.g., return addresses).
Traditional system call based intrusion detection approaches have to collect all system calls made by the target process, as there is no clear boundary to reduce the
collec-tion scope. This increases both noise and design complexity of intrusion deteccollec-tion. In
![Figure 3.2:SOM update example using the input vector [1,2,4].](https://thumb-us.123doks.com/thumbv2/123dok_us/1647213.1206132/26.612.168.464.71.273/figure-som-update-example-using-the-input-vector.webp)