Predicting Reservoir Evaporation Using
Artificial Neural Network
Kharat Pallavi 1, Shetkar Rajeev 2
Research Scholar, Department of Civil Engineering, Government Engineering College, Aurangabad, Maharashtra,
India1
Associate Professor, Department of Civil Engineering, Government Engineering College, Aurangabad, Maharashtra,
India2
ABSTRACT: The hydrological cycle comprises of various complex processes involved in it and every process is important in planning and management of water resources projects. The prediction of various parameters of the hydrological processes is very difficult due to the stochastic nature. Estimating evaporation from surface water usually requires data that are not easily measurable or available it has a nonlinear relationship with meteorological parameter. Evaporation is a complex process and is influenced by several metrological parameters. The purpose of this study is to develop an Artificial Neural Network model for evaluating the evaporation with available scarce data of NathSagar Reservoir located in Marathwada Region of Maharashtra. The feed forward back propagation network with one hidden layer has been utilised to construct the model. Different networks with different number of neurons were evaluated. Correlation coefficient (R2) and Root mean square error (RMSE) were employed to evaluate the accuracy of the proposed model. The study shows the best model for evaporation estimation is ANN-2 (4-9-1) with a correlation coefficient (R2) of 0.974 and the root mean square value (RMSE) of 1.276. It is also observed that ANN-4 (2-10-1) provides acceptable results with (R2) of 0.972 and (RMSE) of 1.281 for this NathSagar Reservoir of Maharashtra.
KEYWORDS: Artificial Neural Network, Daily evaporation, estimation, NathSagar Reservoir.
I. INTRODUCTION
Evaporation is the process whereby liquid water moves from an evaporating surface to the atmosphere as water vapour. Evaporating surfaces include open bodies of water (e.g. lakes, reservoirs, ponds and streams), saturated soil surfaces and water intercepted on vegetation. Evaporation estimation is a necessary component in water resources planning, design, and operation and management studies. Among the various components of the hydrological cycle, evaporation is the most difficult one to estimate owing to the complexity involved in it. Every Year a sizable amount of water is lost from open bodies in the form of evaporation hence its estimation is important. Pan evaporation method has been widely used because of its simplicity, but the number of measuring stations is limited compared with stations available for measurement of other hydrological parameters. Therefore, it is necessary to develop some alternative method to estimate the evaporation rates using meteorology data, which are either easily available or easier for measurements. The rate of evaporation depends on factors such as solar radiation, air temperature, relative humidity, wind speed, atmospheric pressure, nature of evaporating surface and water quality.
studies evaporation is estimated using simple equations involving solar radiation and maximum air temperature data and they are recorded at the lake weather station site or at headquarters (Wossenu Abtew, 2001).
Various studies have been conducted to determine the dominating factors and its effect on evaporation. The solar radiation and the mechanism of transporting the vapour from the water surface has a great effect (Chow et al., 1988) on evaporation. Singh (1992) observed that vapour pressure deficit, temperature, barometric pressure, humidity and wind speed as the controlling factors while, Gupta (1992) pointed out that relative humidity, wind velocity, and temperature of water and atmosphere are the climatic factors controlling evaporation. Sensitivity analysis shows that the estimated evaporation is most sensitive to changes in water temperature (Knapp H.et al., 1984). In general the factors controlling the phenomenon are site specific and also the studies used different data sets as per the availability hence the results are not globally acceptable.
Recently, encouraging results using neural networks models in the field of evaporation have been obtained (Bruton et al. 2000; Sudheer et al. 2002; Terzi and Keskin2005; Keskin and Terzi2006; Kisi 2006; Tan et al. 2007; Kisi 2009; Tabariet al. 2009; Shirsath and Singh 2010; Guven and Kisi 2011; Shiri et al. 2011; Shiri and Kisi 2011; Kim et al. 2012). Results from a study in China using neural network model show that the correlation coefficient between the evapo-transpiration calculated by FAO56 method and predicted with a hidden layer of ten nodes is 0.993 with error 1.67%. Moreover, the use of weather factors wind speed, average temperature, dew point and maximum temperature as input variables, and a hidden layer of three nodes in the back propagation can predict evapotranspiration with R = 0.98, and error 1.35% (Sheng Feng Kuo et.al, 2011). Linear genetic programming is also used and found suitable for daily pan evaporation modelling using available climatic data. The daily climatic data, air temperature, solar radiation, wind speed, pressure and humidity were used as inputs (Aytac Guven and Ozgur Kisi (2011)
The application of ANN models in evaporation estimation is now being widely used (Sungwon Kim, et. al (2013).An artificial neural network is inspired by the structure of the brain which suits best for complicated tasks (Haykin s. 1994). Most of the studies use locally trained ANN models in evaporation estimation which are in better agreement with the results obtained by other methods (Keskin, M. and Terzi, O. (2006). These locally developed models have limitation of global validity. However, some studies attempted to develop ANN models with global validity. This could be achieved either by developing ANN model to map Evaporation process both in space and time or by incorporating data from several locations to train the ANN.( Kumar et.al, 2011).For the semi arid region of Iran five models with various combinations of daily meteorological variables, relative humidity, air temperature, solar radiation, wind speed and precipitation were developed to evaluate degree of effect of each of these variables on evaporation. The comparison of models estimates showed that model with sigmoid activation function with all input parameters performed best in prediction of daily evaporation (Hossein Tabari et.al.2010).
Increasing temperature is able to enhance evaporation as generally expected. However, the contribution of temperature rising to evaporation was offset, by the impact of the wind speed, according to its significant decrement and high sensitivity with evaporation. Therefore, evaporation has declined while climate warming has increased in China (Yunhe Yin et.al, 2010). Studies are also undertaken for evaporation reduction, it is observed that shades suspended above a water surface and covers floating on a water surface provide the highest evaporation reduction efficiency. Of these two, floating covers were considered as most practical and economical, because of their greater durability and elimination of the need for an expensive supporting structure (Keith R. Cooley, 1983)
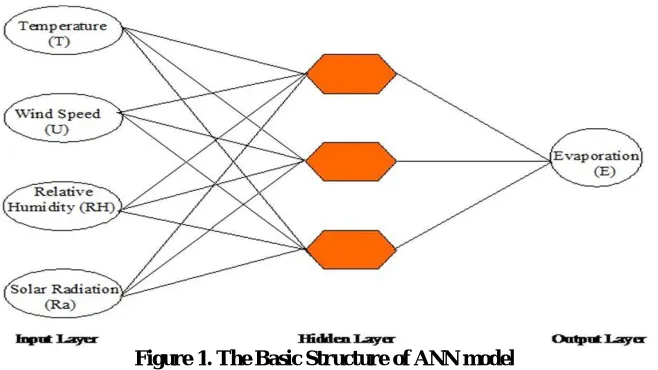
Artificial Neural Network (ANN)
Figure 1. The Basic Structure of ANN model
There are a wide variety of algorithms available for training a network and adjusting its weights. In this study, an adaptive technique momentum Levenberg–Marquardt based on the generalized delta rule was adopted.
Let xi (i = 1,2, ... n) are inputs and wi (i = 1,2, … n) are respective weights. The net input to the node can be expressed as
=
The net input is then passed through an activation function ƒ (.) and the output y of the node is computed as
= ( )
Sigmoid function is the most commonly used nonlinear activation function which is given by
= ( ) = 1
1 +
In this study, a type of feed forward back propagation network multilayer back propagation is explored, as it is the most popular type used in hydrology (Dawson and Wilby,1998).
II. RELATEDWORK
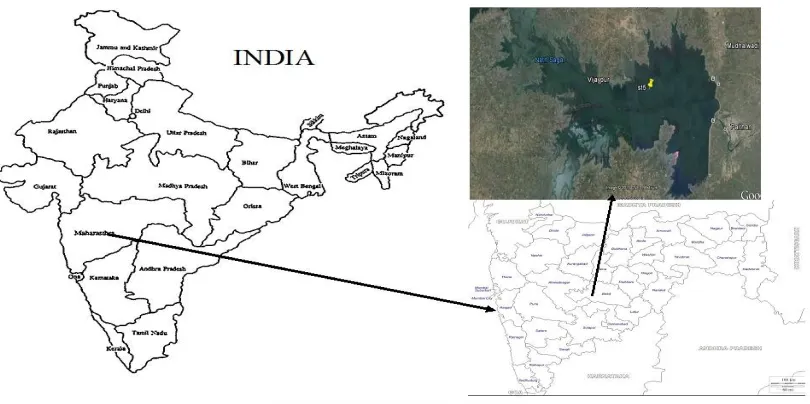
Study Area
Data Acquisition
The metrological data of the Nath Sagar reservoir is acquired from the Indian Metrological Department, Pune. The metrological data includes maximum and minimum air temperature, relative humidity, wind speed, sunshine hours and evaporation. Table 1. shows the meteorological data and their descriptive statistics for the reservoir under study.
Table 1. Descriptive statistics of the Nath Sagar Reservoir
Sr
no. Variables* Units
Minimum Observed
Maximum
Observed Mean
Standard Deviation
1 Maximum Air
Temperature °C 19.20 43.30 32.67 4.17
2 Minimum Air
Temperature °C 5.40 30.80 18.88 4.94
3 Wind Speed Km/hr 1.00 23.50 6.94 4.13
4 Sunshine Hours Hours 0.19 11.80 7.55 2.73
5 Relative Humidity % 13.50 98.50 56.36 19.33
6 Evaporation mm/day 0.20 20.40 4.18 2.13
The study area has mean temperature about 32.67°C, mean wind speed about 6.94Km/hr, mean relative humidity of 56.36% and mean evaporation of 4.18mm/day. Daily records from 2000 to 2006 are used for studying reservoir evaporation.
III.MATERIALMETHOD
between evaporation and relative humidity (that is evaporation decreases with increase in relative humidity). It is important to take into account the combined influence of all the meteorological parameter on evaporation.
Table 2. Statistical analysis of the weather data Sr.
No.
Variables Units Minimum Maximum Correlation coefficient
with evaporation
1 Maximum Air Temperature °C 19.20 43.30 0.76
2 Minimum Air Temperature °C 5.40 30.80 0.37
3 Wind Speed Km/hr 1.00 23.50 0.27
4 Sunshine Hours Hours 0.19 11.80 0.43
5 Relative Humidity % 13.50 98.50 -0.50
6 Evaporation mm/day 0.20 20.40 1.00
The input combinations used to estimate evaporation for reservoir are maximum and minimum temperature (°C), Wind Speed (Km/hr), Sunshine hours (Hours), and Relative humidity (%). The daily metrological data recorded at Pategaon metrological station for a period from 2000 to 2006 is used (2557 data sets). Different structure of artificial neural network is used with different combination of data for estimation of daily evaporation. Four years data (1760 data sets) are used for training and two year data (767data set) data are used for testing ANN models.
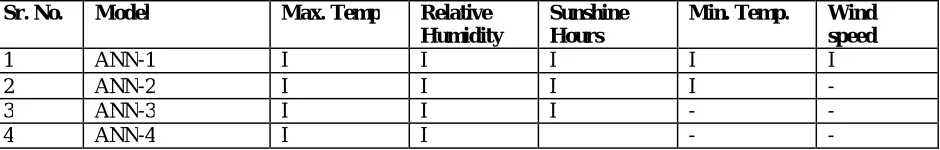
The input layer contains the input variables temperature, relative humidity, sunshine hours and wind speed. Four ANN models are proposed ANN1, ANN2, ANN3 and ANN4 having five, four, three and two input variables respectively. The selection of variables is done on the basis of correlation coefficient. The highest correlation value neglecting the sign enters first in the model (Table 3.) and the variable with the lowest correlation value leaves first. The hidden layer neurons were selected between 2 to 12. The output layer contains the evaporation.
Different ANN architecture is tried using these inputs and hidden layers to find an appropriate model structure for each input and hidden layer combination. The ANN models are then tested and the results are compared by means of correlation coefficient and root mean square error statistics.
Table 3. ANN Input Data Structure
Sr. No. Model Max. Temp Relative
Humidity
Sunshine Hours
Min. Temp. Wind
speed
1 ANN-1 I I I I I
2 ANN-2 I I I I -
3 ANN-3 I I I - -
4 ANN-4 I I - -
For best fit ANN model in present study multilayer perception with one hidden layer and with a sigmoid activation function is used as it provided better results for this data set. Other user-defined parameters used were momentum learning rate and step size = 0.1, momentum = 0.700, hidden layer nodes = 8 and iterations = 1000. These values were obtained after a number of trials by using different combination of these parameters carried out on data set.
IV.EXPERIMENTAL RESULTS
Table 4. Performance and Evolution of Models
Sr. No. Model (i/p-hidden-o/p) R2 RMSE
1 ANN-1 (5-8-1) 0.892707 1.581067
2 ANN-2 (4-9-1) 0.974774 1.276934
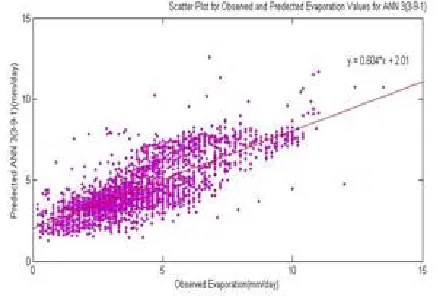
3 ANN-3 (3-9-1) 0.894942 1.539764
4 ANN-4 (2-10-1) 0.972538 1.281376
From the table the highest value of correlation coefficient and minimum root mean square error suggests the suitability of ANN-2 model. ANN-4 model has close results to ANN-2 model. The inputs and the hidden layers in the models are different. ANN-2 has a combination of temperature; relativity humidity and sun shine hours where as ANN-4 model has a combination of only maximum temperature and relativity humidity with nine and ten hidden neurons respectively.
Figure 3. Scatter Plot for Observed and Predicted Evaporation Values for ANN-1 (5-8-1)
Figure 4.Scatter Plot for Observed and Predicted Evaporation Values for ANN-2 (4-9-1)
Figures 3, 4, 5 and 6 show the comparison of the observed and the predicted values of the ANN models. The highest value of correlation coefficient and minimum value of root mean square error suggests the suitability of ANN-2 model for the reservoir.
V. CONCLUSION
Figure 5. Scatter Plot for Observed and Predicted Evaporation Values for ANN-3 (3-9-1)
The present study discusses the application and the usefulness of artificial neural network based model for estimation of daily evaporation over a region. The results are encouraging and suggest the usefulness of neural network based modelling technique in better prediction of evaporation. This study also concludes that a combination of maximum and minimum temperature, relative humidity and sunshine hours as input variable to the model perform better in predicting evaporation. In addition the combination of maximum temperature and relative humidity also gives good prediction of evaporation and can be used in the absence of other data.
REFERENCES
[1.] Aytac Guven and Ozgur Kisi, “Daily pan evaporation modeling using linear genetic programming technique.”, Irrig. Sci., vol. 29, pp.135–145, 2011. [2.] Bruton JM, McClendon RW, Hoogenboom G., “Estimating daily pan evaporation with artificial neural networks” ASAE vol. 43, no.2 pp.491–496,
2000.
[3.] Caudill M ., “Neural networks primer, part I”. AI Expert, December, pp. 46–52, 1987. [4.] Chow, V., D. Maidment and, L. Mays, “Applied Hydrology.” N.Y.: McGraw-Hill Pub., 1988. [5.] Gupta, B., “Engineering Hydrology.” Jain, India: N.C., 1992.
[6.] Guven A, Kisi O., “Daily pan evaporation modeling using linear genetic programming technique.” IrrigSci., vol.29, no.2, pp.135–145, 2011. [7.] Harbeck G., “A practical field technique for measuring reservoir evaporation utilizing mass-transfer theory.” U.S. Geol. Surv., vol.272, no.E,
pp.101-105, 1962.
[8.] Haykin S., “ Neural networks and learning machines, 3rd edn.” Prentice Hall, NJ., 2009. [9.] Hecht-Nielsen R., “ Neuro computing.” Addison-Wesley Publishing Company, Reading, 1990.
[10.] Hossein Tabari, Safar Marofi, Ali-Akbar Sabziparvar, “Estimation of daily pan evaporation using artificial neural network and multivariate non-linear regression.”, Irrig.Sci., vol. 28 pp.399–406, 2010.
[11.] HosseinTabari, Mark E. Grismer, SlavisaTrajkovic, “Comparative analysis of 31 reference evapotranspiration methods under humid conditions”, Irrig. Sci., vol. 31, pp.107–117, 2013.
[12.] Keith R. Cooley, “Evaporation Reduction: Summery of Long Term Tank studies.”, J. Irrig. Drain Eng., vol.109, no.1, pp. 89-98, 1983. [13.] Keskin ME, Terzi O., “Artificial neural networks models of daily pan evaporation.”, J Hydrol. Eng., vol.11, no.1, pp. 65–70, 2006. [14.] Keskin, M. and Terzi, Ö. "Artificial Neural Network Models of Daily Pan Evaporation." J. Hydrol. Eng., vol.11, no.1, pp. 65-70, 2006.
[15.] Kim S, Shiri J, Kisi O., “Pan evaporation modeling using neural computing approach for different climatic zones.” Water Resour. Manag., vol.26, no.11, pp. 3231–3249, 2012.
[16.] Kisi O ., “ Daily pan evaporation modelling using a neuro-fuzzy computing technique.” J. Hydrol., vol.329, pp. 636-646, 2006.
[17.] Kisi O ., “Daily pan evaporation modelling using multi-layer perceptrons and radial basis neural networks.” Hydrol. Proc., vol.23, pp.213-223, 2009. [18.] Knapp, H., Yu, Y., and Pogge, E. "Monthly Evaporation for Milford Lake in Kansas." J. Irrig. Drain Eng., vol.110, no.2, pp.138-148, 1984. [19.] Kohler MA, Nordenson T, Fox W ., “Evaporation from pans and lakes.” U.S. Dept. Commerce, Weather. Bureau. Res. pp. 38.1955.
[20.] Kumar M, Raghuvanshi N.S., Singh R., “Artificial neural networks approach in evapotranspiration modeling: a review”, IrrigSci., vol.29, pp.11–25, 2011.
[21.] Mcculloch W. S. and Pitts W., “A Logical Calculus of the Ideas Immanent in Nervous Activity.” Bulletin of Mathematical Biophysics, vol. 5, pp.115-133, 1943.
[22.] Penman H., “Natural evaporation from open water, bare soil and grass.”, Proc. Roy. Soc. London Vol.193, pp.120-146, 1948.
[23.] Sheng-Feng Kuo, Feng-Wen Chen,Pei-Yu Liao, Chen-Wuing Liu, “A comparative study on the estimation of evapotranspiration using backpropagation neural network: Penman–Monteithmethod versus pan evaporation method”, Paddy Water Environ., vol. 9, pp.413–424,2011. [24.] Shiri J, DierickxW, Pour-Ali Baba A, Neamati S, Ghorbani M A., “Estimating daily pan evaporation from climatic data of the state of Illinois, USA
using adaptive neuro-fuzzy inference system (ANFIS) and artificial neural network (ANN).” Hydrol Res., vol.42, no.6, pp.491–502, 2011.
[25.] Shiri J, Kisi O, “Application of artificial intelligence to estimate daily pan evaporation using available and estimated climatic data in the Khozestan Province (Southwestern Iran).” J Irrig Drain Eng., vol.137,no.7, pp.412– 425, 2011.
[26.] Shirsath P, Singh A., “A comparative study of daily pan evaporation estimation using ANN, regression and climate based models.” Water Resour. Manag., vol.24 pp.1571-1581, 2010.
[27.] Singh, V., “Elementary Hydrology.” NJ, U.S.A.: Prentice Hall Inc., 1992.
[28.] Sudheer KP, Gosain AK, Rangan DM, Saheb SM ., “Modelling evaporation using an artificial neural network algorithm.” J. Hydrol. Proc., vol.16, pp.3189-3202, 2002.
[29.] Sungwon Kim & Jalal Shiri&Ozgur Kisi & Vijay P. Singh “Estimating Daily Pan Evaporation Using DifferentData-Driven Methods and Lag-Time Patterns”, Water Resour Manage, vol.27, pp.2267–2286, 2013.
[30.] Tabari et al., “Estimation of daily pan evaporation using artificial neural Network and multivariate non-linear regression”. IrrigSci., vol.28, no.5, pp.399–406, 2010.
[31.] Terzi O, Keskin ME , “ Evaporation estimation using gene expression programming.” J ApplSci vol.5, no.3, pp.508– 512, 2005.
[32.] Wossenu Abtew, “Evaporation Estimation for Lake Okeechobee in South Florida” Journal of Irrigation and Drainage Engineering, vol. 127, no.3, pp. 0140–0147, 2001.