DOI: 10.1534/genetics.105.052225
Fine-Scale Map of Encyclopedia of DNA Elements Regions in the
Korean Population
Yeon-Kyeong Yoo,*
,1Xiayi Ke,
†,1Sungwoo Hong,
‡Hye-Yoon Jang,* Kyunghee Park,
‡Sook Kim,*
TaeJin Ahn,
‡Yeun-Du Lee,* Okryeol Song,
‡Na-Young Rho,* Moon Sue Lee,
‡Yeon-Su Lee,
‡Jaeheup Kim,
‡Young J. Kim,
§Jun-Mo Yang,** Kyuyoung Song,
††Kyuchan Kimm,
‡‡Bruce Weir,
§§Lon R. Cardon,
†Jong-Eun Lee* and Jung-Joo Hwang
‡,***
,2*DNA Link, Seoul, 120-110, Korea,‡Bio Lab,***Future Technology Group, Samsung Advanced Institute of Technology, Yongin-si, Gyeonggi-do 449-901, Korea,†Wellcome Trust Center for Human Genetics, University of Oxford, Oxford OX3 7BN,
United Kingdom,§National Genome Information Center, Korea Research Institute of Bioscience and Biotechnology, Daejeon-si, 305-333, Korea,**Department of Dermatology, Samsung Medical Center, Sungkyunkwan University
School of Medicine, Seoul, 135-230, Korea,††Department of Biochemistry and Molecular Biology, University of Ulsan College of Medicine, Seoul, 138-736, Korea,‡‡National Genome Research Institute, Korean
National Institute of Health, Seoul 122-701, Korea and§§Department of Biostatistics, University of Washington, Seattle, Washington 98195-7232
Manuscript received October 13, 2005 Accepted for publication May 13, 2006
ABSTRACT
The International HapMap Project aims to generate detailed human genome variation maps by densely genotyping single-nucleotide polymorphisms (SNPs) in CEPH, Chinese, Japanese, and Yoruba samples. This will undoubtedly become an important facility for genetic studies of diseases and complex traits in the four populations. To address how the genetic information contained in such variation maps is transferable to other populations, the Korean government, industries, and academics have launched the Korean HapMap project to genotype high-density Encyclopedia of DNA Elements (ENCODE) regions in 90 Korean individuals. Here we show that the LD pattern, block structure, haplotype diversity, and recombination rate are highly concordant between Korean and the two HapMap Asian samples, particularly Japanese. The availability of information from both Chinese and Japanese samples helps to predict more accurately the possible performance of HapMap markers in Korean disease-gene studies. Tagging SNPs selected from the two HapMap Asian maps, especially the Japanese map, were shown to be very effective for Korean sam-ples. These results demonstrate that the HapMap variation maps are robust in related populations and will serve as an important resource for the studies of the Korean population in particular.
T
HE International HapMap Project is an interna-tional effort to document the common DNA se-quence variations in the human genome to facilitate genetic studies of common diseases and complex traits(Gibbs et al. 2003) and apply them to other
popula-tions. The phase I mapping of this project, which geno-types samples from the Yoruba in Ibadan, Nigeria (YRI); the Japanese in Tokyo ( JPT); the Han Chinese in Beijing (CHB); and Utah residents with ancestry from northern and western Europe (CEU) at a density of 1 single-nucleotide polymorphism (SNP) every 5 kb, has been completed (International Hapmap Consor-tium 2005). The HapMap has been widely regarded as an important resource for disease association and population studies (Dudbridge and Koeleman2004;
Evans et al. 2004; Thomaset al.2004; Morton 2005;
Pittman et al. 2005). Doubts and controversy,
how-ever, have also surrounded the project from the outset (Terwilligeret al. 2002; Nielsen et al.2004). One of
the most critical questions is how robust such dense common variation maps produced for the four popula-tions are to other populapopula-tions.
Linkage disequilibrium (LD) patterns are known to vary across the human genome and across populations (Gabriel et al. 2002; Phillips et al. 2003; Ke et al.
2004a). Two important questions arise from these ob-servations, i.e., how LD patterns are maintained be-tween a HapMap population and a population that the HapMap is applied to and how strong is a population to which the HapMap is applied. These two questions are related and can often be assessed by choosing tagging SNPs ( Johnson et al. 2001; Gibbs et al. 2003; Stram
2004) in one population sample and applying them to another population (Ke et al. 2004b; Ahmadi et al.
2005; Mueller et al. 2005). In a recent study
involv-ing four gene regions in several European populations
1These authors contributed equally to this work.
2Corresponding author:Bio Lab, Future Technology Group, Samsung
Advanced Institute of Technology, Mt. 14, Nongseo-ri, Giheung-eup, Yongin-si, Gyeonggi-do, 449-901, Korea.
E-mail: [email protected]
(Muelleret al.2005), tagging SNPs selected from the
HapMap CEU data were found to perform very effi-ciently in local European samples in two of the four re-gions because of high conservation of LD. In the other two regions, however, restricted applicability of CEU-derived tagging SNPs was observed due to significant variation in LD among populations (Mueller et al.
2005).
For Asian populations, there are two HapMaps avail-able, CHB and JPT. We are interested in the cross-population robustness of the HapMap in general and the applicability of JPT and CHB maps to the Korean population, in particular. We are also interested in poten-tial advantages of having two related Asian HapMaps. To this end, the Korean government, industries, and aca-demic institutions launched the Korean HapMap proj-ect in 2003, which involved the fine mapping of 7 of the 10 HapMapEncyclopediaofDNAElements (ENCODE) regions.
MATERIALS AND METHODS
DNA samples and SNP selection:The samples used for the study comprised 90 Korean samples randomly selected from the cohort samples preserved in the Korean National Institute of Health without family history of major diseases. SNP sites were selected from dbSNP database build 119 (http://www. ncbi.nlm.nih.gov/SNP) after applying repeat masking.
Genotyping: Multiplex SNP analyses were performed for ENr213, ENr232, and ENr321 with the GenomeLab SNPstream genotyping platform (Beckman Coulter) and its accompanying SNPstream software suite as described by Denommeand Van
Oene(2005). For ENr131 as well as for ENr112, ENr113, and
ENm013, Sequenom’s MassARRAY system was used with stan-dard conditions as described before (Bansalet al.2002) except
the amount of genomic DNA (2.5 ng) was decreased with multi-plexing assays. All genotypes were confirmed by an operator for final genotype calls.
The average genotyping error rate was estimated at0.1% by routinely running duplicated sample wells in the plate. The genotyping results in the study are available for download from http://www.ngic.re.kr:8080/khapmap/.
LD analysis: All analyses in this study were based on the HapMap ENCODE genotype downloaded at February 2005, unless otherwise stated. Only markers that were polymorphic in
the Chinese, Japanese (http://www.hapmap.org/), and Korean samples were used (‘‘shared data sets’’ thereafter). This selec-tion of markers, therefore, allowed direct comparison of LD structure between population samples and all other analyses except tagging. For the sliding-window analysis, average pair-wiser2was calculated from 10- to 50-kb interspaced SNPs in
50-kb sliding windows (5-kb increment between windows). Haplotype blocks were defined using Haploview (Barrett
et al.2005) based on block definition of Gabrielet al.(2002).
Haplotypes and their frequencies in block regions were esti-mated using snphap (http://www-gene.cimr.cam.uk/clayton/ software/).
Fst analysis: Fst was calculated according to the Wright’s F-statistic (Wright1951). BecauseFstestimates for SNPs in LD
are correlated (Weiret al.2005), here we selected SNPs with
pairwiser2all,0.20 from the CHB1JPT combined set. Recombination analysis:Phase 2.1 (Liand Stephens2003;
Crawfordet al.2004) was used to analyze the shared data sets
as described above.
Tagging analysis: Tagging SNPs were selected from the full-density CHB and JPT maps (as well as the combined CHB1JPT map) using Tagger (deBakkeret al.2005; http://
www.broad.mit.edu/mpg/tagger/) in aggressive tagging mode (r2or haplotyper2$0.80, minor allele frequency cutoff¼5%,
and other settings at default value). Tagging efficiency was de-fined asn/nh, wherenhis the number of tagging SNPs selected
to cover the region andnis the total number of markers geno-typed (Keet al.2004b). The performance of those tagging SNPs
was evaluated again using Tagger with the same settings by ap-plying tags to the 90 Korean (KR) samples. A marker is ‘‘cap-tured’’ if the pairwiser2or haplotyper2with the tags is$0.80.
RESULTS
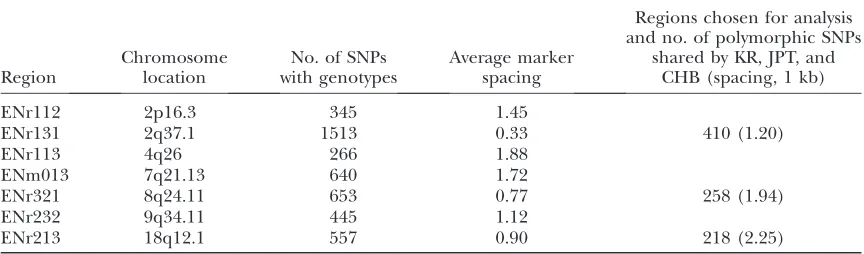
SNP genotyping: The Korean HapMap project
un-dertook fine mapping of 7 of the 10 HapMap ENCODE regions using DNA samples from 90 individuals from South Korea (Table 1, supplemental Figure 1 at http:// www.genetics.org/supplemental/). Marker density var-ied from different levels of an average 1 SNP/1.88 kb in ENr113 to having the lowest 1 SNP/330 bp in ENr131 (Table 1).
ENr131, ENr213, and ENr321 were the three most densely genotyped regions and were used to investigate the applicability of Japanese and Chinese HapMap to the Korean population (Table 1). As described in detail in the following sections, ENr131 had a low level of LD TABLE 1
Summary of genotyping data
Region
Chromosome location
No. of SNPs with genotypes
Average marker spacing
Regions chosen for analysis and no. of polymorphic SNPs
shared by KR, JPT, and CHB (spacing, 1 kb)
ENr112 2p16.3 345 1.45
ENr131 2q37.1 1513 0.33 410 (1.20)
ENr113 4q26 266 1.88
ENm013 7q21.13 640 1.72
ENr321 8q24.11 653 0.77 258 (1.94)
ENr232 9q34.11 445 1.12
and ENr213 had a high level of LD, whereas ENr321 had an intermediate level of LD. Findings from these three dense maps, we hope, would shed light on studies of genomewide scale. To match the sample sizes of JPT and CHB samples in the International HapMap Project, 45 KR individuals were randomly selected from the 90
Koreans and used for comparisons of the three popula-tions, unless stated otherwise.
Population difference and LD conservation: The
three ENCODE regions had a different level of average LD at a broad scale, with ENr131 being the lowest and ENr213 the highest (Figure 1a). LD patterns in all
Figure1.—Comparison of Korean, Japanese, and Chinese in patterns of LD, haplotype block structure, and recombination rate
three regions were similar among Korean, Japanese, and Chinese in general although some differences were apparent in ENr213 and ENr321. Average Fst-values between Korean and Japanese and between Korean and Chinese were 0.0060, 0.0044, and 0.0062 and 0.0064, 0.0075, and 0.0095 for ENr131, ENr213, and ENr321, respectively. This observation indicates that the Korean population is very close to Japanese and Chinese pop-ulations in general and, perhaps, closer to Japanese than to Chinese. This observation was reflected in the sliding-window analysis showing more departures of Korean samples from Chinese samples in ENr213 and ENr321 than ENr131 (Figure 1a). The close relatedness of the haplotypes of the Korean, Japanese, and Chinese populations was further confirmed by phylogenetic anal-ysis (supplemental Figure 2 at http://www.genetics.org/ supplemental/) (Akeyet al.2002).
The haplotype block structures of the three regions were generally concordant among Korean, Japanese, and Chinese. Block structure had the highest concor-dance in ENr131 (Figure 1, b–d) although the average LD in this region was lower than in the other two (Figure 1a). This was consistent with the mean LD trends, where the lines representing three different samples within the Korean population as well as three Asian popula-tions overlapped tightly. Differences were observed, however, in ENr213 and ENr321, which were consistent with the departures observed in the broad scale of LD patterns (Figure 1, Table 2).
Comparison of the major haplotypes in haplotype blocks of the ENr131, ENr213, and ENr321 regions between KR and JPT/CHB showed that close to 90% of their haplotypes in block regions defined in JPT and CHB were major haplotypes, and this number was still .85% when haplotypes were reconstructed for the same regions using the Korean samples (Table 3). Fur-thermore, the majority of the major haplotypes as de-fined in JPT and CHB remained major haplotypes in KR, demonstrating a high degree of haplotype conservation across the three populations (Table 3). In ENr321, where a higher concordance of block structure was ob-served between KR and CHB than between KR and JPT (Figure 1, b–d, Table 2), the major haplotypes were found, however, to be more conserved between KR and JPT (0.749) than between KR and CHB (0.662). This in-dicates that the Koreans and Japanese are perhaps more closely related in this particular region.
Different patterns and behaviors were still observed between populations when the combined CHB 1 JPT data sets were compared with the complete whole Korean sample of sets containing 90 individuals (Table 2). In ENr321, the sequence coverage of haplotype blocks was
69% for CHB 1 JPT combined samples and 57% for
Korean samples. This difference was primarily due to the difference between the Japanese and Korean sam-ples (Table 2). It was also revealed that major haplotype conservation between CHB1JPT and KR was in general between what was obtained by comparing CHB and JPT separately with KR, except for ENr213 where higher con-servation was achieved in CHB1JPT samples (Table 3).
Recombination rate: The pattern of estimated
re-combination rate in ENr131 was very simple compared to the other two regions and remarkably similar between KR, JPT, and CHB (Figure 1e). In contrast, recombina-tion rates of ENr213 and ENr321 regions were more varied across regions as well as among populations (Figure 1e). This was consistent with the broad view of LD and the primary reason for the highest similarity of block structure in ENr131 and less concordance among the three populations in the ENr213 and ENr321 re-gions although they had a higher average LD (Figure 1). In ENr213, the amplitude of recombination rate varia-tions was smaller than in ENr131 and ENr321, in agree-ment with the fact that this region had the highest LD (Figure 1).
Transferability of tagging SNPs: We selected
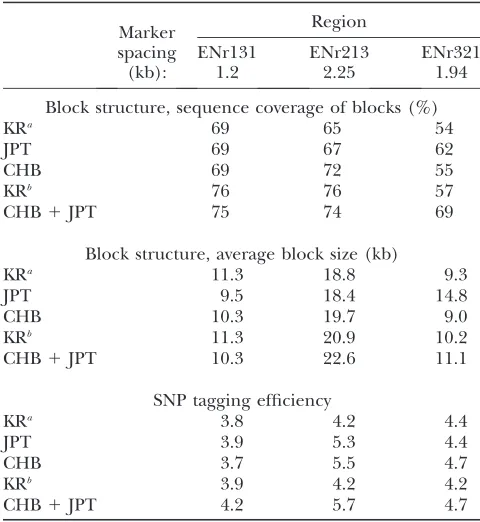
tag-ging SNPs from CHB, JPT, or CHB1JPT samples and applied them to the Korean population. At the same marker densities, tagging efficiency was very similar among the three populations in ENr131 and ENr321 with some difference in ENr213 (Table 2). When tag-ging SNPs were selected from full-density sets of CHB, JPT, and CHB 1JPT, higher tagging efficiencies were obtained as expected (4.5, 5.8, and 5.2 in ENr131; 7.0, 7.0, and 7.7 in ENr213; 5.8, 5.9, and 6.1 in ENr321). In all three regions, at least 80% of SNPs in the Korean TABLE 2
Comparison of block structure and SNP tagging efficiency
Marker spacing (kb):
Region
ENr131 ENr213 ENr321
1.2 2.25 1.94
Block structure, sequence coverage of blocks (%)
KRa 69 65 54
JPT 69 67 62
CHB 69 72 55
KRb 76 76 57
CHB1JPT 75 74 69
Block structure, average block size (kb)
KRa 11.3 18.8 9.3
JPT 9.5 18.4 14.8
CHB 10.3 19.7 9.0
KRb 11.3 20.9 10.2
CHB1JPT 10.3 22.6 11.1
SNP tagging efficiency
KRa 3.8 4.2 4.4
JPT 3.9 5.3 4.4
CHB 3.7 5.5 4.7
KRb 3.9 4.2 4.2
CHB1JPT 4.2 5.7 4.7
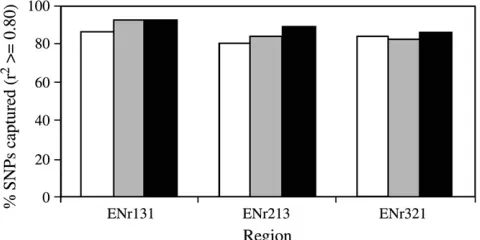
samples can be captured by tagging SNPs selected from the CHB, JPT, and CHB1JPT HapMap samples (Figure 2). In ENr131 and ENr213, tagging SNPs selected from JPT were better at capturing SNPs in the Korean samples and more effective than those selected from CHB. Some additional benefit was also observed when tagging SNPs were selected from CHB1JPT than those selected from JPT alone (e.g., ENr213 and ENr321). Since higher tagging efficiency was observed for JPT and CHB1JPT than for CHB, the advantage of using JPT (particularly in ENr131) or CHB1JPT as reference for the Korean
population was more apparent. The difference of JPT and CHB1JPTseems to correspond well to the local LD feature of a region. In ENr131, little variation of LD was observed between populations as well as within the Korean population (Figure 1a). As a result, JPT alone seems to be good enough to capture the variations in Korean samples. Whereas in ENr321 and especially in ENr213 more variations were observed between as well as within populations, and the combined CHB1JPT sets seems to perform better than JPT alone.
We have also examined some extreme cases of pop-ulation difference in SNP allele frequency, which could affect tagging performance. If a common SNP in a ref-erence population is monomorphic in the test popula-tion and this SNP happens to be selected as a tagging SNP, the power of the whole tagging SNP sets may drop in the test population. On the other hand, if a SNP is monomorphic in a reference population but polymor-phic in the test population, the tagging SNP sets selected from the reference population could be un-prepared for this particular SNP and may fail to tag it. As shown in supplemental Table 1 (http://www.genetics. org/supplemental/), overall these extreme cases were rare in regions and samples analyzed in this study whether the comparison was made against the early version of HapMap ENCODE data (February 2005) or the latest (October 2005). This demonstrated again that Korean, Japanese, and Chinese are indeed closely related populations and tagging SNPs selected from the CHB/JPT HapMap are highly transferable to the
Figure 2.—Evaluation of tagging performance. Tagging
SNPs were selected from HapMap Chinese (CHB), Japanese ( JPT), and the combined samples using Tagger at full density and applied to the 90 Korean individuals. An aggressive tag-ging mode with the same settings in Tagger was used for both selection of tagging SNPs and a test of their performance. Open bars denote CHB, shaded bars JPT, and solid bars the combined set of Chinese and Japanese samples (CHB1JPT).
TABLE 3
Haplotype conservation across populations
Population 1 Population 2 Region
Total frequency of major haplotypes
in population 1
Total frequency of major haplotypes
in population 2
Total frequency of major haplotypes
in population 1 conserved as major
haplotypes in population 2
Frequency correlation coefficient of major haplotypes between populations
(P-value)
CHB KR ENr131 0.88760.07 0.85960.09 0.71460.132 0.900 (,0.0001) CHB KR ENr213 0.92660.05 0.84160.09 0.73560.156 0.800 (0.0003) CHB KR ENr321 0.88160.101 0.85860.09 0.66260.115 0.838 (0.0003) CHB KR Total 0.89760.006 0.85460.008 0.70760.018 0.866 (,0.0001)
JPT KR ENr131 0.87460.06 0.88260.06 0.75960.138 0.927 (,0.0001) JPT KR ENr213 0.89260.07 0.79160.138 0.71060.161 0.769 (0.0154) JPT KR ENr321 0.89460.07 0.84560.09 0.74960.096 0.898 (,0.0001) JPT KR Total 0.88460.004 0.85260.009 0.74560.017 0.911 (,0.0001)
CHB1JPT KR ENr131 0.86960.066 0.84760.093 0.72760.096 0.750 (,0.0001) CHB1JPT KR ENr213 0.87960.076 0.81360.082 0.74260.121 0.893 (,0.0001) CHB1JPT KR ENr321 0.84160.090 0.79360.127 0.70460.126 0.785 (,0.0001) CHB1JPT KR Total 0.86460.075 0.82360.102 0.72460.110 0.770 (,0.0001)
Korean population. It is interesting, however, to observe that ENr213 did show more variations than ENr131 and ENr321 among the three populations (i.e., cases where SNPs were monomorphic in KR but polymorphic in CHB/JPT or vice versa. This is consistent with observa-tions made about LD and recombination.
DISCUSSION
LD patterns can be refined at a local level using haplotype block analysis resulting in delineation of hap-lotype blocks for high-LD and nonblocks for low-LD regions (Dalyet al.2001; Gabrielet al.2002; Phillips
et al.2003). Haplotype blocks are generally associated
with limited haplotype diversity, such that a few major haplotypes explain the majority of the diversity in a block (Dalyet al. 2001; Gabrielet al. 2002; Phillips
et al. 2003). The Korean population is known to be
very close to the Chinese and Japanese. The haplotype block structures of the three ENCODE regions, ENr131, ENr213, and ENr321, were generally concordant among Korean, Japanese, and Chinese, although some differ-ences were observed in ENr213 and ENr321. Block structure in ENr131 had the highest concordance. ENr213 had the highest sequence coverage by blocks, especially when density difference was taken into ac-count. In ENr321, block structure was more similar between Korean and Chinese than between Korean and Japanese. Because haplotype blocks were defined using LD thresholds, certain variations may change the block boundaries in particular regions (Ke et al. 2004b),
especially when the regions are small.
The human genome is known to be delimited by recom-bination into hotspot and coldspot regions (Gabrielet al.
2002; Phillipset al.2003; Crawfordet al.2004; McVean
et al.2004). Coldspot regions usually correspond to lotype blocks, whereas hotspots typically occur where hap-lotype blocks are expected to break down (Gabrielet al.
2002; Phillipset al.2003). The recombination rate was
very simple in ENr131 showing low LD, while recombina-tion rates of ENr213 and ENr321 were more varied. In general, the patterns of LD and recombination are highly conserved between the Koreans and Chinese and Japa-nese. Having two related East Asian population HapMaps enables us to examine a region in close detail via com-parison. If the Japanese and Chinese maps are highly con-cordant, as in ENr131, a Korean sample would likely share similar patterns of LD and recombination (Figure 1). On the other hand, if differences are observed between Japanese and Chinese maps, as in ENr213 and ENr321, a Korean sample might be expected to reveal greater vari-ability within and between populations. This understand-ing could assist in interpretunderstand-ing disease associations in a particular region.
A more practical use of human genome variation maps is perhaps to design tagging SNPs for related pop-ulations in regional or genomewide association studies
( Johnson et al.2001; Gibbs et al.2003; Stram 2004).
The present results also show that tagging SNPs selected from the Chinese and particularly from the Japanese samples are highly transferable to our Korean samples. Even in regions where differences were observed among the three groups, tagging SNPs from the Japanese per-formed at least as effectively as those from Korean sam-ples. These observations suggest that the Japanese and Chinese HapMaps will be robust for the Korean pop-ulation and serve as an important resource for the as-sociation and population studies of the Koreans and possibly other Asian populations.
The authors gratefully acknowledge the Korean National Institute of Health for providing DNA samples and the Korean HapMap con-sortium. This work was supported by grants from the Korea Ministry of Science and Technology, the National Research and Development Program, the Korean Haplotype Information Development Program, the Samsung Corporate Research Fund, and the DNA Link Research Fund. X.K. was supported by the Wellcome Trust. L.R.C. was supported by the Wellcome Trust and National Institutes of Health (NIH). B.S.W. was supported by the NIH.
LITERATURE CITED
Ahmadi, K. R., M. E. Weale, Z. Y. Xue, N. Soranzo, D. P. Yarnall et al., 2005 A single-nucleotide polymorphism tagging set for human drug metabolism and transport. Nat. Genet.37(1): 84– 89.
Akey, J. M., G. Zhang, K. Zhang, L. Jinand M. D. Shriver, 2002 In-terrogating a high-density SNP map for signatures of natural se-lection. Genome Res.12(12): 1805–1814.
Bansal, A., D.van denBoom, S. Kammerer, C. Honisch, G. Adam et al., 2002 Association testing by DNA pooling: an effective initial screen. Proc. Natl. Acad. Sci. USA99:16871–16874. Barrett, J. C., B. Fry, J. Mallerand M. J. Daly, 2005 Haploview:
anal-ysis and visualization of LD and haplotype maps. Bioinformatics 21(2): 263–265.
Crawford, D. C., T. Bhangale, N. Li, G. Hellenthal, M. J. Rieder et al., 2004 Evidence for substantial fine-scale variation in recom-bination rates across the human genome. Nat. Genet.36(7): 700–706.
Daly, M. J., J. D. Rioux, S. F. Schaffner, T. J. Hudsonand E. S. Lander, 2001 High-resolution haplotype structure in the hu-man genome. Nat. Genet.29(2): 229–232.
deBakker, P. I., R. Yelensky, I. Pe’er, S. B. Gabriel, M. J. Dalyet al., 2005 Efficiency and power in genetic association studies. Nat. Genet.37(11): 1217–1223.
Denomme, G. A., and M. VanOene, 2005 High-throughput multi-plex single-nucleotide polymorphism analysis for red cell and platelet antigen genotypes. Transfusion45(5): 660–666. Dudbridge, F., and B. P. Koeleman, 2004 Efficient computation
of significance levels for multiple associations in large studies of correlated data, including genomewide association studies. Am. J. Hum. Genet.75(3): 424–435.
Evans, D. M., L. R. Cardonand A. P. Morris, 2004 Genotype pre-diction using a dense map of SNPs. Genet. Epidemiol.27(4): 375–384.
Gabriel, S. B., S. F. Schaffner, H. Nguyen, J. M. Moore, J. Royet al., 2002 The structure of haplotype blocks in the human genome. Science296:2225–2229.
Gibbs, R. A., J. W. Belmont, P. Hardenbol, T. D. Willis, F. Yu et al., 2003 The International HapMap Project. Nature 426: 789–796.
International HapmapConsortium, 2005 A haplotype map of the human genome. Nature437:1299–1320.
Ke, X., S. Hunt, W. Tapper, R. Lawrence, G. Stavrides et al., 2004a The impact of SNP density on fine-scale patterns of link-age disequilibrium. Hum. Mol. Genet.13(6): 577–588. Ke, X., C. Durrant, A. P. Morris, S. Hunt, D. R. Bentley et al.,
2004b Efficiency and consistency of haplotype tagging of dense SNP maps in multiple samples. Hum. Mol. Genet.13(21): 2557– 2565.
Li, N., and M. Stephens, 2003 A new multilocus model for linkage disequilibrium, with application to exploring variations in re-combination rate. Genetics165:2213–2233.
McVean, G. A., S. R. Myers, S. Hunt, P. Deloukas, D. R. Bentley et al., 2004 The fine-scale structure of recombination rate vari-ation in the human genome. Science304(5670): 581–584. Morton, N. E., 2005 Linkage disequilibrium maps and association
mapping. J. Clin. Invest.115(6): 1425–1430.
Mueller, J. C., E. Lohmussaar, R. Magi, M. Remm, T. Bettecken et al., 2005 Linkage disequilibrium patterns and tagSNP trans-ferability among European populations. Am. J. Hum. Genet. 76(3): 387–398.
Nielsen, R., M. J. Hubiszand A. G. Clark, 2004 Reconstituting the frequency spectrum of ascertained single-nucleotide polymor-phism data. Genetics168:2373–2382.
Phillips, M. S., R. Lawrence, R. Sachidanandam, A. P. Morris, D. J. Baldinget al., 2003 Chromosome-wide distribution of
haplo-type blocks and the role of recombination hot spots. Nat. Genet. 33(3): 382–387.
Pittman, A. M., A. J. Myers, P. Abou-Sleiman, H. C. Fung, M. Kaleem et al., 2005 Linkage disequilibrium fine-mapping and haplotype association analysis of the tau gene in progressive supranuclear palsy and corticobasal degeneration. J. Med. Genet. 42(11): 837–846.
Stram, D. O., 2004 Tag SNP selection for association studies. Genet. Epidemiol.27(4): 365–374.
Terwilliger, J. D., F. Haghighiand T. S. Hiekkalinna, 2002 Goring HHH A biased assessment of the use of SNPs in human complex traits. Curr. Opin. Genet. Dev.12(6): 726–734.
Thomas, D., R. Xieand M. Gebregziabher, 2004 Two-stage sam-pling designs for gene association studies. Genet. Epidemiol. 27(4): 401–414.
Weir, B. S., L. R. Cardon, A. D. Anderson, D. M. Nielsenand W. G. Hill, 2005 Measures of human population structure show heterogeneity among genome regions. Genome Res.15:1468– 1476.
Wright, S., 1951 The genetical structure of populations. Ann. Eugen.15:323–354.