Experimental Investigation and Optimization of Process
Parameters for Mechanical Characterization of Natural
Fiber-Reinforced Composites
K.Prasad Raju1, V.V.M.K.Raju 2, Dr.S.Rajesh 3 , N.S.K.Varma 4
Assistant Professor, Department of Mechanical Engineering, SRKR Engineering College, Bhimavaram, AP, India1
Assistant Professor, Department of Mechanical Engineering, SRKR Engineering College, Bhimavaram, AP, India2
Associate Professor, Department of Mechanical Engineering, SRKR Engineering College, Bhimavaram, AP, India3
Assistant Professor, Department of Mechanical Engineering, SRKR Engineering College, Bhimavaram, AP, India4
ABSTRACT: Work has been carried out to investigate the effects of the various parameters such as type of fibers (Hemp, Jute & Banana), type of resins (GP, ISO & Boat grade) and number of layers (3, 4 & 5) on the tensile strength and ductility to obtain the optimal sets of parameters so that the quality of prepared fiber composites can be optimized. The natural fiber reinforced composites used in the present work are manufactured using hand lay-up technique. The Taguchi technique has been used to investigate the effects of the parameters and subsequently to predict sets of optimal parameters for optimum quality characteristics. Moreover, Analysis of variance (ANOVA) was performed to know the impact of individual factors on the tensile strength and ductility of the fabricated composites against a stated level of confidence. Confirmation experiments are further conducted to validate the results.
KEYWORDS: Natural fibers, Tensile strength, Ductility, ANOVA, Taguchi method.
I. INTRODUCTION
Many researchers are searching for structural materials of high strength, less weight and low cost, in general strong materials are relatively dense and light materials have less strength. In order to achieve high strength and less weight, it requires combining two or more distinct materials to get composite materials. The combination results in superior properties not exhibited by the individual materials. Many composite materials are composed of just two phases one is termed as matrix phase, which is continuous and surrounds the other phase often called the dispersed phase or reinforcement phase [1-2]. The reinforcement is usually much stronger and stiffer than the matrix, and gives the composite good properties. The matrix holds the reinforcements in orderly pattern. The matrix materials can be metallic, polymeric or ceramic. A metal matrix composite consists of a matrix of metals or alloys reinforced with metal fibers such as boron carbon. When the matrix is a polymer the composite is called polymer matrix composite (PMC).Ceramic matrix composites consists of a matrix reinforced with ceramic fibers such as silicon carbide, alumina or nitride. The reinforcing phase can. either be fibrous or non-fibrous (particulates) in nature and if the fibers are extracted from plants.
Plant fibers are light compared to glass, carbon and aramid fibers. The biodegradability of plant fibers can contribute to a healthy ecosystem while their low cost and high performance fulfils the economic interest of industry. When natural fiber-reinforced plastics are subjected, at the end of their life cycle, to combustion process or landfill, the released amount of CO2 of the fibers is neutral with respect to the assimilated amount during their growth. Natural fibers such as banana, cotton, coir, sisal and jute have attracted the attention of scientists and technologists for application in consumer goods, low cost housing and other civil structures. It has been found that these natural fiber composites possess better electrical resistance, good thermal and acoustic insulating properties and higher resistance to fracture. They are also renewable and have relatively high strength and stiffness and cause no skin irritations. On the other hand, there are also some disadvantages, such as moisture absorption, quality variations and low thermal stability.
Many investigations have been made on the potential of the natural fibers as reinforcements for composites and in several cases the results have shown that the natural fiber composites own good stiffness but the composites do not reach the same level of strength as the glass fiber composite [3]. Hybrid composite materials are made by combining two or more different types of fibers in a common matrix Hybridization of two types of short fibers having different lengths and diameters offers someadvantages over the use of either of the fibers alone in a single polymer matrix. Most of the studies are on the hybridization of natural fibers with glass fibers to improve the properties [4–10]. They possess a good calorific value and cause little concern in terms of health and safety during handling. In addition, they exhibit excellent mechanical properties, have low density and are inexpensive. This good environmental friendly feature makes the materials very popular in engineering markets such as the automotive and construction industry. In the present paper an attempt has been made to optimize the parameters such as tensile strength and ductility of natural fiber reinforced composites using Taguchi method
II. MATERIALS AND MANUFACTURING METHOD
A. MATERIALS
Hemp is replacing wood, cotton and petroleum-based materials, including plastic, in virtually every product. A Hemp yarn is strong and has of all natural fibers the highest resistance against water, but it shouldn't be creased excessively to avoid breakage. The fiber is used for the production of rope, fishing nets, paper, sacks, fire hoses and textile. Hemp fibers show the greatest combination of strength and stiffness of plant fibers. Plant fibers have a low density when compared to synthetic fibers glass and carbon.
Jute is a long, soft, shiny plant fiber that can be spun into coarse, strong threads. It is produced from plants in the genus corchorus. Jute is one of the cheapest natural fibers, and is second only to cotton in amount produced and variety of uses. Jute fibers are composed primarily of the plant materials cellulose and lignin. Jute is graded (rated) according to its color, strength, and fiber length. The fibers are off-white to brown, and 1-4m long. It is 100% bio-degradable & recyclable and thus environment friendly.
Fig. 1 Hemp fiber Fig. 2 Banana Fiber Fig. 3 Jute fiber
III. HAND LAY-UP TECHNIQUE
Most popularly used technique hand lay-up technique is used for manufacturing of composite materials. In this technique the fiber plies were cut to size. The appropriate numbers of fiber plies were taken: two for each. Then the fibers were weighed and accordingly the resin and hardeners were weighed. In the present work Hardener (araldite) HY 951 is used which has a viscosity of 10-20 poise at 25 C0. Epoxy and hardener were mixed by using glass rod in a bowl. Care was taken to avoid formation of bubbles. Because the air bubbles were trapped in matrix may result failure in the material. The subsequent fabrication process consisted of first putting a releasing film on the mould surface. Next a polymer coating was applied on the sheets. Then fiber ply of one kind was put and proper rolling was done. Then resin was again applied, next to it fiber ply of another kind was put and rolled. Rolling was done using cylindrical mild steel rod. This procedure was repeated until eight alternating fibers have been laid. On the top of the last ply a polymer coating is done which serves to ensure a god surface finish. Finally a releasing sheet was put on the top; a light rolling was carried out. Then a 20 kg weight was applied on the composite. It was left for 24 hrs to allow sufficient time for curing and subsequent hardening.
The composites sheets were fabricated from banana, jute and hemp fiber’s, with resin matrix. The resin used was epoxy resin. The weight fraction of composites was maintained at 40% fiber and 60% resin. After the hybrid composites fabrication cutting of the specimen is done in the desired shape to test the mechanical properties of the natural hybrid composite fiber.
IV. EXPERIMENTAL PROCEDURE
Initially the plan of tests was conducted according to L9 orthogonal array. The various parameter and their levels considered for the present study were given in the Table 1. The parameters and their corresponding levels were selected based on the literature. Totally 9 experiments were conducted according to Taguchi orthogonal array.
Table 1 Parameter and their levels used for experimentation
S.No Parameters Symbol Levels
1 2 3
1 Type of fiber A Hemp Jute Banana 2 Type of resin B GP ISO Boat Grade 3 Number of Layers C 3 4 5
test piece. Tensometer used for testing the composite samples is shown in Fig. 5. The failed specimen after performing tensile strength is as shown in Fig. 6.
This tensile test is done using tensometer. A tensometer is a device used to determine a material's response to varying strains, called loads. The amount of stretch that a material has when it is under strain provides important information about the material’s tensile strength and fatigue strength. tensometer devices are routinely used in the manufacturing industry to ensure that parts meet necessary strength and endurance requirements.
Fig. 4 samples used for tensile strength Fig. 5 Tensometer used for tensile testing
Fig. 6 Failed specimen after performing tensile strength
V. RESULTS AND DISCUSSION
Table 2 Experimental design matrix (L9) and experimental values
Experiment. No. A B C Tensile Strength (MPa) Elongation (%)
1 1 1 1 39.785 4.000
2 1 2 2 54.936 4.689
3 1 3 3 58.424 6.896
4 2 1 2 38.477 4.138
5 2 2 3 52.538 5.103
6 2 3 1 57.334 5.241
7 3 1 3 33.681 4.689
8 3 2 1 43.164 6.068
9 3 3 2 54.282 6.344
A. ANOVA FOR TENSILE STRENGTH
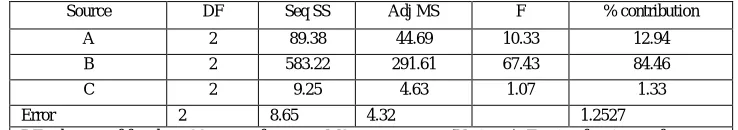
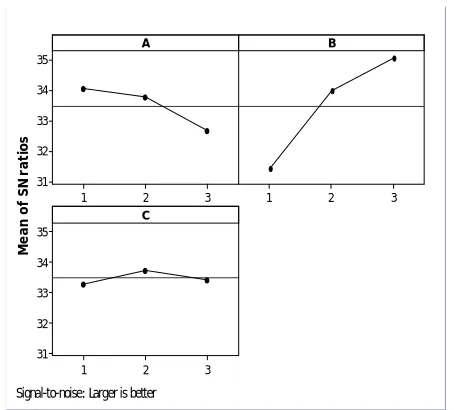
In order to investigate which parameters significantly affect the quality, ANOVA was performed using MINITAB software. It was done with the actual data of tensile values for analyzing the influence of fiber, resins and number of layers on the total variance of the results. From analysis of Table 3, it can be observed that the control variables A (12.94%), B (84.46%) influence the tensile stress, whereas the C had less influence (1.33 %) when compared to remaining variables. The variables present do not present a physical significance when percentage of contribution is nearly same as error associated. Hence in this study, it was found that all control variables has physical significant effect and especially the variable C had more physical significant effect on ultimate tensile stress values. Fig. 7 shows the main effect plots for means of ultimate tensile stress values. From the graph it can be observed that tensile strength is decreasing as the variable A is increasing, strength value increases as the parameter B is increasing and its values increases up to certain level and then it decreases for variable C. Fig. 8 depict the mean of Signal-to-noise (SNR) values. From these graph the optimal conditions of these control factors can be very easily determined. The graph shows the change of the SNR when setting of the control factor was changed from one level to other. The best value was at the higher SNR values in the response graph. From Fig. 8 it can be seen the maximum ultimate tensile stress value will be obtained at A1, B3, and C2.
Table 3 ANOVA table for tensile strength
Source DF Seq SS Adj MS F % contribution
A 2 89.38 44.69 10.33 12.94
B 2 583.22 291.61 67.43 84.46
C 2 9.25 4.63 1.07 1.33
Error 2 8.65 4.32 1.2527
DF - degrees of freedom, SS - sum of squares, MS - mean squares(Variance), F-ratio of variance of a source to variance of error, P < 0.05 - determines significance of a factor at 95% confidence level
B. ANOVA FOR DUCTILITY
Table 4 ANOVA table for ductility
Source DF Seq SS Adj MS F % contribution A 2 1.1527 0.5763 1.08 14.36 B 2 5.3374 2.6687 5.01 66.51 C 2 0.4691 0.2346 0.44 5.845 Error 2 1.0655 0.5328 13.277
DF - degrees of freedom, SS - sum of squares, MS - mean squares(Variance), F-ratio of variance of a source to variance of error,
P < 0.05 - determines significance of a factor at 95% confidence level
Fig. 9 shows the main effect plots for means of ductility values. From the graph it can be observed that ductility is decreasing up to certain level and then it was increasing as the variable A is increasing. Similarly ductility value increases as the parameter B is increasing and its values increases as the levels of variable C increases. Fig. 10 depicts the mean of Signal-to-noise (SNR) values. From these graph the optimal conditions of these control factors can be very easily determined. The graph shows the change of the SNR when setting of the control factor was changed from one level to other. The best value was at the higher SNR values in the response graph. From Fig. 10 it can be seen the maximum ductility value will be obtained at A3, B3, and C3.
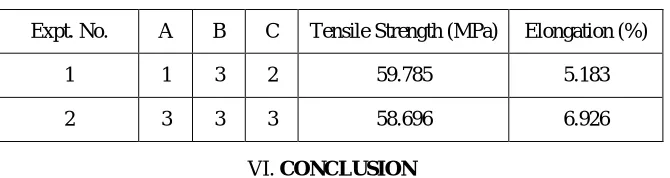
Confirmation tests were conducted to validate the statistical analysis by conducting the tensile test on specimen fabricated with the obtained optimized conditions. The experimental values and the corresponding levels are tabulated in the Table 5
.
Table 5 Confirmation test values
Expt. No. A B C Tensile Strength (MPa) Elongation (%)
1 1 3 2 59.785 5.183
2 3 3 3 58.696 6.926
VI. CONCLUSION
In the present work detailed investigation was carried out on the natural fiber reinforced fiber composites. The investigation includes manufacturing of composites produced through hand lay-up technique and evaluation of mechanical properties according to L9 orthogonal array. The major contributions drawn from the investigation are summarized as below
Hand lay-up technique was successfully adopted in the fabrication of natural fiber reinforced fiber composites.
Tensile strength was decreasing as the variable A is increasing, strength value increases as the parameter B is increasing and its values increases up to certain level and then it decreases for variable C.
Ductility was decreasing up to certain level and then it was increasing as the variable A is increasing. Similarly ductility value increases as the parameter B is increasing and its values increases as the levels of variable C increases.
Based on ANOVA results of tensile strength, it can be observed that the control variables A (12.94%), B (84.46%) influence the tensile stress, whereas the C had less influence (1.33 %) when compared to remaining variables.
Based on ANOVA results of ductility it can be observed that the control variables A (14.36%), B (66.51%) influence the ductility, whereas the C had less influence (5.845 %) when compared to remaining variables.
M e a n o f T e n s ile s tr e n g t h v a lu e s ( M P a ) 3 2 1 55 50 45 40 35 3 2 1 3 2 1 55 50 45 40 35 A B C
M e a n o f S N r a ti o s 3 2 1 35 34 33 32 31 3 2 1 3 2 1 35 34 33 32 31 A B C
Signal-to-noise: Larger is better
Fig. 7 Main effect plots for means of ultimate tensile strength values Fig. 8 Main affects plots for SNR means of ultimate tensile strength
M e a n o f E lo n g a ti o n v a lu e s ( % ) 3 2 1 6.0 5.5 5.0 4.5 4.0 3 2 1 3 2 1 6.0 5.5 5.0 4.5 4.0 A B C M e a n o f S N r a ti o s 3 2 1 16 15 14 13 3 2 1 3 2 1 16 15 14 13 A B C
Signal-to-noise: Larger is better
REFERENCES
[1] K. John, S. Venkata Naidu, “Chemical resistance studies of sisal/glass., fiber hybrid composites”, Journal of Reinforced. Plastic Composites. Vol. 26(4), pp. 373–376, 2007.
[2] H. P. S. Abdul Khalil, S. Hanida, C. W. Kang, N.A. Nikfuaad, Agro hybrid composite: “the effects on mechanical and physical properties of oil palm fiber (efb)/glass hybrid reinforced polyester composites”, Journal of Reinforced Plastic Composites, vol. 26(2), pp. 203–218, 2007.
[3] Oksman K, Skrivars M, Selin JF. “Natural fibers as reinforcement in polylactic acid (PLA) composites”. Composites Science and Technology, vol. 63(9), pp. 1317–24, 2003.
[4] Sreekalaa MS, George Jayamol, Kumaran MG, Thomas Sabu. “The mechanical performance of hybrid phenol–formaldehyde- based composites reinforced with glass and oil palm fibers”. Composites Science and Technology, vol. 62(3), pp. 339–53, 2002.
[5] Mishra S, Mohanty AK, Drzal LT, Misra M, Parijac S, Nayak SK, et al. “Studies on mechanical performance of bio fiber/glass reinforced polyester hybrid composites”. Composites Science and Technology, vol. 63(10), pp. 1377–85, 2003.
[6] Jacob Maya, Thomas Sabu, Varghese KT. “Mechanical properties of sisal/oil palm hybrid fiber reinforced natural rubber composites”. Composites Science and Technology, vol. 64(7), pp. 955–65, 2004.
[7] Esfandiari Amirhossein. “Mechanical properties of PP/Jute Glass fiber composites – a statistical investigation”. Journal of Applied Sciences, vol. 7(24), pp.3943–50, 2007.
[8] Velmurugan R, Manikandan V. “Mechanical properties of palmyra/glass fiber hybrid composites”. Composites Part-A, vol. 38(10), pp. 2216– 26, 2007.
[9] Thiruchitrambalam M, Alavudeen A, Athijayamani A, Venkateshwaran N, Elayaperumal A. “Improving mechanical properties of banana/kenaf polyester hybrid composites using sodium lauryl sulfate treatment” Materials Physics and Mechanics, vol. 8, pp. 165-173, 2009. [