DOI: 10.1534/genetics.104.026401
Mapping of Multiple Quantitative Trait Loci Affecting Bovine
Spongiform Encephalopathy
Chi Zhang, Dirk-Jan de Koning, Jules Herna´ndez-Sa´nchez, Chris S. Haley,
John L. Williams and Pamela Wiener
1Roslin Institute (Edinburgh), Roslin, Midlothian EH25 9PS, United Kingdom Manuscript received January 13, 2004
Accepted for publication April 21, 2004
ABSTRACT
A whole-genome scan was conducted to map quantitative trait loci (QTL) for BSE resistance or susceptibil-ity. Cows from four half-sib families were included and 173 microsatellite markers were used to construct a 2835-cM (Kosambi) linkage map covering 29 autosomes and the pseudoautosomal region of the sex chromosome. Interval mapping by linear regression was applied and extended to a multiple-QTL analysis approach that used identified QTL on other chromosomes as cofactors to increase mapping power. In the multiple-QTL analysis, two genome-wide significant QTL (BTA17 and X/Yps) and four genome-wide suggestive QTL (BTA1, 6, 13, and 19) were revealed. The QTL identified here using linkage analysis do not overlap with regions previously identified using TDT analysis. One factor that may explain the disparity between the results is that a more extensive data set was used in the present study. Furthermore, methodolog-ical differences between TDT and linkage analyses may affect the power of these approaches.
B
OVINE spongiform encephalopathy (BSE) is a ods following experimental challenge of sheep with dif-chronic, degenerative disorder affecting the cen- ferent sources of scrapie and BSE (see Hunter1999 tral nervous system of cattle (http://www.bse.org.uk). for review). In humans, the sporadic forms of CJD and It was first described in 1987 (Wells et al. 1987) and vCJD both seem to be associated with certain PrP gene confirmed to be a transmissible spongiform encepha- polymorphisms (Palmer et al. 1991; Collinge et al. lopathy (TSE) in 1988 (http://www.bseinquiry.gov.uk). 1996b). AlthoughNeibergset al.(1994) suggested an TSEs also include scrapie in sheep and Creutzfeldt-Jakob increased BSE incidence in families of cattle with a disease (CJD) and Kuru in humans. According to the particular genotype within the octapeptide repeat re-aberrant protein agent hypothesis, a disease-specific iso- gion of the PrP gene, to date, no convincing association form of the prion protein PrPSc interacts with normalbetween polymorphisms at the PrP locus and incidence host PrP, resulting in its conversion to PrPSc. PrPSc is
of BSE disease has been demonstrated for cattle, which resistant to digestion with protease and can be detected may be due partly to the relatively limited variability of in peripheral organs following infection; it later accu- the bovine PrP gene (Hillset al.2003). Studies of the mulates in the brain as the disease progresses. Clinical progeny of cows that developed BSE have suggested onset of disease is associated with neuronal cell death that there may be some elements of genetic control of resulting in the spongiform appearance of the brain susceptibility in cattle as there is an increased risk of and results in “nervousness,” kicking, abnormal gait, BSE in offspring of BSE-affected cows compared with and pelvic limb ataxia in affected animals (Patterson unaffected controls (Donnellyet al. 1997; Ferguson
andPainter1999). BSE can be experimentally trans- et al.1997;Wilesmithet al.1997). However, it has been
mitted across species (Bruceet al.1994) and a distinct difficult to distinguish between increased susceptibility variant of CJD (vCJD) in humans has been linked to and maternal transmission of disease. Intriguingly, re-BSE (Collinge et al. 1996a; Almond and Pattison cent studies of TSE transmission in mice showed that
1997).
genetic loci other than the PrP gene are likely to be A major feature of prion diseases is that, although
involved in the genetic control of prion diseases (Baron
they are not genetic, susceptibility of individuals to TSE
2002;Morenoet al.2003). In an earlier study on cattle, diseases is influenced by their genetic makeup and in
we identified three marker loci on bovine chromosomes particular, their PrP genotype. Three codons in the
5, 10, and 20 that were significantly associated with BSE sheep PrP gene, at positions 136, 154, and 171, have
and are not linked to the PrP locus (
Herna´ndez-Sa´n-been strongly associated with different incubation
peri-chez et al.2002).
A prion disease can be considered as a continuous trait if, for example, incubation period is measured or
1Corresponding author:Roslin Institute (Edinburgh), Roslin,
Midlo-thian EH25 9PS, United Kingdom. E-mail: [email protected] as a binary trait, if we consider individuals as being either
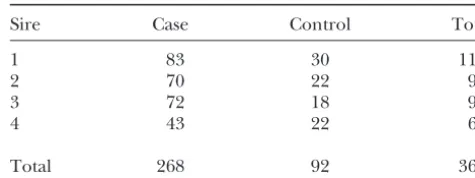
TABLE 1
affected or unaffected. A binary trait can be assumed
to be controlled by an underlying continuous variable Numbers of BSE-affected and BSE-unaffected
(FalconerandMackay1996) where the values of the offspring per sire in the study
variable above a certain threshold level are designated
as affected (1) and those below it are designated as Sire Case Control Total
unaffected (0). Under this assumption, binary data can
1 83 30 113
be analyzed for QTL with the same methods used for 2 70 22 93
quantitative traits, although power and accuracy may be 3 72 18 90
reduced (Xu and Atchley1996; Kadarmideen et al. 4 43 22 65
2000). Visscheret al.(1996a) studied QTL for binary
Total 268 92 360
traits in backcross and F2 populations using linear re-gression (LRG) and a generalized linear model (GLM) and concluded that both LRG and GLM gave similar results when the errors within each genotype class were
by histopathology. No other information on their dis-normally distributed. Kadarmideenet al.(2000)
com-ease progression was available. Samples were collected pared GLM with LRG to map QTL for binary traits in
by the U.K. Veterinary Field Service at the time of slaugh-a multi-fslaugh-amily hslaugh-alf-sib design slaugh-and slaugh-also reported thslaugh-at they
ter of BSE suspects. Their sires were commonly used as had similar power to detect the QTL and gave similar
artificial insemination donors and were not known to estimates of QTL location, effects, and variances.
have an increased frequency of BSE-affected offspring. In cattle, QTL mapping is commonly performed in
Control (unaffected) animals and BSE cases were sam-a collection of psam-aternsam-al hsam-alf-sib fsam-amilies thsam-at sam-are
pro-pled at approximately the same time from the same duced by artificial insemination. Neimann-Sorensen
farms and were sire matched and age matched; hence,
andRobertson(1961) and Welleret al.(1990)
pro-we make the assumption that both sets of animals pro-were posed, respectively, the daughter and granddaughter
exposed to the same level of infectious agent. However, designs to analyze linkage between a single marker and
there is no way to confirm that they were exposed to a QTL when data are structured in half-sib families. The
the same degree as the affected animals. None of the drawback of these methods is that they use information
controls subsequently appeared in the BSE case data-from a single marker at a time. Interval mapping, which
base of the British Ministry of Agriculture. Microsatellite uses information from multiple markers simultaneously,
markers were chosen from two published bovine linkage has been used by Georgeset al. (1995) andKnottet
maps, the International Bovine Reference Panel (IBRP) al.(1996) for analyzing data from half-sib families.de
map (http://www.cgd.csiro.au) and the U.S. Meat Animal
Koninget al.(2001) developed a cofactor analysis
strat-Research Center map (http://www.marc.usda.gov), to egy for simultaneous analysis of multiple chromosomes
cover all autosomes (Bos taurus chromosomes BTA1–29) to increase the power and the precision of QTL
map-and the pseudoautosomal region of the sex chromo-ping in outbred populations, structured in half-sib
fami-somes (BTAX/Yps). A panel of 173 microsatellite mark-lies.
ers was genotyped on all samples using an ABI373 DNA In this study, a genome-wide scan for QTL associated
sequencer. The genotypes of the sires were inferred with BSE resistance or susceptibility was performed by
from those of their daughters while the genotypes of applying interval mapping and cofactor analysis
meth-dams were unknown. For more details about the samples ods in paternal half-sib Holstein cattle families. The
and genotyping seeHerna´ndez-Sa´nchezet al.(2002). goodness of fit of a two-QTL model was also tested to
Markers and map construction:Marker linkage maps search for multiple QTL within the same linkage group.
were constructed using Cri-map software (Greenet al. The results were compared with previous findings
ob-1990) after setting all identifiable genotyping errors to tained using transmission-disequilibrium tests (TDT;
unknown genotypes. Various Cri-map options were used
Herna´ndez-Sa´nchezet al.2002).
to determine linkage groups, marker orders, and marker distances within linkage groups. If the map distance of MATERIALS AND METHODS two neighboring markers wasⱖ100 cM, that linkage group was divided into two unlinked groups. Thirty-three linkage Samples and genotyping: Four half-sib Holstein sire
groups, covering 2835 cM of the bovine genome across families with 360 cows, of which 268 were BSE affected
all autosomes and the pseudoautosomal region of the sex and 92 BSE unaffected, were analyzed (Table 1). These
chromosomes, were produced. The complete set of maps families were selected from the same sample of animals
can be viewed as supplementary material (supplement 1 as used in the previous study (Herna´ndez-Sa´nchezet al.
at http://www.genetics.org/supplemental/). 2002). Study animals contracted BSE from the
environ-QTL analysis:Linear regression methods were used ment during the United Kingdom’s epidemic of the late
for QTL analysis of the binary data (Visscheret al.1996a; 1980s and 1990s. They were diagnosed by veterinarians
per-formed by using the web-based software package QTL linkage groups where significant evidence for a single QTL was detected by the cofactor analysis. A 1-cM grid Express (Seaton et al. 2002), which implements the
search was performed in QTL Express to estimate the multi-marker linear regression method (Knott et al.
effects of two QTL at separate positions within the same 1996). In short, a conditional probability of inheriting
linkage group simultaneously, examining all possible a particular haplotype from the sire was inferred from
pairs of locations, and to test whether the two-QTL model the marker genotypes in all half-sib offspring. Then
explained significantly more variation than the best the phenotypic value (i.e., affected or unaffected) was
QTL from the single-QTL analysis. Cofactors from other regressed on the probability that a particular QTL allele
linkage groups identified in the cofactor analysis were (associated with susceptibility or resistance) was
inher-also fitted. The genetic model was ited from the sire. The genetic model was Yij ⫽ i ⫹
biXij⫹eij, whereYijis the phenotype of animalj, offspring
Yij⫽ i⫹bilXijl⫹bimXijm⫹
兺
nk⫽1
bikXijk⫹eij, of sirei;i is the mean of sire familyi;bi is the allele
substitution effect of the QTL within familyi;Xijis the
where the variables are as described above andlandm probability that animal j inherited the (arbitrarily
as-refer to the two putative QTL positions on the chromo-signed) first haplotype of sirei; and eij is the residual
some. The F- statistics were calculated by comparing effect. For every linkage group,F- statistics were
calcu-mean squares from the two-QTL model with that of the lated by comparing the pooled mean squares obtained
best one-QTL model with degrees of freedom equal to from regression within families to the residual mean
S(numerator) andN⫺S(3⫹C) (denominator), where square. Numerator degrees of freedom wasS and
de-Sis the number of sires,Cis the number of cofactors, nominator degrees of freedom wasN⫺ 2S, whereSis
andN is the total number of offspring. the number of sires andNis the total number of
prog-Significance thresholds and confidence intervals: eny. This process was repeated at 1-cM intervals along
Searching for QTL across an entire genome involves a each linkage group with the maximumF- value
indicat-large number of statistical tests for marker-trait associa-ing the most likely position of a QTL.
tions. The use of an appropriate significance threshold A multiple (cofactor) analysis can partly account for
for each test is necessary to keep the number of false the variance generated by other segregating QTL and
sub-positives to an acceptable level (Lynch and Walsh
stantially increases both power to detect a QTL and
pre-1998). Significance thresholds were determined empiri-cision of estimating the QTL position (Lynch and
cally by permutation tests to account for missing
geno-Walsh1998). The strategy adopted was the
simultane-types and differences in marker density (Churchill
ous analysis of multiple chromosomes in an outbred
andDoerge 1994).
half-sib design (de Koninget al.2001) where all
posi-Chromosome-wide significance levels (Pchromosome) were tions within a linkage group could be included in the
obtained for each linkage group using 10,000 permuta-analysis of any family. Every round of permuta-analysis in this
pro-tions. Two genome-wide thresholds were set, one for cedure involved two steps. Chromosome positions
show-“suggestive” and one for “significant” QTL. For genome-ing significant associations with the trait from the
pre-wide suggestive linkage, one false positive is expected liminary analysis were first selected as cofactors. Then
(LanderandKruglyak1995). The threshold for this
all linkage groups were analyzed by standard interval
level for a specific linkage group corresponds to that mapping including these cofactors as covariates, using
for aP-value equal to the contribution (R) of that link-the following genetic model,
age group to the total genome length, which was ob-tained by dividing the length of a linkage group by the Yij ⫽ i⫹ biXij⫹
兺
n
k⫽1
bikXijk⫹ eij, total length of the genome. The second threshold, for
genome-wide significant linkage, was set to that corre-where the variables are as given above, and the sum- sponding to 5% significance (i.e., one false positive ex-mation term reflects the contribution of cofactors, QTL pected in 20 genome scans; Lander and Kruglyak identified on other chromosomes. Cofactors on the chro- 1995), and it was obtained from the chromosome-wide mosome under analysis were omitted (nis the number significance levels using the following Bonferroni cor-of linkage groups minus 1). QTL exceeding 5% chromo- rection (de Koninget al.1999):
some-wide threshold levels were selected as cofactors in
Pgenome⫽1⫺(1⫺ Pchromosome)1/R. the next round and this analysis was repeated until no
new QTL were revealed. Cofactors were dropped from Confidence intervals (C.I.) for the location of possible the analysis if the corresponding significance level was QTL were constructed by bootstrapping the samples lower than the threshold calculated at every round for 1000 times (Visscheret al.1996b). Taking the top and
each linkage group. bottom 2.5% of resampled positional estimates gave the
To distinguish between the presence of one QTL with estimated 95% confidence interval for each QTL. a large effect and two linked QTL with smaller effects, In the two-QTL model, anF- test of two QTLvs.one
TABLE 2
Distribution of markers, marker intervals, and information content across chromosomes
Length Average marker Contribution Information
BTA Markers (cM) interval (cM) (R) content
1 11 185 16.8 0.065 0.52
2 6 134 22.3 0.047 0.65
3 7 147 21.0 0.052 0.58
4 5 121 24.2 0.043 0.50
5 12 182 15.2 0.064 0.62
6 6 126 21.0 0.044 0.63
7A 3 30 10.0 0.011 0.49
7B 3 11 3.7 0.004 0.61
8 8 113 14.1 0.040 0.61
9 6 102 17.0 0.036 0.63
10 8 157 19.6 0.055 0.48
11A 2 11 5.5 0.004 0.28
11B 2 2 1.0 0.001 0.57
12 6 121 20.2 0.043 0.52
13 7 151 21.6 0.053 0.48
14 5 81 16.2 0.029 0.57
15 4 65 16.3 0.023 0.50
16 5 66 13.2 0.023 0.67
17 10 164 16.4 0.058 0.51
18 6 86 14.3 0.030 0.62
19 6 104 17.3 0.037 0.57
20 6 96 16.0 0.034 0.57
21B 4 73 18.3 0.026 0.45
22 4 81 20.3 0.029 0.55
23 5 77 15.4 0.027 0.50
24 4 67 16.8 0.024 0.47
25 3 52 17.3 0.018 0.53
26 6 84 14.0 0.030 0.57
27 3 19 6.3 0.007 0.54
28 2 10 5.0 0.004 0.62
29 3 29 9.7 0.010 0.68
X/Yps 4 88 22.0 0.031 0.36
Total 172 2835 16.5 (average) 1.000 0.55 (average)
Contribution was calculated by dividing the length of a linkage group by the total length. Information content measured as the ratio of the variance of QTL conditional probability to the maximum variance was averaged over every centimorgan along a linkage group. Chromosomes 7, 11, and 21 were each divided into two linkage groups, 7A/7B, 11A/11B, and 21A/21B (21A contains only one marker and is not shown), because the map distance between two adjacent markers on each chromosome was⬎100 cM.
gestive QTL detected by the single-QTL model. The probabilities along each linkage group at 1-cM intervals were collected for every offspring in a family. The mean significance of the test statistics was determined from a
probability (Pmean) and standard error (SE) for each fam-standardF- table with degrees of freedom as given above.
ily were calculated and t- statistics were obtained from Segregation distortion: The TDT explores
segrega-the formula: tion distortion within the affected individuals from a
heterozygous sire, significant distortion being seen as
T⫽ |Pmean⫺0.5|
SE .
evidence for the presence of a disease-related gene. To compare our results to those from a previous study
(Herna´ndez-Sa´nchezet al.2002), we tested for segre- Thresholds for genome-wide significant segregation
gation distortion within affected and unaffected individ- distortion were set at 5%, adjusted using the Bonferroni
uals for all linkage groups. correction for multiple testing (number of tests⫽688⫽
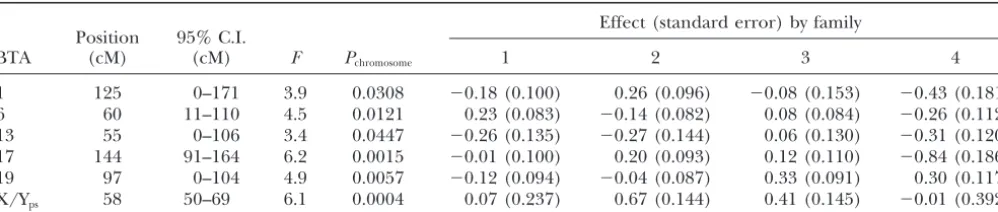
TABLE 3
The result of cofactor analysis by fitting five cofactors
Effect (standard error) by family Position 95% C.I.
BTA (cM) (cM) F Pchromosome 1 2 3 4
1 125 0–171 3.9 0.0308 ⫺0.18 (0.100) 0.26 (0.096) ⫺0.08 (0.153) ⫺0.43 (0.181)
6 60 11–110 4.5 0.0121 0.23 (0.083) ⫺0.14 (0.082) 0.08 (0.084) ⫺0.26 (0.112)
13 55 0–106 3.4 0.0447 ⫺0.26 (0.135) ⫺0.27 (0.144) 0.06 (0.130) ⫺0.31 (0.120) 17 144 91–164 6.2 0.0015 ⫺0.01 (0.100) 0.20 (0.093) 0.12 (0.110) ⫺0.84 (0.186)
19 97 0–104 4.9 0.0057 ⫺0.12 (0.094) ⫺0.04 (0.087) 0.33 (0.091) 0.30 (0.117)
X/Yps 58 50–69 6.1 0.0004 0.07 (0.237) 0.67 (0.144) 0.41 (0.145) ⫺0.01 (0.392)
Two QTL, BTA17 and BTAX/Yps, are 5% genome-wide significant. Others are 5% chromosome-wide significant. Significance threshold were determined by 10,000 permutations.
ily (43 for affecteds, 18 for unaffecteds), making this a 5% genome-wide significance threshold (Pgenomeⵑ0.01). The estimated QTL position for the X/Ypslinkage group conservative test.
is at 55 cM with a 95% C.I. between 52 and 65 cM. The F-ratios for all linkage groups can be viewed as the “no
RESULTS cofactor” points in Figure 2.
Cofactor analysis was then applied, where the cofac-Genetic map: A total of 173 microsatellite markers
tors were the QTL exceeding the 5% chromosome-wide were used to construct a 2835 cM (Kosambi) genetic
significance threshold found in the previous round. The linkage map of the bovine genome that included all
QTL analysis was repeated including the cofactors until autosomes and the pseudoautosomal region of the sex
no new QTL were revealed. By the final round, five chromosomes (Table 2). In total, 32 linkage groups
cofactors in total were fixed and six QTL were obtained were analyzed, excluding one, that contained a single
(one of the QTL did not feature as a cofactor). The marker, because interval mapping would not be very
numbers of cofactors fitted in successive rounds were powerful for such a case. The average marker interval
zero, seven, three, seven, four, six, and five. Two linkage per linkage group ranged from 1 to 24.2 cM with a
ge-groups (BTA17 and X/Yps) showed genome-wide sig-nome-wide mean of 16.5 cM. Most of the linkage groups
nificant evidence and four linkage groups (BTA1, 6, 13, were moderately informative with average information
and 19) showed genome-wide suggestive evidence for content (Knottet al.1998) ranging from 0.28 to 0.68.
a single QTL (Table 3 and Figure 1). The significant The average information content at genome level was
QTL on BTAX/Ypswas mapped to 58 cM (Pgenomeⵑ0.01), 0.55. The mapping results confirmed that the X/Yps
near marker TGLA325, with 95% C.I. between 50–69 markers underwent recombination in the sire and
there-cM. Families 2 and 3 accounted for most of this effect. fore were located in the pseudoautosomal region of the
The genome-wide significant QTL on BTA17 was at sex chromosomes.
marker INRA25, located at 144 cM (Pgenomeⵑ0.02), with Ten linkage groups were not in agreement with one
91–164 cM 95% C.I. Families 2 and 4 explained most or both of the two published maps. The majority of
of the effect of this QTL. the differences were minor flips between closely linked
To calculate the proportion of variance explained by markers. BTA13 was the only chromosome for which
the joint QTL, we estimated for each of the six QTL there was a major difference in the orientation of
mark-the ratio between mark-the sum of squares explained by mark-the ers; DIK93 was found at the centromeric end of the
multiple-QTL model and the total sum of squares. The chromosome in our study and at the telomeric end of
models including QTL plus four cofactors (BTA1, 6, 17, the IBRP map (most of the BTA13 markers used in this
19, and X) gave an estimate of 0.23 for the proportion of study were not found on the MARC map). Chance may
variance explained, while the model including QTL plus explain the minor differences between maps, but it is
five cofactors (BTA13) gave a slightly higher estimate not clear why the BTA13 maps were so different. As the
(0.25). average number of informative meioses per marker was
Compared with the six QTL obtained without cofac-167 in this study and all maps were well supported by
tors, one QTL on BTA22 was removed and one new the Cri-map “FLIPS” option, we used this map rather
QTL on BTA1 was added. Among the remaining five than published map positions.
QTL, the estimated positions of three QTL, on BTA6, QTL analysis: Six genome-wide suggestive QTL
19, and X/Yps, moved 2–5 cM after the inclusion of (Pchromosome⬍R) were identified using single-QTL
map-cofactors, and theF-statistics for individual QTL were ping (BTA6, 13, 17, 19, 22, and X/Yps). The most striking
Figure 1.—Profile of the F-statistics for four genome-wide suggestive QTL (BTA1, 6, 13, 19) and two genome-wide significant QTL (BTA17 and X/Yps) identified by cofactor analysis. Hori-zontal dashed line indicates genome-wide suggestive threshold and hori-zontal dashed-and-dotted line indicates 5% genome-wide significance threshold. Vertical dotted lines mark 95% confi-dence intervals. Where no dotted line is shown, the confidence limit is the end of the linkage group. Markers in paren-theses are at the same position as their left adjacent marker.
from⫺0.1 (BTAX/Yps) to⫹2.0 (BTA17). Figure 2 shows within affected individuals was found for one or more families on the following chromosomes: BTA1, 5, 10, the development of the maximum F-statistic for each
individual linkage group during the cofactor analysis 13, 14, 17, 19, 21B, 26, and X/Yps. These include five of the six chromosomes with significant QTL (excluding process.
Comparison of two-QTL vs. one-QTL models pro- BTA6), two of the three chromosomes with significant TDT results (BTA5 and 10;Herna´ndez-Sa´nchezet al. vided no support for additional QTL on any linkage
group where genome-wide significant and suggestive 2002), and three others. Significant segregation distor-tion within unaffected individuals was found on BTA1, QTL were found using cofactor analysis.
Test for segregation distortion on chromosomes with 10, 13, 14, 17, 19, 21B, and X/Yps for one or more families. These include the same five chromosomes with significant QTL :The TDT analysis of
Herna´ndez-Sa´n-chezet al.(2002) found associations between BSE infec- significant QTL as seen for the affected individuals, one of the three chromosomes detected using TDT tion and loci on chromosomes 5, 10, and 20 (see below).
DISCUSSION
In this study, a genome-wide linkage analysis of QTL involved in susceptibility or resistance to BSE was con-ducted in a population of cattle consisting of four half-sib families. The QTL analysis, in which five cofactors were considered, identified four genome-wide “sugges-tive” and two genome-wide significant QTL. There was evidence for significant segregation distortion of sire alleles on five of the six chromosomes with QTL, but also on other chromosomes. The most consistent picture between the QTL and segregation distortion analyses was seen on BTA19 and X/Yps, where segregation
distor-Figure 2.—Development of theF-statistics for 32 linkage tion was in opposite directions in the affected and unaf-groups during cofactor analysis of the first round (no cofac- fected offspring of a family with a significant QTL. The tor), the second round (seven cofactors), the sixth round (six
positions of the QTL and the maximum level of segrega-cofactors), and the final seventh round (five cofactors). The
tion distortion overlapped for BTAX/Yps. different symbols indicate the maximum F-statistic for the
linkage group during the process of fitting cofactors and re- Candidate genes:Although variation in the PrP gene
analyzing the data. has been associated with differences in susceptibility or
incubation period of TSEs in other species, up to now polymorphisms in the bovine PrP gene have not been associated with variation in susceptibility to BSE. One individuals). The direction of the segregation distortion suggestive QTL in this study was identified on BTA13, (i.e., which allele is overrepresented) was different for which harbors the prion gene (PRNP). However, the the affected and unaffected offspring in a few cases. 95% C.I. for the QTL identified on BTA13 does not This pattern was seen for family 3 on BTA1, 19, and X, include the region wherePRNPhas been mapped (be-but not for the six other family/chromosome combina- tween markers HUJ616 and ABS10; Schla¨pfer et al. tions where there was significant segregation distortion 2000); the distance between that QTL andPRNPis at for both affected and unaffected offspring. least 74 cM. Because of inconsistencies between our For the chromosomes where linkage analysis identi- map order and that of the IBRP map for BTA13, linkage fied QTL, the maximumt-statistics for segregation dis- analysis was also run using the subset of markers found tortion in affected offspring within individual families on the IBRP map and the IBRP positions for this chro-and their positions are shown in Table 4. When the mosome (results not shown). There was still a suggestive position of the maximum t-statistic is compared with QTL and its position was again distant fromPRNP. that of the maximum F-statistic on the same linkage In mice, polymorphisms in PRNP are known to be group, there is substantial overlap in some cases but associated with variation in incidence or onset of dis-not others. The greatest overlap int-statistic andF-ratio ease. It is therefore interesting that in a QTL study in positions is for the pseudoautosomal X chromosome a mouse model of BSE infection, Manolakou et al. where the maximum statistics were physically close for (2001) also failed to detect any effect closely linked to PRNP, although a QTL was found on mouse chromo-both families 2 and 3.
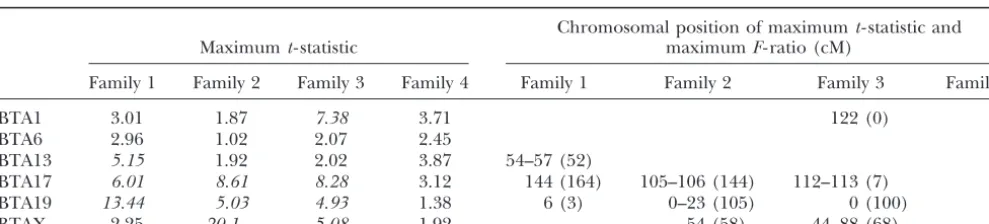
TABLE 4
The maximumt-statistics for segregation distortion within affected offspring for
linkage groups where putative QTL were detected
Chromosomal position of maximumt- statistic and
Maximumt- statistic maximumF- ratio (cM)
Family 1 Family 2 Family 3 Family 4 Family 1 Family 2 Family 3 Family 4
BTA1 3.01 1.87 7.38 3.71 122 (0)
BTA6 2.96 1.02 2.07 2.45
BTA13 5.15 1.92 2.02 3.87 54–57 (52)
BTA17 6.01 8.61 8.28 3.12 144 (164) 105–106 (144) 112–113 (7)
BTA19 13.44 5.03 4.93 1.38 6 (3) 0–23 (105) 0 (100)
BTAX 2.25 20.1 5.08 1.92 54 (58) 44–88 (68)
some 2 wherePRNPis located. This could suggest that sire) or because their inclusion biased the estimation of segregation ratios in the absence of maternal genotypes in both cattle and mice there is another locus on the
(i.e., daughters with homozygous genotypes). Further-same chromosome asPRNPthat is involved in BSE
re-more, sires homozygous for a marker were also excluded sistance or susceptibility or, alternatively, that in both
from the analysis. Using a very stringent significance studies, shortcomings in the analyses misplace the QTL
threshold, Herna´ndez-Sa´nchez et al. (2002) found regions.
three significant markers associated with BSE on chro-Four previous studies that mapped QTL related to
mosomes BTA5, 10, and 20. Surprisingly, none of these the incubation period of TSE diseases in mouse models
three regions are in common with genome-wide sugges-revealed significant or suggestive evidence for QTL on
tive or significant QTL found in this study, although mouse chromosomes 2, 4–12, 15, and 17–19 (
Stephen-significant segregation distortion within affected
indi-son et al. 2000; Lloyd et al. 2001; Manolakou et al.
viduals was found on two of these chromosomes. When 2001; Moreno et al. 2003). Chromosomes 2 and 11
markers closely linked to the three significant associa-showed significant evidence of a QTL in two of the
tions were tested, only one, on BTA5, showed a signifi-studies. Other chromosomal regions were supported for
cant association with disease status under TDT. None association with TSE susceptibility either by significant
of the markers identified using TDT showed the reverse evidence in only one study or by suggestive evidence in
pattern of allele transmission in the unaffected animals. more than one study. Regions of the bovine genome
A number of factors could contribute to differences in showing conservation of synteny with the mouse
chro-the results between linkage and TDT analyses. Although mosomes were deduced via Mouse Genome Informatics
the initial data set was the same, the samples used in (http://www.informatics.jax.org/). Several of the
chro-the two analyses differed. The TDT analyzes individual mosomes containing regions where QTL were located
loci separately and requires the sire to be heterozygous in this study (BTA1, 6, 13, 17, 19, and X/Yps) showed
for the marker locus tested. In addition, the absence homology with mouse chromosomes with putative QTL.
of maternal genotypes meant that the paternal allele Due to the lack of resolution of the bovine map,
how-inherited for a particular locus could not be determined ever, it was difficult to align regions where the cattle
for many of the progeny from heterozygous sires and QTL were located relative to the mouse map. A putative
so these also could not be used in the TDT. As a conse-candidate gene,Nf1, falls within the 95% C.I. of a
ge-quence, the data set used byHerna´ndez-Sa´nchezet al. nome-wide suggestive QTL on BTA19 in the current
(2002) for any particular locus included approximately study and also falls within a QTL region on mouse
chro-half the data that was used in the linkage analysis. This mosome 11 described in two independent studies (
Ste-would have reduced the statistical power of the TDT
phenson et al.2000; Lloydet al. 2001). Neurological
study (CardonandBell2001). To test whether differ-and behavioral defects have been described inNf1
ho-ences in results arose from different data sets used in mozygous mutant mice (Costaet al.2001), suggesting
each study, the same restrictions on genotypic data used that NF1 could play a role in the neurodegenerative
in the TDT analysis were applied to BTA5, 10, and 20, process of BSE.
where significant associations were previously identified Although none of the above-mentioned mouse
stud-by TDT (however, in this case, both affected and unaf-ies identified QTL on the sex chromosomes, a sex effect fected individuals were included in the analysis). These on incubation period and survival time was noted by data were then analyzed using linkage methods. Results
Manolakou et al. (2001) and Moreno et al. (2003), using the restricted data set still failed to find significant respectively.Manolakouet al.(2001) were able to dis- effects above the 5% chromosome-wide threshold al-sect maternal effects from those due to the X chromo- though the maximumF-statistics on BTA5 and BTA10 some in the F1generation and concluded that some of moved closer to markers BM315 and INRA107, which the sex differences seen in that population could be showed the greatest association under the TDT (results explained by X chromosome differences. The magni- not shown).
It is known that TDT is more powerful than linkage if the potential advantages of using different methods to explore the data and the need for independent verifica-there is strong LD in the sample and the marker map
is dense (Risch and Merikangas 1996). Therefore, tion of results.
linkage may have had insufficient power to detect the We thank the Biotechnology and Biological Sciences Research regions detected by TDT for the markers that were Council for additional funding, D. Matthews and J. Wilesmith for assistance in obtaining samples, and I. Maclean and D. Pomp
(Gene-physically close to the genes affecting the trait.
Con-Seek) for technical assistance in genotyping. Data for this work were
versely, over larger genomic distances (and thus higher
collected through funding from the U.K. Department for
Environ-recombination rates), the linkage approach may be ment, Food and Rural Affairs (DEFRA, project SE 1744) and the more successful than TDT (Kolbehdari and Jansen European Commission (project CT97 3311).
2003).
It is likely that population-wide distortion in marker alleles caused by factors other than BSE is present in
LITERATURE CITED cattle populations that are subjected to intensive
breed-Almond, G., andJ. Pattison, 1997 Human BSE. Nature389:437–
ing selection. This distortion could be detected by TDT,
438.
giving misleading results. This is consistent with the fact Baron, T., 2002 Mouse models of prion disease transmission. Trends that TDT found no significant effects when comparing Mol. Med.8:495–500.
Bruce, M., A. Chree, I. McConnell, J. Foster, G. Pearsonet al.,
casesvs.controls by testing interactions in the
transmis-1994 Transmission of bovine spongiform encephalopathy and
sion of alleles (Herna´ndez-Sa´nchezet al.2002) while scrapie to mice: strain variation and the species barrier. Philos. one would have expected different alleles to be overrep- Trans. R. Soc. Lond. B Biol. Sci.343:405–411.
Cardon, L. R., andJ. I. Bell, 2001 Association study designs for
resented in the affected and unaffected classes. A similar
complex diseases. Nat. Rev. Genet.2:91–99.
pattern was seen in our survey of segregation distortion Churchill, G. A., and R. W. Doerge, 1994 Empirical threshold across the genome, although there were a few cases values for quantitative trait mapping. Genetics138:963–971.
Collinge, J., K. C. L. Sidle, J. Meads, J. IronsideandA. F. Hill,
where the direction of the distortion differed for the
1996a Molecular analysis of prion strain variation and the
aetiol-affected and the unaetiol-affected classes. On the other hand, ogy of ‘new variant’ CJD. Nature383:685–690.
the linkage profiles using the same reduced data set Collinge, J., J. Beck, T. Campbell, K. EstibeiroandR. G. Will, 1996b Prion protein gene analysis in new variant cases of
Creutz-as used for TDT (Creutz-as mentioned above) reached their
feldt-Jakob disease. Lancet348:56.
maximum at the positions where TDT found significant Costa, R. M., T. Yang, D. P. Huynh, S. M. Pulst, D. H. Viskochilet effects, although the results from the linkage analysis al., 2001 Learning deficits, but normal development and tumor
predisposition, in mice lacking exon 23a of Nf1. Nat. Genet.27: did not exceed the threshold values.
Herna´ndez-Sa´n-399–405.
chezet al. (2002) noted that TDT could not be used
de Koning, D. J., L. L. Janss, A. P. Rattink, P. A. van Oers, B. J.
to test the X/Ypschromosome because of the real segre- de Vries et al., 1999 Detection of quantitative trait loci for backfat thickness and intramuscular fat content in pigs (Sus
gation distortion of this region caused by linkage to X
scrofa). Genetics152:1679–1690.
combined with the fact that all samples were from
fe-de Koning, D. J., N. F. Schulman, K. Elo, S. Moisio, R. Kinoset
males (i.e., it is expected that alleles from the sire’s X al., 2001 Mapping of multiple quantitative trait loci by simple chromosome-linked pseudoautosomal segment will be regression in half-sib designs. J. Anim. Sci.79:616–622.
Donnelly, C. A., N. M. Ferguson, A. C. Ghani, J. W. Wilesmith
overrepresented in his daughters relative to alleles from
andR. M. Anderson, 1997 Analysis of dam-calf pairs of BSE
his Y chromosome-linked pseudoautosomal segment). cases: confirmation of a maternal risk enhancement. Proc. R. Our preliminary exploration indicated that linkage Soc. Lond. B Biol. Sci.264:1647–1656.
Falconer,D. S., andT. F. C. Mackay, 1996 Introduction to
Quantita-analysis is robust to segregation distortion of this kind
tive Genetics, Ed. 4. Addison-Wesley Longman, Harlow, UK.
(see supplement 2 at http://www.genetics.org/supple Ferguson, N. M., C. A. Donnelly, M. E. J. WoolhouseandR. M.
mental/). Anderson, 1997 A genetic interpretation of heightened risk of
BSE in offspring of affected dams. Proc. R. Soc. Lond. B Biol.
In summary, both analyses may have detected actual
Sci.264:1445–1455.
effects and thus provide complementary evidence for Georges, M., D. Nielsen, M. Mackinnon, A. Mishra, R. Okimoto loci involved in susceptibility or resistance. The fact that et al., 1995 Mapping quantitative trait loci controlling milk pro-duction in dairy cattle by exploiting progeny testing. Genetics
QTL and cofactors identified in the linkage analysis
139:907–920.
explained only a quarter of the variation allows for the Green, P., K. FallsandS. Crooks, 1990 Cri-map, Version 2.4. possibility that other regions, such as those previously Washington University School of Medicine, St. Louis.
Herna´ndez-Sa´nchez, J., D. Waddington, P. Wiener, C. S. Haley
identified byHerna´ndez-Sa´nchezet al.(2002), could
andJ. L. Williams, 2002 Genome-wide search for markers
asso-also be important. Additional work to explore the
re-ciated with bovine spongiform encephalopathy. Mamm. Genome
gions identified by this and the previous study will be 13:164–168.
Hills, D., J. Schlaepfer, S. Comincini, I. Maclean, G. Dolfet al.,
required to confirm these results.
2003 Sequence variation in the bovine and ovine PRNP genes.
Conclusions: Six putative QTL, two genome-wide
sig-Anim. Genet.34:183–190.
nificant and four genome-wide suggestive QTL, were Hunter, N., 1999 Molecular biology and genetics of bovine
spongi-form encephalopathy, pp. 229–246 inThe Genetics of Cattle, edited
found associated with BSE incidence using linkage
analy-by R.Friesand A.Ruvinsky. CAB International, Wallingford,
sis. Lack of correspondence with previous results obtained
UK.
using a TDT approach highlights differences between Kadarmideen, H., L. G. JanssandJ. C. M. Dekkers, 2000 Power
of quantitative trait locus mapping for polygenic binary traits
using generalized and regression interval mapping in multi-family mozygous prion protein genotype predisposes to sporadic Crentz-feldt-Jakob disease. Nature352:340–342.
half-sib designs. Genet. Res.76:305–317.
Knott, S. A., J. M. ElsenandC. S. Haley, 1996 Methods for multi- Patterson, W. J., andM. J. Painter, 1999 Bovine spongiform en-cephalopathy and new variant Creutzfeldt-Jakob disease: an over-ple-marker mapping of quantitative trait loci in half-sib
popula-tions. Theor. Appl. Genet.93:71–80. view. Commun. Dis. Public Health2:5–13.
Risch, N., andK. Merikangas, 1996 The future of genetic studies
Knott, S. A., L. Marklund, C. S. Haley, K. Andersson, W. Davies
et al., 1998 Multiple marker mapping of quantitative trait loci of complex human diseases. Science273:1516–1517.
Schla¨pfer, J., N. Stahlberger-Saitbekova, J. KufferandG. Dolf, in a cross between outbred wild boar and Large White pigs.
Genetics149:1069–1080. 2000 Genetic mapping of the prion protein gene (PRNP) on bovine chromosome 13. J. Anim. Breed. Genet.117:211–216.
Kolbehdari, D., andG. B. Jansen, 2003 Simulation of transmission
disequilibrium tests for QTL detection in outbred livestock popu- Seaton, G., C. S. Haley, S. A. Knott, M. KearseyandP. M. Visscher, 2002 QTL Express: user-friendly software to map quantitative lations. Book of Abstracts of the 54th Annual Meeting of the
European Association for Animal Production, 31 August–2 Sep- trait loci in outbred populations. Bioinformatics18:339–340.
Stephenson, D. A., K. Chiotti, C. Ebeling, D. Groth, S. J.
DeAr-tember, Rome.
Lander, E. S., andL. Kruglyak, 1995 Genetic dissection of complex mondet al., 2000 Quantitative trait loci affecting prion incuba-tion time in mice. Genomics69:47–53.
traits: guidelines for interpreting and reporting linkage results.
Nat. Genet.11:241–247. Visscher, P. M., C. S. Haley andS. A. Knott, 1996a Mapping QTLs for binary traits in backcross and F2 populations. Genet.
Lloyd, S. E., O. N. Onwuazor, J. A. Beck, G. Mallinson, M. Farrall
et al., 2001 Identification of multiple quantitative trait loci Res.68:55–63.
Visscher, P. M., R. ThompsonandC. S. Haley, 1996b Confidence linked to prion disease incubation period in mice. Proc. Natl.
Acad. Sci. USA98:6279–6283. intervals in QTL mapping by bootstrapping. Genetics143:1013– 1020.
Lynch, M., andB. Walsh, 1998 Genetics and Analysis of Quantitative
Traits. Sinauer Associates, Sunderland, MA. Weller, J. I., Y. KashiandM. Soller, 1990 Power of daughter and granddaughter designs for determining linkage between marker
Manolakou, K., J. Beaton, I. McConnell, C. Farquar, J. Manson
et al., 2001 Genetic and environmental factors modify bovine loci and quantitative trait loci in dairy cattle. J. Dairy Sci.73:
2525–2537. spongiform encephalopathy incubation period in mice. Proc.
Natl. Acad. Sci. USA98:7402–7407. Wells, G. A. H., A. C. Scott, C. T. Johnson, R. F. Gunning, R. D. Moreno, C. R., F. Lantier, I. Lantier, P. SarradinandJ.-M. Elsen, Hancocket al., 1987 A novel progressive spongiform
encepha-2003 Detection of new quantitative trait loci for susceptibility lopathy in cattle. Vet. Rec.121:419–420.
to transmissible spongiform encephalopathies in mice. Genetics Wilesmith, J. W., G. A. H. Wells, J. Ryan, D. Gravier-WidenandM.
165:2085–2091. Simmons, 1997 A cohort study to examine maternally-associated
Neibergs, H. L., A. M. Ryan, J. E. Womack, R. L. SpoonerandJ. L. risk factors for bovine spongiform encephalopathy. Vet. Rec.141:
Williams, 1994 Polymorphism analysis of the prion gene in 239–243.
BSE-affected and unaffected cattle. Anim. Genet.25:313–317. Xu, S., andW. R. Atchley, 1996 Mapping quantitative trait loci
Neimann-Sorensen, A., andA. Robertson, 1961 The association for complex binary diseases using line crosses. Genetics 143:
between blood groups and several production characteristics in 1417–1424. three Danish cattle breeds. Acta Agric. Scand.11:163–196.