Copyright2004 by the Genetics Society of America DOI: 10.1534/genetics.104.028381
Comparative Mapping in the Pinaceae
Konstantin V. Krutovsky,* Michela Troggio,
†Garth R. Brown,
‡Kathleen D. Jermstad
§and David B. Neale,*
,‡,1*Institute of Forest Genetics, Pacific Southwest Research Station, U.S. Department of Agriculture Forest Service, Davis, California 95616, †Dipartimento di Scienze Ambientali, Universita’ di Parma, 43100 Parma, Italy,‡Department of Environmental Horticulture,
University of California, Davis, California 95616 and§Institute of Forest Genetics, Pacific Southwest Research Station, U.S. Department of Agriculture Forest Service, Placerville, California 95667
Manuscript received March 4, 2004 Accepted for publication May 27, 2004
ABSTRACT
A comparative genetic map was constructed between two important genera of the family Pinaceae. Ten
homologous linkage groups in loblolly pine (Pinus taedaL.) and Douglas fir (Pseudotsuga menziesii[Mirb.]
Franco) were identified using orthologous expressed sequence tag polymorphism (ESTP) and restriction fragment length polymorphism (RFLP) markers. The comparative mapping revealed extensive synteny and colinearity between genomes of the Pinaceae, consistent with the hypothesis of conservative chromosomal evolution in this important plant family. This study reports the first comparative map in forest trees at the family taxonomic level and establishes a framework for comparative genomics in Pinaceae.
T
HE essence of comparative genome analysis is the notably Brassicaceae (Paterson et al. 2000; Barnes 2002; Hall et al. 2002), Solanaceae (Doganlar et al. extrapolation of information from one organism toanother. Comparative mapping and comparative sequence 2002), Fabaceae (Boutin et al. 1995;Yan et al. 2003), and Poaceae (FeuilletandKeller2002;Laurieand analysis are the key components of comparative
geno-mics. Comparative mapping establishes the syntenic re- Devos2002;Wareet al. 2002;WareandStein2003). lationships between genomes of different species, assisting A comparative map framework among these taxa facili-in genetic map consolidation, verification of quantitative tates the transfer of information across species and en-trait loci (QTL), identification of candidate genes un- ables a taxonomic family to be viewed as a single genetic derlying QTL, and a better understanding of genome system (Freeling2001).
evolution (SankoffandNadeau2000;Kliebensteinet Pinaceae is the most important among eight families al.2001;Murphyet al.2001;Zhanget al.2001;Schmidt of the order Coniferales (conifers). This family com-2002). prises 11 genera and 232 species distributed throughout Comparative genome analysis is often performed be- the world (Frankis1989), primarily in the temperate tween model and nonmodel species (for reviews, see region of the northern hemisphere. Members of the Patersonet al.2000;Hallet al.2002;Schmidt2002). Pinaceae have large economic importance as a source of For example, thale cress (Arabidopsis thaliana) and rice timber, pulp, and resins. They also play a very significant (Oryza sativa) are model species for dicots and mono- ecological role by producing large biomass and creating cots, respectively. Putative syntenic regions have been habitat for many other organisms. Forest trees of the identified for dicots in comparisons between soybean Pinaceae are essential for carbon sequestration that may (Glycine max), barrel medic (Medicago truncatula), cab- affect global climate.
bage (Brassica oleracea), potato (Solanum tuberosum), and Pinaceae genomes are very large compared to nearly A. thaliana(Grantet al.2000;Babulaet al.2003;Geb- all other plant species and are unlikely to be completely hardtet al.2003;Lukenset al.2003;Zhuet al.2003). sequenced in the near future. Pinaceae DNA contents Similar comparisons have been done for monocots be- vary from 5.8 to 32.2 pg per haploid genome (1C) with tween sorghum (Sorghum bicolor), barley (Hordeum vul- 22 pg on average for 83 species studied (Murray1998; gare), wheat (Triticum aestivum), maize (Zea mays), and Leitch et al. 2001;Bennett andLeitch 2003). Pina-O. sativa (Klein et al. 2003; Ware and Stein 2003). ceae genomes are 6-fold larger than the human genome Comparative maps have been constructed among sev- (3.5 pg; Morton 1991) and 100-fold larger than that eral species within a few important families of plants, of A. thaliana(0.18 pg;BennettandSmith1991). In the absence of a genome sequence for a member of the Pinaceae, comparative mapping becomes even more 1Corresponding author:Institute of Forest Genetics, Pacific Southwest
important as the primary tool for integrating
informa-Research Station, USDA Forest Service, Department of Environmental
tion across species.
Horticulture, University of California, 1 Shields Ave., Davis, CA 95616.
E-mail: [email protected] Loblolly pine (Pinus taedaL., 2n ⫽ 2x⫽ 24) is the
most genetically studied conifer species and was chosen fir (Brownet al. 2001). Mutations in primer binding sites have made comparative mapping via a common set as the reference species for comparative mapping in
Pinaceae. Although still far from being a true model of PCR primers practically impossible between conifer genera. To overcome this problem a computational ap-species, loblolly pine has rich genetic resources,
well-developed genetic and QTL maps (Sewellet al.1999; proach was used to identify Douglas fir ESTs with high homology, and putative orthology, to ESTPs mapped in Brown et al. 2001, 2003; Temesgen et al. 2001), and
expressed sequence tag (EST) databases (Allonaet al. loblolly pine. A similar approach was used in recent comparative mapping studies between tomato, potato, 1998;Whettenet al. 2001;Kirstet al. 2003). Douglas
fir (Pseudotsuga menziesii[Mirb.] Franco, 2n⫽2x⫽26) and Arabidopsis (Fultonet al. 2002;Gebhardt et al. 2003). The selected Douglas fir ESTs were used to de-is the most important species of the genus Pseudotsuga
with well-studied genetic and QTL maps (Krutovskiiet sign Douglas fir-specific PCR primers to amplify loblolly pine orthologs in Douglas fir for subsequent genetic al. 1998;Jermstadet al. 1998, 2001a,b, 2003). Together,
they are the most commercially important forest tree mapping. This approach allowed comparative mapping to be extended to the family level and established a species in the United States, and a comparative map
between species would have significant practical value. It framework for comparative genomics in Pinaceae. This study is a part of the Conifer Comparative Genomics might also help to establish the origin of the thirteenth
chromosome pair in Douglas fir, the only species not Project (CCGP) formed as an international collabora-tion at the Institute of Forest Genetics (U.S. Department having 12 chromosome pairs in the Pinaceae.
Orthologous markers are essential for constructing of Agriculture Forest Service) to develop the ortholo-gous genetic markers and publicly available reference comparative maps.Fitch(1970, 2000) defined
ortholo-gous genes as homoloortholo-gous genes whose divergence fol- mapping populations that can be shared among dif-ferent laboratories to facilitate comparative mapping lows a speciation event, while paralogs are defined as
genes whose divergence follows a duplication event within (http://dendrome.ucdavis.edu/ccgp). a species. Orthologs are expected to have similar
func-tion, expression, amino acid and nucleotide sequence,
MATERIALS AND METHODS and genome location in closely related species (e.g.,
MirnyandGelfand2002). Two criteria, high sequence Mapping populations and reference maps:The loblolly pine and Douglas fir mapping populations were three-generation similarity and genome location, were used as evidence
outbred pedigrees consisting of four grandparents, two F1
for orthology in this study.
parents, and several hundred progeny (Jermstadet al. 1998,
Restriction fragment length polymorphism (RFLP), 2003; Sewellet al.1999). The loblolly pine reference map based on Southern hybridization with single-copy geno- was based on RFLP and ESTP markers as reported inSewell et al.(1999),Temesgenet al.(2001), andBrownet al. (2001). mic clones to ensure orthology, has been used broadly
This map is a consensus map between two pedigrees. Syntenic for comparative mapping in plants (Ahn et al. 1993;
relationships with other Pinus species were established pre-Shermanet al. 1995;GaleandDevos1998; Yanet al.
viously for most of the 12 linkage groups (Deveyet al.1999;
2003). Comparative mapping using single- or low-copy Brown et al. 2001; Chagne´et al. 2003; Komulainen et al. cDNA as hybridization probes has been also successful 2003). These groups included 302 markers (166 RFLP, 5 iso-zyme, and 131 EST markers), with a total map length of 1274 in the Brassicaceae (Lanet al.2000;Barnes2002;Babula
cM. The Douglas fir reference map was based on 376 markers et al.2003), Solanaceae (Doganlaret al.2002), Poaceae
[172 RFLP, 77 randomly amplified polymorphic DNA (RAPD), (Smildeet al. 2001;FeuilletandKeller2002;Laurie
and 2 isozyme markers (Jermstadet al. 1998) with 20 simple
andDevos2002), and across different families (Davis sequence repeat (SSR), 4 sequence-tagged site (STS), and 101 et al. 1999;Gebhardtet al.2003). However, RFLP meth- ESTP markers added in this study (see supplemental Table
S1 at http://www.genetics.org/supplemental/)]. ods have had limited application in conifers due to
Markers analyzed: Three types of markers were used to genome complexity and numerous multigene families
develop the loblolly pine and Douglas fir comparative map: (KinlawandNeale1997). Although comparative
map-(1) single- or low-copy RFLP markers developed from loblolly ping using RFLP markers has been successful in pine cDNA clones, (2) ESTP markers developed in several pine species (Deveyet al.1999), it is difficult to apply RFLPs and spruce (Picea) species that amplified a single locus in previous studies, and (3) ESTP and STS markers developed across different genera in conifers. Many loblolly pine
in Douglas fir. RFLP markers were mapped and sequenced probes produced a complex multiband pattern in
hy-previously in both species (Jermstadet al. 1998;Sewell et
bridization with Douglas fir genomic DNA (Jermstad
al. 1999). ESTP markers developed in pines and spruces were et al. 1994, 1998). PCR-amplified EST polymorphisms mapped in both species also according to methods described (ESTPs) have emerged recently as an alternative to RFLP inBrownet al. (2001). ESTP and STS markers from Douglas fir are described in detail below. Briefly, EST and STS se-markers for comparative mapping (Brownet al. 2001).
quences were selected initially for evaluation as putative homo-A set of orthologous ESTP markers developed in loblolly
logs to mapped loblolly pine markers on the basis of sequence pine has been established and successfully used in
449 Comparative Mapping in the Pinaceae
Douglas fir markers in loblolly pine. However, the orthologous by thePHREDprogram (EwingandGreen1998;Ewinget
al.1998), assembled using thePHRAPprogram, and viewed
relationships of these loci in both species were assessed by
se-quence similarity of amplified fragments and their conserved throughCONSED(Gordonet al.1998, 2001).
Linkage analysis:Genotypic data were scored visually and mapped location.
Douglas fir EST and STS markers:A cDNA library was ob- tested for Mendelian segregation. Markers showing only slight
segregation distortion (0.01⬍P⬍0.05) were not excluded
tained from 1-month-old Douglas fir seedlings in collaboration
with Integrated Genomics (Chicago). Total RNA was extracted from linkage analysis because recombination estimators are
still valid when distortion is observed at only one locus of a fromⵑ5 g of ground tissue following the protocol ofChang
et al. (1993). Double-stranded cDNA was prepared using the linked pair of loci (Bailey1961; Ott1991). ESTP markers
were added to the existing segregation data (Jermstadet al.
Universal RiboClone cDNA Synthesis System (Promega,
Madi-son, WI), filtered through a Sephacryl S-400 column, ligated 1998) and the linkage analysis was repeated. A sex-averaged
consensus map was produced using JOINMAP versions 1.4
into theEcoICR I-cut dephosphorylated pGEM-3Z sequencing
vector, and electroporated intoEscherichia coliDH5␣. A total and 2.0 (Stam1993; StamandVan Ooijen1995). Linkage
groups were assigned at the LOD thresholds of 4 and 5. Group-of 5031 EST sequences were obtained and assembled into
contigs. These ESTs and contigs and four Douglas fir STSs ing was almost identical at both thresholds, except a few loci
unmapped at LOD⫽5 and a spurious merging of two
appar-available from GenBank were used to query the December
2002 assembly of loblolly pine ESTs, which is accessible at ently independent linkage groups at LOD⫽4. Therefore, we
used mainly LOD⫽4 for grouping, except two linkage groups
http://pine.ccgb.umn.edu, using BLASTn and tBLASTx. The
assembly contained 20,456 contigs and singletons derived that were assembled at LOD⫽5. The procedure for ordering
markers was the same as described inJermstadet al.(1998).
from 59,430 sequences from six xylem libraries. Douglas fir
sequences homologous to mapped loblolly pine loci were se- The Kosambi function was used to estimate map distances.
Nomenclature and informatics:Mapped loci were named ac-lected for further study, if they showed nucleotide similarity
⬎80% and expected values ofⱕE-15 over a minimum of 100 bp. cording to guidelines for submitting data to the TreeGenes
data-base (http://dendrome.ucdavis.edu/Tree_Page.htm). A mapped
PCR and detection of polymorphisms:PCR primers were
designed using the Douglas fir EST and STS sequences homol- marker is defined by its experiment, source, accession number,
and locus identifier fields. For example, an ESTP derived from ogous to mapped loblolly pine loci. Primers were designed
using the computer program GeneRunner v3.04 (Hastings the loblolly pine cDNA clone PtIFG_8732 and mapped in both
loblolly pine and Douglas fir in this study is referenced as Software, Hudson, NY) to yield products of 300–500 bp. A
IFGREF_estPtIFG_8732_a and IFGLXD_estPtIFG_8732_a in the
typical reaction volume was 25l and included 10 mm
TRIS-loblolly pine and Douglas fir maps, respectively. For brevity,
HCl pH 8.3, 50 mmKCl, 1.5 mmMgCl2, 200mof each dNTP,
however, experiment fields have been omitted (Figure 1).
1mof each primer, 12 ng of DNA template, and 0.5 units
of HotStartTaqDNA Polymerase from QIAGEN (Valencia,
CA). Following HotStartTaqactivation (94⬚for 15 min), PCR
amplification involved denaturation at 94⬚for 1 min, anneal- RESULTS
ing for 0.5 min, and extension for 2 min. The annealing
Orthologous RFLP and ESTP markers derived from
temperature during the initial cycles was lowered fromXto
Yby 1⬚every second cycle. Standard PCR conditions (X⫽65⬚ pine and spruce species:Twenty-six RFLP markers were
andY ⫽60⬚ or 55⬚) were used for most ESTP markers, al- mapped in both loblolly pine and Douglas fir (Jermstad
though for primer pairs that failed to amplify, the stringency et al. 1998;Sewellet al.1999). Seven markers met criteria
was reduced (X⫽60⬚andY⫽50⬚). An additional 30 cycles
of orthologous markers. Four markers (PtIFG_2006_a, of amplification were performed upon reaching the final
an-PtIFG_2356_a, PtIFG_2988_a, and PtIFG_2540_a)
re-nealing temperature (Y) followed by a final extension at 72⬚
for 10 min. Amplification products from the parents of the vealed more than a single locus, but were mapped into
Douglas fir pedigree were screened for polymorphism in 2% syntenic regions and can be also conditionally
consid-agarose gels and by denaturing gradient gel electrophoresis ered as orthologous markers.
(DGGE) using a 15–45% denaturing gradient and a DCode
The ESTP primer pairs developed from pine and
apparatus (Bio-Rad, Hercules, CA) according toTemesgenet
spruce species amplified Douglas fir templates with vari-al. (2000). Finally, ESTP segregation data were collected for
able success, ranging from 24% amplification success the 94 progeny of the Douglas fir pedigree.
DNA sequencing:To support the possibility that PCR mark- with primers derived from loblolly pine to 93% success
ers amplified in Douglas fir were orthologs to the mapped with primers derived from Norway spruce, Picea abies
loblolly pine markers, amplifications products were directly
(L.) Karst. (Table 1). In total, 55 ESTPs from the four sequenced and compared to the original Douglas fir and
lob-species were mapped in Douglas fir, but only 11 markers lolly pine sequences. To use direct sequencing without cloning
met the criteria of orthologous markers. 33 markers were selected that amplified a single locus and
had no amplification background, such as light additional Orthologous ESTP and STS markers derived from
bands that may interfere with sequencing. The selected mark- Douglas fir: Of 5031 ESTs analyzed, 1992 sequences
ers represented 26 putative orthologous markers (5 loblolly were assembled into 621 contigs. There were an
addi-pine-based ESTP, 18 Douglas fir-based ESTP, and 3 STS
mark-tional 55 singletons and 2984 singlets. All ESTs and ers) and 7 nonorthologous Douglas fir-based ESTP markers.
contigs were compared to the genetically mapped lob-Four alleles at each locus were sequenced using DNA extracted
from the haploid megagametophyte tissue of four Douglas fir lolly pine ESTs, and Douglas fir sequences with⬎80%
seeds. DNA sequences were obtained from both strands with nucleotide identity were used for PCR primer design.
the primers used for PCR amplification and the ABI PRISM Most primers (97%) designed in this manner amplified
BigDye Primer Cycle Sequencing Kit v.3.1 (Applied
Biosys-a single DouglBiosys-as fir product of expected size, Biosys-and 39 tems, Foster City, CA). Fragments were detected on an ABI
markers were mapped. Twenty-one of the 39 markers 3730 DNA Analyzer at the Genomics Facility Center at the
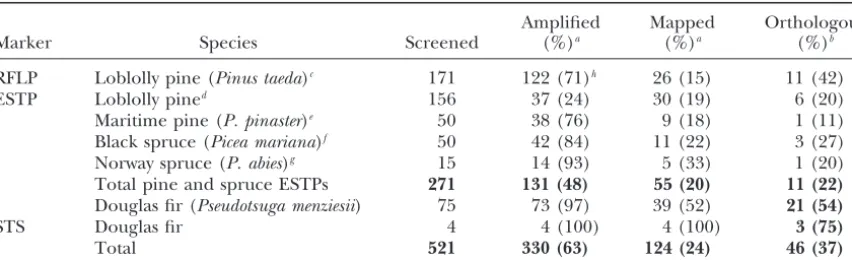
TABLE 1
RFLP, ESTP, and STS markers screened in Douglas fir
Amplified Mapped Orthologous
Marker Species Screened (%)a (%)a (%)b
RFLP Loblolly pine (Pinus taeda)c 171 122 (71)h 26 (15) 11 (42)
ESTP Loblolly pined 156 37 (24) 30 (19) 6 (20)
Maritime pine (P. pinaster)e 50 38 (76) 9 (18) 1 (11)
Black spruce (Picea mariana)f 50 42 (84) 11 (22) 3 (27)
Norway spruce (P. abies)g 15 14 (93) 5 (33) 1 (20)
Total pine and spruce ESTPs 271 131 (48) 55 (20) 11 (22)
Douglas fir (Pseudotsuga menziesii) 75 73 (97) 39 (52) 21 (54)
STS Douglas fir 4 4 (100) 4 (100) 3 (75)
Total 521 330 (63) 124 (24) 46 (37)
aPercentage of amplified markers out of total number of markers screened.
bPercentage of orthologous markers out of mapped markers.
cDeveyet al.(1991, 1994);Jermstadet al.(1994); http://dendrome.ucdavis.edu/treegenes.html.
dBrownet al. (2001);Temesgenet al.(2001); http://dendrome.ucdavis.edu/Gen_res.htm.
eChagne´et al.(2003); http://www.pierroton.inra.fr/genetics/pinus/primers.html.
fPerryandBousquet(1998a,b).
gSchubertet al.(2001).
hNumber and percentage of the loblolly pine cDNA probes that cross-hybridized to the Douglas fir genomic
DNAs (Jermstadet al.1994).
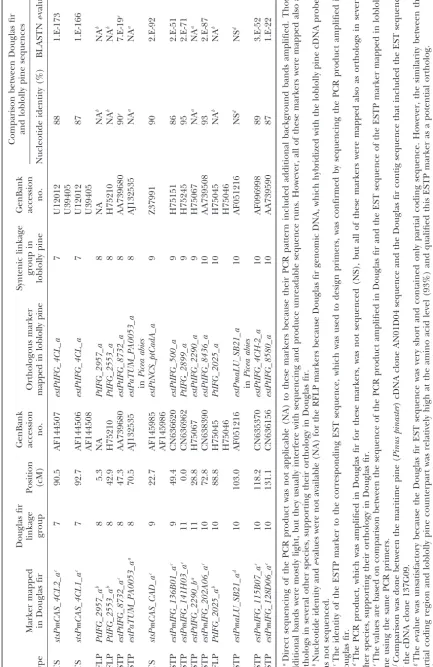
Three Douglas fir genomic sequences available from The identity between Douglas fir and loblolly pine se-quences was 89⫾4% for 26 orthologous and 83⫾2% for GenBank had orthologs among mapped loblolly pine
ESTs. They were mapped and met the criteria of or- 7 nonorthologous markers on average (t-testP⫽0.012). Orthologous markers and homologous linkage groups: thologous markers (Table 1).
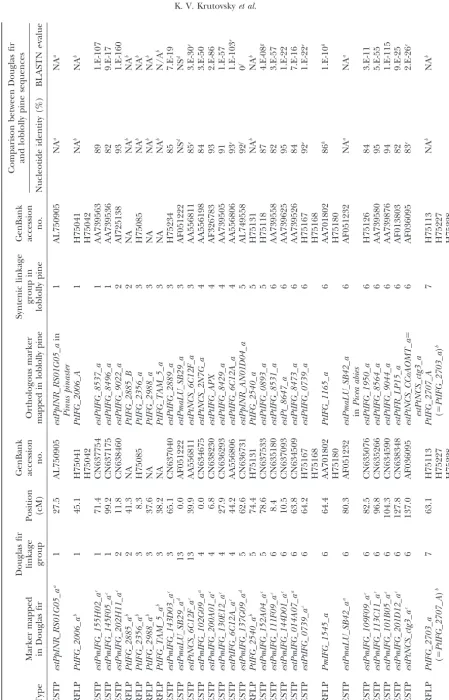
Douglas fir linkage map: In total, 376 markers (172 Comparison of Douglas fir and loblolly pine maps
re-vealed 10 linkage groups (LG1–LG10) in loblolly pine RFLPs, 77 RAPDs, 20 SSRs, 2 isozymes, 4 STSs, and 101
ESTPs) were mapped to 22 linkage groups consisting that shared 2–10 orthologous markers with 12 appar-ently syntenic linkage groups in Douglas fir based on of 3 or more markers (Table 1). There were 17 major
linkage groups that consisted of 5 or more markers 46 orthologous markers (Table 2, Figure 1). Primer sequences and PCR conditions that were used to amplify (Figure 1). The total length of the linkage map was
1664 cM for the 17 major linkage groups and 1859 cM orthologous markers are presented in the supplemental Table S2, and their homology analysis and annotation for all 22 linkage groups.
Sequence of PCR-amplified ESTP and STS markers: in the supplemental Table S3 (see http://www.genetics.
org/supplemental/). Markers mapped in pine species PCR products for 26 putative orthologs (5 ESTPs
ampli-fied using primers based on loblolly pine ESTs, 18 ESTPs other than loblolly helped to strengthen the compara-tive mapping. For example, the estPpINR_RS01G05_a amplified using primers based on Douglas fir ESTs, and
3 STSs) and 7 nonorthologs, which were amplified and marker was mapped in maritime pine (P. pinaster Ait; Chagne´et al.2003) and in Douglas fir, but not in lob-mapped in Douglas fir, were sequenced and compared
to the original Douglas fir and loblolly pine EST or lolly pine. However, in both species this marker was mapped in the linkage group that was homologous to genomic sequences. All sequences confirmed the
iden-tity and origin of amplified markers. The orthology of the same LG1 in loblolly pine based on other ortholo-gous markers and therefore corroborated syntenic rela-all 26 putative orthologs, from which PCR amplification
products were sequenced, was also confirmed (Table 2). tionships between these groups (Table 2; Figure 1).
䉴
Figure 1.—Genetic maps of loblolly pine (Pinus taeda L.), Pt, and Douglas fir (Pseudotsuga menziesii [Mirb.] Franco), Pm.
Orthologous markers are highlighted by larger, boldface, italicized, and underlined type and are connected by lines, except four of them that were mapped in pine species other than loblolly, but in the same syntenic linkage group (LG)
[estPpINR_RS01G05_awas mapped in LG1 inPinus pinaster(Chagne´et al.2003), andestPmaLU_SB42_a, estPaTUM_PA0053_a,
and estPmaLU_SB21_a were mapped in LG6, LG8, and LG10 in Picea abies, respectively (our unpublished data)]. The loci were named following guidelines for the TreeGenes genome database (http://dendrome.ucdavis.edu/Tree_Page.htm; see also materials and methods). Abbreviations placed after the underscore in some loblolly pine marker names show other conifer species and syntenic linkage groups in which these markers were also mapped. For instance, Pe1 in the PtIFG_2006_A/Pe1
marker name in the linkage groupPt-1 means that the PtIFG_2006_A marker was also mapped in the Pinus elliottii syntenic
Figure
1.
—
Continued
453 Comparative Mapping in the Pinaceae
Figure
1.
—
Continued
Figure
1.
—
Continued
Figure
1.
—
Continued
457 Comparative Mapping in the Pinaceae
Similarly, theestPmaLU_SB42_amarker was mapped in fore have revealed paralogs or different members of multigene families. This can be easily expected due to Norway spruce (our unpublished data) and Douglas fir,
but not in loblolly pine. The linkage group containing the complexity of conifer genomes (KinlawandNeale 1997). This is also supported by lower levels of identity this marker in both Norway spruce and Douglas fir was
homologous to LG6 in loblolly pine based on other observed between Douglas fir and loblolly pine sequences for nonorthologous (83%)vs.orthologous (89%) mark-markers (Table 2; Figure 1). The total lengths of the
syntenic linkage groups that shared orthologous mark- ers. There were a few ESTP primers that amplified two products that were mapped in the same region, showing ers were 1125 cM for 10 groups in loblolly pine and
1421 cM for 12 groups in Douglas fir. that tandem duplication might be common in Pinaceae genome evolution. Paralogs complicate construction of Seven of 12 linkage groups in Douglas fir had three
or more orthologous markers that allow inspection of comparative maps in Pinaceae, but are also of great interest for studying evolution of multigene families. colinearity. Gene order was completely colinear in the
syntenic regions of 5 of these 7 groups (LG1, LG3, LG4, Pseudotsuga and Larix are the next closest genera to Pinus after Picea on the basis of phylogenetic studies LG5, and LG8) and partly colinear in LG6 (Figure 1).
Local noncolinearity was observed only in two groups, (Wang et al. 2000; Rydin et al. 2002). However, the karyotype of Douglas fir is unique in Pinaceae. It has LG6 and LG10 (Figure 1). There were two cases when
two linkage groups in Douglas fir showed synteny with a 13 chromosome pairs (2n⫽26), while all other species, including closely related Pseudotsuga and Larix species, single linkage group in loblolly pine: (1)Pm-3andPm-13
vs.Pt-3(LG3) and (2)Pm-9andPm-11 vs.Pt-9(LG9). have only 12 pairs (2n⫽24). The karyotype of Douglas fir includes 2 telocentric chromosomes that are strik-ingly dissimilar to the other 11 chromosomes (5 meta-DISCUSSION
centric and 6 submetacentric chromosomes). Their length is also less than one-half that of the metacentric
chromo-Comparative mapping in Pinaceae:The macrosyntenic
relationships between species of two genera of the family somes (Doerksen and Ching 1972), suggesting that these two chromosomes originated by centromeric fis-Pinaceae were established for nearly all major linkage
groups. Ten homologous linkage groups were identified sion of one of the metacentric chromosomes. We could not resolve unambiguously the question of the origin in loblolly pine that shared two or more orthologous
markers with Douglas fir linkage groups (Figure 1). The of the thirteenth chromosome pair in Douglas fir, but our data allow some speculation. Douglas fir linkage same 10 homologous linkage groups were identified
between loblolly pine and maritime pine (Chagne´ et groupsPm-3andPm-13were syntenic with loblolly pine LG3, as werePm-9andPm-11with LG9 (Figure 1). One al.2003). All 12 homologous linkage groups were
identi-fied between loblolly pine and Scots pine, but only 10 of these syntenic linkage pairs could represent two dif-ferent chromosomes in Douglas fir. Orthologous linkage groups shared two and more orthologous
mark-ers (Komulainenet al.2003). Therefore, the intergeneric ers mapped in these groups would be good candidates for FISH to resolve this question.
maps in this study have identified practically all the same
homologous linkage groups as were found in the intra- Potential applications of comparative-mapping results: Comparative mapping is an important tool for integrat-generic pine maps.
Chromosomal evolution in Pinaceae:The high level ing genetic data among related taxa. It helps to
consoli-date genetic maps and bridge linkage gaps. For instance, of synteny and colinearity among species within the
Pinaceae supports the general hypothesis based on cyto- comparative mapping has helped to assign several small unlinked groups to the larger homologous linkage genetic data that major chromosomal rearrangements
have not been frequent in the evolution of the Pinaceae groups in pine species (Brownet al. 2001;Komulainen et al.2003). The loblolly pine⫻Douglas fir comparative (Prager et al.1976). Except in a few species, there is
no evidence for major chromosomal rearrangement or map now integrates the mapping data between different genera of the family Pinaceae and also between the polyploidy in Pinaceae (Prager et al. 1976). We also
observed substantial colinearity between genera at the two most important tree species in North America. For example, the QTL mapped in loblolly pine (Sewellet macrosyntenic level. Local noncolinearity was observed
only in LG6 and LG10 and could be easily explained al. 2000, 2002; Brownet al. 2003) and in Douglas fir (Jermstadet al.2001a,b, 2003) can now be compared by a single inversion (Figure 1). However, it would be
preliminary to speculate about local rearrangements across different genera the same way as it was done across different species within genus Eucalyptus (Marqueset and microcolinearity from these data. Local
noncolin-earity might also result from mapping paralogs and/or al.2002) and Pinus (Chagne´et al.2003). Mapped or-thologous markers that consistently associated with the other members of multigene families in the same
syn-tenic regions. Approximately 40% of all ESTP, STS, and same QTL across different species can be used to con-firm and verify QTL and to identify candidate genes for RFLP markers tested could serve as orthologous loci.
459 Comparative Mapping in the Pinaceae
Temesgenet al., 2001 Anchored reference loci in loblolly pine
be used with species of the remaining genera of
Pina-(Pinus taeda L.) for integrating pine genomics. Genetics 159:
ceae that also have worldwide importance, such as Picea, 799–809.
Brown, G. R., D. L. Bassoni, G. P. Gill, J. R. Fontana, N. C. Wheeler Larix, Abies, and Tsuga. For example, these markers have
et al., 2003 Identification of quantitative trait loci influencing
recently been used to construct a comparative map
be-wood property traits in loblolly pine (Pinus taedaL.). III. QTL
tween loblolly pine and Norway spruce (our unpub- verification and candidate gene mapping. Genetics164:1537–
1546.
lished data) that will further contribute toward a deeper
Chagne´, D., G. R. Brown, C. Lalanne, D. Madur, D. Potet al., 2003
understanding of the evolution of conifer genomes.
Comparative genome and QTL mapping between maritime and
Establishing Pinaceae as a genetic system: We were loblolly pines. Mol. Breed.12:185–195.
Chang, S., J. PuryearandJ. Cairney, 1993 A simple and efficient
able to establish basic syntenic relationships in Pinaceae.
method for isolating RNA from pine trees. Plant Mol. Biol. Rep.
High synteny and conserved gene order found in this
11:113–116.
study for such distantly related species as Douglas fir Davis, G. L., M. D. Mcmullen, C. Baysdorfer, T. Musket, D. Grant
et al., 1999 A maize map standard with sequenced core markers,
and loblolly pine open the possibility of comparative
grass genome reference points, and 932 expressed sequence
mapping at the family level and establish a comparative
tagged sites (ESTs) in a 1736 locus map. Genetics152:1137–1172.
genomics framework in Pinaceae that can now be viewed Devey, M. E., K. D. Jermstad, C. G. TauerandD. B. Neale, 1991
Inheritance of RFLP loci in a loblolly pine three-generation
pedi-as a genetic system. However, more studies are needed
gree. Theor. Appl. Genet.83:238–242.
to establish a comparative genomics system that would
Devey, M. E., T. A. Fiddler, B.-H. Liu, S. J. KnappandD. B. Neale,
rival the existing model systems. ESTs represent a good 1994 An RFLP linkage map for loblolly pine based on a
three-generation outbred pedigree. Theor. Appl. Genet.88:273–278.
alternative to complete genome sequencing for
non-Devey, M. E., M. M. Sewell, T. L. UrenandD. B. Neale, 1999
Com-model organisms or organisms with large genomes, such
parative mapping in loblolly and radiata pine using RFLP and
as conifers. As more conifer EST and genomic sequences microsatellite markers. Theor. Appl. Genet.99:656–662. Doerksen, A. H., andK. K. Ching, 1972 Karyotypes in the genus
become available in public databases their homology
Pseudotsuga.For. Sci.18:66–69.
can be tested and more orthologs can be established.
Doganlar, S., A. Frary, M. C. Daunay, R. N. LesterandS. D. Tanksley, 2002 Conservation of gene function in the Solana-We thank the members of the Conifer Comparative Genomics
Proj-ceae as revealed by comparative mapping of domestication traits ect for their participation and contributions; Valerie Hipkins and
in eggplant. Genetics161:1713–1726. Randy Meyer (U.S. Department of Agriculture (USDA) Forest Service,
Ewing, B., L. Hillier, M. WendlandP. Green, 1998 Base-calling of National Forest Gel Electrophoresis Laboratory) for isozyme analysis in
automated sequencer traces usingphred. I. Accuracy assessment. Douglas fir; Thomas Adams, Glenn Howe, and Gancho Slavov (Oregon
Genome Res.8:175–185.
State University) for SSR genotyping; Nicholas Wheeler (Weyerhaeuser) Ewing, B., andP. Green, 1998 Base-calling of automated sequencer for providing the reference mapping populations; Santiago Gonzalez- traces usingphred. II. Error probabilities. Genome Res.8:186– Martinez (Department of Biotechnology and Breeding, Center of 194.
Forest Research, Spain) and Geoffrey Gill (ViaLactia Biosciences, Feuillet, C., andB. Keller, 2002 Comparative genomics in the grass family: molecular characterization of grass genome struc-Auckland, New Zealand) for help in marker development; and
Jenni-ture and evolution. Ann. Bot.89:3–10. fer Manares (University of California, Davis) for technical assistance
Fitch, W. M., 1970 Distinguishing homologous from analogous with PCR and gel electrophoresis. Funding for this project was
pro-teins. Syst. Zool.19:99–113. vided by the USDA Plant Genome National Research Initiative (USDA
Fitch, W. M., 2000 Homology: a personal view on some of the National Research Initiative grant no. 00-35300-9316). Trade names
problems. Trends Genet.16:227–231.
and commercial products or enterprises are mentioned solely for Frankis, M. P., 1989 Generic inter-relationships in Pinaceae. Notes information and no endorsement by the USDA is implied. R. Bot. Gard. Edinb.45:527–548.
Freeling, M., 2001 Grasses as a single genetic system. Reassessment 2001. Plant Physiol.125:1191–1197.
Fulton, T. M., R. Van der Hoeven, N. T. Eannetta andS. D. Tanksley, 2002 Identification, analysis, and utilization of
con-LITERATURE CITED
served ortholog set markers for comparative genomics in higher
Ahn, S., J. A. Anderson, M. E. SorrellsandS. D. Tanksley, 1993 plants. Plant Cell14:1457–1467.
Homoeologous relationships of rice, wheat and maize chromo- Gale, M. D., andK. M. Devos, 1998 Comparative genetics in the somes. Mol. Gen. Genet.241:483–490. grasses. Proc. Natl. Acad. Sci. USA95:1971–1974.
Allona, I., M. Quinn, E. Shoop, K. Swope, S. St. Cyret al., 1998 Gebhardt, C., B. Walkemeier, H. Henselewski, A. Barakat, M. Analysis of xylem formation in pine by cDNA sequencing. Proc. Delsenyet al., 2003 Comparative mapping between potato ( So-Natl. Acad. Sci. USA95:9693–9698. lanum tuberosum) andArabidopsis thalianareveals structurally
con-Babula, D., M. Kaczmarek, A. Barakat, M. Delseny, C. F. Quiros served domains and ancient duplications in the potato genome. et al., 2003 Chromosomal mapping ofBrassica oleraceabased on Plant J.34:529–541.
ESTs fromArabidopsis thaliana: complexity of the comparative Grant, D., P. CreganandR. C. Shoemaker, 2000 Genome organi-map. Mol. Genet. Genomics268:656–665. zation in dicots: genome duplication inArabidopsisand synteny
Bailey, N. T. J., 1961 Mathematical Theory of Genetic Linkage. Clarendon between soybean andArabidopsis.Proc. Natl. Acad. Sci. USA97:
Press, London. 4168–4173.
Barnes, S., 2002 ComparingArabidopsisto other flowering plants. Gordon, D., C. AbajianandP. Green, 1998 Consed: a graphical
Curr. Opin. Plant Biol.5:128–134. tool for sequence finishing. Genome Res.8:195–202.
Bennett, M. D., andI. J. Leitch, 2003 Plant DNAC-values database Gordon, D., C. DesmaraisandP. Green, 2001 Automated finishing (release 2.0, January 2003). http://www.rbgkew.org.uk/cval/ with autofinish. Genome Res.11:614–625.
homepage.html. Hall, A. E., A. FiebigandD. Preuss, 2002 Beyond the Arabidopsis
Bennett, M. D., andJ. B. Smith, 1991 Nuclear DNA amounts in genome: opportunities for comparative genomics. Plant Physiol. angiosperms. Philos. Trans. R. Soc. Lond. B334:309–345. 129:1439–1447.
Boutin, S. R., N. D. Young, T. Olson, Z.-H. Yu, R. C. Shoemaker Jermstad, K. D., A. M. Reem, N. C. Wheelerand D. B. Neale, et al., 1995 Genome conservation among three legume genera 1994 Inheritance of restriction fragment length polymor-detected with DNA markers. Genome38:928–937. phisms, random amplified polymorphic DNAs and isozymes in
coastal Douglas-fir. Theor. Appl. Genet.89:758–766.
461 Comparative Mapping in the Pinaceae
Jermstad, K. D., D. L. Bassoni, N. C. WheelerandD. B. Neale, 1998 Rydin, C., M. Ka¨llersjo¨andE. M. Friis, 2002 Seed plant relation-A sex-averaged linkage map in coastal Douglas-fir (Pseudotsuga ships and the systematic position of Gnetales based on nuclear menziesii [Mirb.] Franco) based on RFLP and RAPD markers. and chloroplast DNA: conflicting data, rooting problems, and Theor. Appl. Genet.97:762–770. the monophyly of conifers. Int. J. Plant Sci.163:197–214.
Jermstad, K. D., D. L. Bassoni, K. S. Jech, N. C. WheelerandD. B. Sankoff, D., andJ. H. Nadeau(Editors), 2000 Comparative Genomics: Neale, 2001a Mapping of quantitative trait loci controlling Empirical and Analytical Approaches to Gene Order Dynamics, Map adaptive traits in coastal Douglas-fir: I. Timing of vegetative bud Alignment and the Evolution of Gene Families(Computational Biology flush. Theor. Appl. Genet.102:1142–1151. Series, Vol. 1). Kluwer Academic Publishers, Dordrecht, The
Jermstad, K. D., D. L. Bassoni, N. C. Wheeler, T. S. Anekonda, Netherlands.
S. N. Aitken et al., 2001b Mapping of quantitative trait loci Sasaki, T., andR. R. Sederoff, 2003 Genome studies and molecular controlling adaptive traits in coastal Douglas-fir: II. Spring and genetics. The rice genome and comparative genomics of higher fall cold-hardiness. Theor. Appl. Genet.102:1152–1158. plants. Curr. Opin. Plant Biol.6:97–100.
Jermstad, K. D., D. L. Bassoni, K. S. Jech, G. A. Ritchie, N. C. Schmidt, R., 2002 Plant genome evolution: lessons from
compara-Wheeleret al., 2003 Mapping of quantitative trait loci control- tive genomics at the DNA level. Plant Mol. Biol.48:21–37. ling adaptive traits in coastal Douglas-fir: III. QTL by environment Schubert, R., G. Mueller-StarckandR. Riegel, 2001 Develop-interactions. Genetics165:1489–1506. ment of EST-PCR markers and monitoring their
intrapopula-Kinlaw, C. S., andD. B. Neale, 1997 Complex gene families in tional genetic variation in Picea abies (L.) Karst. Theor. Appl.
pine genomes. Trends Plant Sci.2:356–359. Genet.103:1223–1231.
Kirst, M., A. F. Johnson, C. Baucom, E. Ulrich, K. Hubbardet Sewell, M. M., B. K. ShermanandD. B. Neale, 1999 A consensus al., 2003 Apparent homology of expressed genes from wood- map for loblolly pine (Pinus taedaL.). I. Construction and integra-forming tissues of loblolly pine (Pinus taedaL.) withArabidopsis tion of individual linkage maps from two outbred three-genera-thaliana.Proc. Natl. Acad. Sci. USA100:7383–7388. tion pedigrees. Genetics151:321–330.
Klein, P. E., R. R. Klein, J. VrebalovandJ. E. Mullet, 2003 Se- Sewell, M. M., D. L. Bassoni, R. A. Megraw, N. C. Wheelerand quence-based alignment of sorghum chromosome 3 and rice D. B. Neale, 2000 Identification of QTLs influencing wood chromosome 1 reveals extensive conservation of gene order and property traits in loblolly pine (Pinus taedaL.). I. Physical wood one major chromosomal rearrangement. Plant J.34:605–621. properties. Theor. Appl. Genet.101:1273–1281.
Kliebenstein, D. J., J. GershenzonandT. Mitchell-Olds, 2001 Sewell, M. M., M. F. Davis, G. A. Tuskan, N. C. Wheeler, C. C. Comparative quantitative trait loci mapping of aliphatic, indolic Elamet al., 2002 Identification of QTLs influencing wood prop-and benzylic glucosinolate production in Arabidopsis thaliana erty traits in loblolly pine (Pinus taedaL.). II. Chemical wood leaves and seeds. Genetics159:359–370. properties. Theor. Appl. Genet.104:214–222.
Komulainen, P., G. R. Brown, M. Mikkonen, A. Karhu, M. R. Gar- Sherman, J. D., A. L. Fenwick, D. M. NamuthandN. L. V. Lapitan, cia-Gilet al., 2003 Comparing EST-based genetic maps between 1995 A barley RFLP map: alignment of three barley maps and Pinus sylvestrisandPinus taeda.Theor. Appl. Genet.107:667–678. comparisons to Gramineae species. Theor. Appl. Genet.91:681–
Krutovskii, K. V., S. S. Vollmer, F. C. Sorensen, W. Th. Adams, 690.
S. J. Knappet al., 1998 RAPD genome maps of Douglas-fir. J. Smilde, W. D., J. Halusˇkova, T. SasakiandA. Graner, 2001 New
Hered.89:197–205. evidence for the synteny of rice chromosome 1 and barley
chro-Lan, T. H., T. A. DelMonte, K. P. Reischmann, J. Hyman, S. P. mosome 3 H from rice expressed sequence tags. Genome 44: Kowalski et al., 2000 An EST-enriched comparative map of 361–367.
Brassica oleraceaandArabidopsis thaliana.Genome Res.10:776– Stam, P., 1993 Construction of integrated genetic linkage maps by
788. means of a new computer package: JoinMap. Plant J.3:739–744.
Laurie, D. A., andK. M. Devos, 2002 Trends in comparative genet- Stam, P., andJ. W. Van Ooijen, 1995 JOINMAP Version 2.0: Software ics and their potential impacts on wheat and barley research.
for the Calculation of Genetic Linkage Maps. CPRO-DLO,
Wagen-Plant Mol. Biol.48:729–740. ingen, The Netherlands.
Leitch, I. J., L. Hanson, M. Winfield, J. ParkerandM. D. Bennett,
Temesgen, B., D. B. NealeandD. E. Harry, 2000 Use of haploid 2001 Nuclear DNA C-values complete familial representation mixtures and heteroduplex analysis enhance polymorphisms re-in gymnosperms. Ann. Bot.88:843–849.
vealed by denaturing gradient gel electrophoresis.
BioTech-Lukens, L., F. Zou, D. Lydiate, I. Parkin and T. Osborn, niques
28:114–122. 2003 Comparison of aBrassica oleraceagenetic map with the
Temesgen, B., G. R. Brown, D. E. Harry, C. S. Kinlaw, M. M.
genome ofArabidopsis thaliana.Genetics164:359–372.
Sewellet al., 2001 Genetic mapping of expressed sequence tag
Marques, C. M., R. P. V. Brondani, D. GrattapagliaandR. Sederoff,
polymorphism (ESTP) markers in loblolly pine (Pinus taedaL.). 2002 Conservation and synteny of SSR loci and QTLs for
vegeta-Theor. Appl. Genet.102:664–675. tive propagation in fourEucalyptusspecies. Theor. Appl. Genet.
Yan, H. H., J. Mudge, D. J. Kim, D. Larsen, R. C. Shoemakeret al., 105:474–478.
2003 Estimates of conserved microsynteny among the genomes
Mirny, L. A., andM. S. Gelfand, 2002 Using orthologous and
ofGlycine max, Medicago truncatulaandArabidopsis thaliana.Theor. paralogous proteins to identify specificity-determining residues
Appl. Genet.106:1256–1265. in bacterial transcription factors. J. Mol. Biol.321:7–20.
Wang, X.-Q., D. C. TankandT. Sang, 2000 Phylogeny and
diver-Morton, N. E., 1991 Parameters of the human genome. Proc. Natl.
gence times in Pinaceae: evidence from three genomes. Mol. Acad. Sci. USA88:7474–7476.
Biol. Evol.17:773–781.
Murphy, W. J., R. StanyonandS. J. O’Brien, 2001 Evolution of
Ware, D., andL. Stein, 2003 Comparison of genes among cereals. mammalian genome organization inferred from comparative
Curr. Opin. Plant Biol.6:121–127. gene mapping. Genome Biol.2:1–8.
Ware, D. H., P. Jaiswal, J. Ni, I. V. Yap, X. Panet al., 2002 Gramene,
Murray, B., 1998 Nuclear DNA amounts in gymnosperms. Ann.
a tool for grass genomics. Plant Physiol.130:1606–1613. Bot.82(Suppl. A): 3–15.
Whetten, R., Y. H. Sun, Y. ZhangandR. Sederoff, 2001 Functional
Ott, J., 1991 Analysis of Human Genetic Linkage. Johns Hopkins
Uni-genomics and cell wall biosynthesis in loblolly pine. Plant Mol. versity Press, Baltimore/London.
Biol.47:275–291.
Paterson, A. H., J. E. Bowers, M. D. Burow, X. Draye, C. G. Elsik
Zhang, J., H. G. Zheng, A. Aarti, G. Pantuwan, T. T. Nguyenet et al., 2000 Comparative genomics of plant chromosomes. Plant
al., 2001 Locating genomic regions associated with components Cell12:1523–1540.
of drought resistance in rice: comparative mapping within and
Perry, D. J., andJ. Bousquet, 1998a Sequence-tagged-site (STS)
markers of arbitrary genes: development, characterization and across species. Theor. Appl. Genet.103:19–29.
analysis of linkage in Black spruce. Genetics149:1089–1098. Zhu, H., D.-J. Kim, J.-M. Baek, H.-K. Choi, L. C. Elliset al., 2003
Perry, D. J., andJ. Bousquet, 1998b Sequence-Tagged-Site (STS) Syntenic relationships between Medicago truncatula and Arabi-markers of arbitrary genes: the utility of black spruce-derived dopsis reveal extensive divergence of genome organization. Plant primers in other conifers. Theor. Appl. Genet.97:735–743. Physiol.131:1018–1026.
Prager, E. M., D. P. Fowlerand A. C. Wilson, 1976 Rates of